Red blood cell distribution width (RDW) was found to be a useful parameter in a variety of cardiovascular and thrombotic disorders. Therefore, we conducted a retrospective case–control study to establish whether an association exists between RDW and venous thrombosis. The study population consisted of 431 consecutive patients who received a diagnosis of venous thrombosis in the emergency department (ED), thus including cases of superficial venous thrombosis, deep vein thrombosis (DVT), and/or pulmonary embolism (PE). The control population consisted of 967 matched outpatients who underwent routine laboratory testing. The RDW values were found to be significantly increased in patients with venous thrombosis compared to controls, with an incremental trend of values from patients with superficial thrombosis, isolate DVT, to PE. Increased RDW values were an independent risk factor for isolate DVT and PE, displaying a relative risk that was greater in patients with provoked DVT and PE that in those with unprovoked thrombosis after multiple adjustment for age, gender, hemoglobin, and mean corpuscular volume. Interestingly, RDW also exhibited a significant diagnostic performance at ED admission, displaying an area under the curve of 0.65 (95% confidence interval [CI] 0.62 to 0.68; p <0.001) for all cases of venous thrombosis, 0.63 (95% CI 0.59 to 0.68; p <0.001) for isolate DVT, and 0.70 (95% CI 0.65 to 0.75; p <0.001) for PE. The results of this study suggest that increased RDW not only is associated with venous thrombosis but may also increase the efficiency of baseline risk assessment of patients with suspected venous thrombosis on ED admission.
It is now well established that the identification of clinical and biological correlates of venous thrombosis represents a cornerstone for preventing both venous thromboembolism (VTE) and superficial venous thrombosis. Recent evidence attests that the red blood cell distribution width (RDW), a conventional measure of anisocytosis, might be a useful parameter for gathering meaningful clinical information, either diagnostic or prognostic, on a variety of cardiovascular and thrombotic disorders. In particular, although a convincing association has been demonstrated between RDW values and all-cause, noncardiac, and cardiac mortality in patients with coronary heart disease, scarce and even contradictory information is available on the relation between anisocytosis and venous thrombosis. Therefore, we conducted a retrospective case–control study to establish whether an association may exist between anisocytosis and venous thrombosis.
Methods
The study population consisted of all consecutive patients who received a diagnosis of venous thrombosis (i.e., superficial venous thrombosis, deep vein thrombosis [DVT], and/or pulmonary embolism [PE]) at the emergency department (ED) of the University Hospital of Parma (Italy) during the entire year of 2014. The facility is a 1,250-bed teaching general hospital, serving a population of approximately 435,000 inhabitants. The diagnoses of venous thrombosis, which were always made in the local facility in accord with the guidelines of the American College of Chest Physicians, were systematically extracted from local hospital records according to specific International Classification of Diseases, Ninth Revision, codes and related diagnostic terms. Unprovoked thrombosis was defined according to conventional criteria, as having none of the following risk factors: pregnancy, cancer in the past 5 years, recent (i.e., in the past 3 months) surgery, trauma, hospitalization, immobilization, or long-haul flight (>4 hours). The data were then reviewed by 2 expert physicians for deleting wrong or dubious records. The controls consisted in a matched population of outpatients from the same geographical area, who underwent routine laboratory testing for health check-up during the entire year of 2014. Subjects with a previous diagnosis of venous thrombosis (n = 17) as reported in the medical prescription (the inclusion of the diagnosis in the medical prescription is mandatory in Italy) were excluded. Notably, only venous thrombosis diagnosed in the local ED has been included, thus excluding all episodes diagnosed during hospital staying. The complete blood cell count, thus including the assessment of hemoglobin, mean corpuscular volume (MCV), and RDW, was performed in blood samples (13 × 75, 2.0-ml plastic whole blood tube containing spray-coated K 2 EDTA; Becton Dickinson Italia S.p.A., Milan, Italy) collected from cases at ED admission and from outpatients during the health check-up, respectively. All measurements were concluded within 2 hours from blood drawing, using an identical hematologic analyzer (Sysmex XE-2100; Sysmex Co., Kobe, Japan). The quality and comparability of results was guaranteed by routine performance of internal quality controls and participation to an external quality assessment scheme.
Results were finally shown as median and interquartile range or percentage. The significance of difference was analyzed with Mann–Whitney test (for continuous variables) and Pearson chi-square test (for categorical values). A multivariate analysis was also used to identify potential associations with venous thrombosis. Diagnostic significance was estimated by receiver operating characteristics curve. The crude and multivariate adjusted relative risk with 95% confidence interval (CI) was finally estimated. The analyses including RDW values were based on dichotomous exposures, using the instrument-specific cut-off value of 14.6%. Statistical analysis was performed using Analyse-it (Analyse-it Software Ltd, Leeds, UK) and MedCalc Version 12.3.0 (MedCalc Software, Mariakerke, Belgium). This retrospective study was performed in accordance with the Declaration of Helsinki, under the terms of relevant local legislation, and was cleared by the institutional review board.
Results
A total number of 431 patients received a final diagnosis of venous thrombosis throughout the study period after excluding inappropriate or dubious records. For statistical analysis, patients with a diagnosis of isolate PE (n = 117) and those with both DVT and PE (n = 43) were grouped in the same class (i.e., PE). Overall, 149 patients were diagnosed with provoked thrombosis (55 with primary diagnosis of cancer, 16 with recent trauma, 14 with infections, 10 with recent surgery, 2 in the postpartum period, and the remaining 55 with other causes).
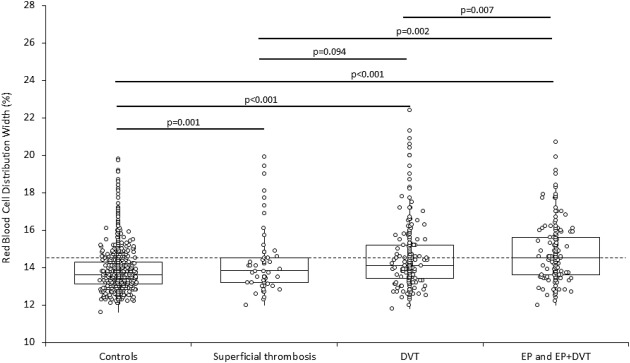
The main characteristics of the entire study population are provided in Table 1 . No significant differences were observed for age, gender, hemoglobin, and MCV when the control population was compared to patients with venous thrombosis, except for the older age of patients with PE and the younger age of those with superficial venous thrombosis. The RDW values were significantly increased in all the different populations of patients with venous thrombosis, exhibiting an incremental trend from patients with superficial thrombosis to those with isolate DVT and those with isolate PE or DVT plus PE ( Figure 1 ). Interestingly, the RDW values were also greater in patients with isolate PE or DVT plus PE compared to those with superficial thrombosis or isolate DVT, whereas no difference was found between patients with superficial thrombosis or isolate DVT ( Figure 1 ). The frequency of patients with RDW values >14.6% was similar between controls and patients with superficial venous thrombosis, whereas it was nearly double in both the populations of patients with all types of venous thrombosis and isolate DVT and was even greater in patients with isolate PE or DVT plus PE. A similar trend was observed when patients were stratified according to unprovoked or provoked thrombosis ( Table 2 ). In multivariate analysis, in which the diagnosis of venous thrombosis was entered as dependent variable whereas age, gender, hemoglobin, MCV and RDW were entered as independent variables, a diagnosis of all types of venous thrombosis was found to be significantly associated with gender (β coefficient −0.06; p = 0.020), age (β coefficient −0.01, p = 0.024), and RDW (β coefficient 0.11; p <0.001); superficial venous thrombosis was found to be significantly associated with gender (β coefficient −0.033; p = 0.046), age (β coefficient −0.02; p <0.001), and RDW (β coefficient 0.029; p <0.001); isolate DVT was found to be significantly associated with age (β coefficient −0.02; p = 0.007) and RDW (β coefficient 0.08; p <0.001), whereas PE was found to be significantly associated with gender (β coefficient −0.05; p = 0.025) and RDW (β coefficient 0.09; p <0.001). Accordingly, increased RDW values were found to be a significant risk factor for isolate DVT and PE, exhibiting a relative risk that was greater in patients with provoked DVT and PE that in those with unprovoked thrombosis both in unadjusted analysis and after multiple adjustment for age, gender, hemoglobin, and MCV ( Table 3 ). Interestingly, RDW exhibited a significant diagnostic performance at ED admission, with an area under the curve (AUC) of 0.65 (95% CI 0.62 to 0.68; p <0.001) for all cases of venous thrombosis, 0.63 (95% CI 0.59 to 0.68; p <0.001) for isolate DVT, and 0.70 (95% CI 0.65 to 0.75; p <0.001) for PE, respectively ( Figure 2 ). The conventional cut-off value of 14.6% was characterized by 0.75 negative predictive value (NPV) and 0.48 positive predictive value (PPV) for all cases of venous thrombosis, 0.85 NPV and 0.30 PPV for DVT, and 0.91 NPV and 0.30 PPV for PE, respectively. Unlike VTE, the diagnostic value of RDW was found to be poor for superficial venous thrombosis (AUC 0.57; 95% CI 0.49 to 0.65; p = 0.051).
| Variable | Controls | All cases | p ∗ | Superficial thrombosis | p ∗ | DVT | p ∗ | PE and DVT + PE | p ∗ |
|---|---|---|---|---|---|---|---|---|---|
| n=967 | n=431 | – | n=58 | – | n=213 | – | n=160 | – | |
| Age (years) | 72 (59-82) | 75 (60-84) | 0.265 | 67 (52-77) | <0.001 | 74 (57-83) | 0.309 | 78 (69-86) | <0.001 |
| Women | 567/967 (59%) | 268/431 (62%) | 0.117 | 39/58 (67%) | 0.124 | 127/213 (60%) | 0.425 | 102/160 (64%) | 0.129 |
| Unprovoked thrombosis | – | 282/431 (65%) | – | 44/58 (76%) | – | 149/213 (70%) | – | 88/160 (55%) | – |
| Hemoglobin (g/L) | 136 (128-147) | 137 (124-148) | 0.103 | 138 (127-148) | 0.380 | 137 (125-144) | 0.057 | 139 (123-148) | 0.290 |
| MCV (fL) | 90.0 (86.9-92.8) | 89.9 (86.4-93.7) | 0.401 | 89.1 (83.6-92.6) | 0.001 | 89.7 (86.7-93.6) | 0.411 | 91.0 (86.8-94.1) | 0.172 |
| RDW (%) | |||||||||
| Values | 13.6 (13.1-14.3) | 14.2 (13.5-15.2) | <0.001 | 13.9 (13.2-14.5) | 0.001 | 14.1 (13.4-15.2) | <0.001 | 14.5 (13.6-15.6) | <0.001 |
| RDW >14.5% | 201/967 (21%) | 179/431 (42%) | <0.001 | 16/58 (28%) | 0.143 | 81/213 (38%) | <0.001 | 82/160 (51%) | <0.001 |
| Unprovoked | Controls | All cases | p ∗ | Superficial thrombosis | p ∗ | DVT | p ∗ | PE and DVT + PE | p ∗ |
|---|---|---|---|---|---|---|---|---|---|
| n=967 | n=282 | – | n=44 | – | n=149 | – | n=88 | – | |
| Age (years) | 72 (59-82) | 76 (60-85) | 0.126 | 64 (50-76) | <0.001 | 76 (61-84) | 0.251 | 80 (69-87) | <0.001 |
| Women | 567/967 (59%) | 183 (65%) | 0.035 | 30/44 (68%) | 0.135 | 90/149 (60%) | 0.375 | 63/88 (72%) | 0.012 |
| RDW | |||||||||
| Values (%) | 13.6 (13.1-14.3) | 14.1 (13.4-14.9) | <0.001 | 13.9 (13.3-14.5) | 0.001 | 14.0 (13.3-14.7) | <0.001 | 14.3 (13.4-15.2) | <0.001 |
| RDW >14.5% | 201/967 (21%) | 101/282 (36%) | <0.001 | 13/44 (30%) | 0.115 | 46/149 (31%) | 0.004 | 41/88 (47%) | <0.001 |
| Provoked | n=967 | n=149 | – | n=14 | – | n=64 | – | n=72 | – |
|---|---|---|---|---|---|---|---|---|---|
| Age (years) | 72 (59-82) | 74 (59-82) | 0.326 | 71 (59-77) | 0.179 | 71 (56-80) | 0.018 | 76 (68-85) | 0.043 |
| Women | 567/967 (59%) | 85 (57%) | 0.391 | 9/14 (64%) | 0.439 | 37/64 (58%) | 0.449 | 39/72 (54%) | 0.268 |
| RDW | |||||||||
| Values (%) | 13.6 (13.1-14.3) | 14.6 (13.7-15.7) | <0.001 | 14.0 (13.1-14.3) | 0.232 | 14.6 (13.8-15.8) | <0.001 | 14.8 (13.9-15.8) | <0.001 |
| RDW >14.5% | 201/967 (21%) | 78/149 (52%) | <0.001 | 3/14 (21%) | 0.476 | 35/64 (55%) | <0.001 | 41/72 (57%) | <0.001 |
Stay updated, free articles. Join our Telegram channel

Full access? Get Clinical Tree


