Total and differential leukocyte counts are useful inflammatory biomarkers. The ability of the neutrophil-to-lymphocyte ratio (NLR) to predict outcomes in patients with Kawasaki disease (KD) was assessed in this study. All patients with KD who underwent consecutive complete blood count analyses during the acute febrile phase before intravenous immunoglobulin (IVIG), 2 days after IVIG regardless of defervescence, and 3 to 4 weeks after defervescence were enrolled. NLR was calculated by dividing the neutrophil count by the lymphocyte count. NLR values that best predicted IVIG resistance and the development of coronary artery abnormalities were determined by receiver-operating characteristic curve and multivariate analyses. Of the 587 patients with KD, 222 were IVIG resistant. IVIG-resistant patients had higher NLRs than IVIG-responsive patients. The best NLR cut-off values during the acute febrile phase and 2 days after IVIG for predicting IVIG resistance were 5.49 (p <0.001) and 1.26 (p <0.001), respectively. Sixty-two patients developed coronary artery abnormalities; 47 had coronary dilatation, and 15 had aneurysms. Patients with aneurysms, but not patients with dilatation, had higher NLRs than patients without coronary artery abnormalities. The best NLR cut-off value 2 days after IVIG for predicting aneurysm development was 1.01 (p <0.001). Multivariate analysis revealed that the NLR 2 days after IVIG independently predicted coronary aneurysm development (p = 0.03) and IVIG resistance (p <0.001). In conclusion, the NLR can be used for risk stratification in patients with KD. An NLR 2 days after IVIG that exceeded 1 was predictive of coronary aneurysm development and IVIG resistance.
Kawasaki disease (KD) is a vasculitis that particularly affects the coronary arteries. Systemic inflammation plays an important role in KD pathogenesis, but specific disease markers are lacking. Instead, the diagnosis depends on characteristic clinical findings. However, if these findings are not found, laboratory data can be used to support a diagnosis of KD. Because uncontrolled and persistent inflammation promotes poor outcomes such as the development of coronary artery abnormalities (CAAs) as well as intravenous immunoglobulin (IVIG) resistance, biomarkers of inflammation may be useful for diagnosis and prognosis. Leukocytes are the main mediators of inflammation, and changes in their populations reflect the response of the immune system to systemic inflammation. In general, neutrophils are considered a marker of ongoing nonspecific inflammation, while lymphocytes are a marker of the immune regulatory response. The neutrophil-to-lymphocyte ratio (NLR) thus represents the balance between inflammation and immune regulation. The NLR has been reported to be a powerful biomarker of surgical stress, systemic inflammation, and sepsis, as the severity and clinical courses of such conditions correlate with neutrophilia and lymphocytopenia. Moreover, the NLR is believed to be predictive of the severity of coronary artery disease. In patients with KD, the acute febrile phase is associated with normal to elevated leukocyte counts with predominant neutrophils. However, the value of the NLR for predicting outcomes in patients with KD has never been evaluated. The present retrospective cohort study was performed to determine whether the NLR can predict clinical outcomes, namely, CAAs and IVIG resistance, in patients with KD.
Methods
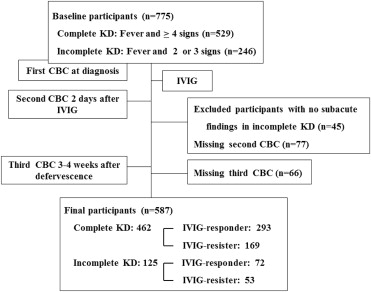
This retrospective cohort study was approved by the institutional review board of Korea University Medical Center. The medical records of all consecutive patients with KD who were treated at the center from January 2008 to December 2013 were reviewed. KD was diagnosed when a patient exhibited ≥5 principal clinical manifestations, including fever >38°C. When the clinical manifestations did not fulfill the diagnostic criteria but other diagnoses could be excluded, incomplete KD was diagnosed if the patient had symptoms that associate frequently with KD and elevated inflammatory indexes. Of the patients with incomplete KD, only those who exhibited typical subacute findings later, such as skin peeling or thrombocytosis, were included in this analysis. Of the patients with complete and incomplete KD who were identified, only those whose total and differential leukocyte counts were measured during the acute febrile phase before IVIG, 2 days after IVIG (regardless of whether defervescence had occurred), and 3 to 4 weeks after defervescence were included in the study ( Figure 1 ). The total and differential leukocyte counts in each blood sample were measured using an automated blood cell counter. The NLR was calculated by dividing the neutrophil count by the lymphocyte count.
All patients were initially treated with IVIG (2 g/kg), and IVIG resistance was defined as persistent or recrudescent fever for >48 hours after IVIG completion. Echocardiography was performed during the acute febrile phase and repeated 3 to 4 and 8 to 10 weeks later. CAAs were diagnosed on the basis of the criteria proposed by the Japanese Kawasaki Disease Research Committee in 1984. Patients who had CAAs at any time, regardless of whether they resolved later, were considered to have CAAs. This CAA group was further subdivided into those who exhibited dilatation and those who exhibited aneurysm.
Statistical analysis was performed using SPSS version 20 (SPSS, Inc., Chicago, Illinois). Data are expressed as mean ± SE or as percentages, as appropriate. The groups were compared in terms of nominal data using chi-square tests and in terms of continuous data using unpaired Student’s t tests. To examine the significance of changes in leukocyte profiles over time within each group, paired Student’s t tests were performed. To assess the ability of the NLR to predict IVIG resistance and CAA development, receiver-operating characteristic curves were constructed, and the most discriminating cut-off values were identified. Variables that showed significant differences between the groups on univariate analysis were tested again by multivariate logistic regression analysis. A p value <0.05 was considered to indicate statistical significance.
Results
In the analysis of NLR as a predictor of IVIG resistance, 222 of 587 patients with KD were IVIG resistant (38%). Comparison of the IVIG-responsive and IVIG-resistant groups in terms of demographic and clinical variables ( Table 1 ) revealed that the IVIG-resistant patients were more likely to be male, to be treated with IVIG earlier after the fever started, and to develop coronary dilatation or aneurysm. During the acute febrile phase, the 2 groups did not differ significantly in terms of total leukocyte counts, but the IVIG-resistant group had significantly more neutrophils. These patients also tended to have fewer lymphocytes, although this difference did not achieve statistical significance. As a result, the IVIG-resistant group had a significantly higher mean NLR than the IVIG-responsive group. Two days after IVIG started, the 2 groups exhibited significant decreases in total leukocyte and neutrophil counts relative to the previous counts (all p values <0.001 in the present study). However, the IVIG-resistant group continued to have a higher mean NLR than the IVIG-responsive group. However, 3 to 4 weeks after defervescence, the 2 groups no longer exhibited any differences in terms of total counts, differential counts, or NLR.
| Variable | IVIG-responsive ( n = 365) | IVIG-resistant ( n = 222) | P |
|---|---|---|---|
| Male | 205 (56.2%) | 134 (60.4%) | 0.03 |
| Age, months | 33.95 ± 1.17 | 34.22 ± 1.63 | 0.95 |
| Number of symptoms | 3.95 ± 0.04 | 3.88 ± 0.06 | 0.05 |
| Days of pre-IVIG fever | 5.09 ± 0.09 | 3.97 ± 0.14 | <0.001 |
| Days of post-IVIG fever | 1.16 ± 0.04 | 4.82 ± 0.13 | <0.001 |
| Days of total fever | 6.26 ± 0.08 | 8.84 ± 0.19 | <0.001 |
| CAA(+) | 26 (7.1%) | 36 (16.2%) | <0.001 |
| Aneurysm | 6 (1.6%) | 9 (4.0%) | <0.001 |
| 1st Blood ∗ | |||
| White blood cells (/μL) | 13939.59 ± 267.78 | 14680.77 ± 372.51 | 0.21 |
| Neutrophils (/μL) | 9131.77 ± 230.22 | 10918.91 ± 354.70 | 0.004 |
| Lymphocytes (/μL) | 4425.37 ± 917.61 | 2619.61 ± 110.13 | 0.24 |
| Monocytes (/μL) | 732.15 ± 23.26 | 757.22 ± 33.63 | 0.06 |
| Eosinophils (/μL) | 355.57 ± 21.13 | 255.18 ± 20.06 | 0.011 |
| NLR | 3.69 ± 0.23 | 6.73 ± 0.52 | <0.001 |
| Platelet counts (K/μL) | 368.86 ± 5.45 | 334.63 ± 7.05 | 0.54 |
| Erythrocyte sedimentation rate (mm/hr) | 78.76 ± 1.58 | 76.52 ± 2.10 | 0.31 |
| C-reactive protein (mg/L) | 98.65 ± 5.19 | 97.54 ± 4.46 | 0.47 |
| 2nd Blood † | |||
| White blood cells (/μL) | 7869.37 ± 157.00 | 10976.52 ± 321.74 | <0.001 |
| Neutrophils (/μL) | 2751.97 ± 108.12 | 5716.89 ± 278.08 | <0.001 |
| Lymphocytes (/μL) | 3914.81 ± 83.38 | 3817.20 ± 122.62 | 0.01 |
| Monocytes (/μL) | 606.85 ± 18.23 | 830.28 ± 29.68 | <0.001 |
| Eosinophils (/μL) | 460.87 ± 18.16 | 442.27 ± 24.25 | 0.03 |
| NLR | 0.83 ± 0.05 | 2.09 ± 0.19 | <0.001 |
| Platelet counts (K/μL) | 458.08 ± 7.67 | 444.00 ± 11.81 | 0.02 |
| Erythrocyte sedimentation rate (mm/hr) | 85.14± 1.64 | 84.98 ± 2.28 | 0.69 |
| C-reactive protein (mg/L) | 28.39 ± 1.54 | 50.91 ± 3.91 | <0.001 |
| 3rd Blood ‡ | |||
| White blood cells (/μL) | 8366.39 ± 192.19 | 8505.96 ± 242.11 | 0.21 |
| Neutrophils (/μL) | 2899.07 ± 149.63 | 3092.00 ± 165.54 | 0.56 |
| Lymphocytes (/μL) | 4481.88 ± 133.33 | 4475.18 ± 157.77 | 0.50 |
| Monocytes (/μL) | 532.71 ± 17.28 | 542.83 ± 22.67 | 0.77 |
| Eosinophils (/μL) | 343.63 ± 23.13 | 347.65 ± 30.08 | 0.14 |
| NLR | 0.74 ± 0.05 | 0.78 ± 0.06 | 0.88 |
| Platelet counts (K/μL) | 373.13 ± 10.92 | 389.99 ± 15.66 | 0.04 |
| Erythrocyte sedimentation rate (mm/hr) | 28.20 ± 2.61 | 29.84 ± 2.65 | 0.61 |
| C-reactive protein (mg/L) | 3.24 ± 0.92 | 2.06 ± 0.40 | 0.03 |
∗ Taken during the acute febrile phase before IVIG.
† Taken 2 days after IVIG regardless of defervescence.
Receiver-operating characteristic curve analysis was performed to determine the best NLR cut-off value for predicting IVIG resistance in patients with KD. During the acute febrile phase, the best NLR cut-off value was 5.49. The area under the curve (AUC) was 0.67 (95% confidence interval [CI] 0.62 to 0.71, p <0.001). This NLR cut-off value predicted IVIG resistance with sensitivity, specificity, positive predictive value, negative predictive value, and diagnostic accuracy of 39%, 86%, 63%, 70%, and 67%, respectively. Two days after IVIG, the best cut-off NLR value was 1.26. The AUC was 0.73 (95% CI 0.70 to 0.77, p <0.001). This NLR cut-off value predicted IVIG resistance with sensitivity, specificity, positive predictive value, negative predictive value, and diagnostic accuracy of 52%, 87%, 70%, 75%, and 73%, respectively.
In the analysis of NLR as a predictor of CAA development, 62 of 587 patients with KD were complicated with CAAs (11.8%). Of these, 47 had dilatation, and 15 had aneurysms. Comparison of the CAA-negative and CAA-positive groups in terms of demographic and clinical variables ( Table 2 ) revealed that the CAA-positive patients were more likely to be male, to present with fewer manifestations, and to have a longer febrile period before and after IVIG treatment. During the acute febrile phase, the CAA-negative and CAA-positive groups did not differ in terms of total and differential leukocyte counts or NLR. However, when only patients with aneurysms were examined, they were found to have significantly higher NLRs than the CAA-negative group during the acute febrile phase. Patients with dilatation did not differ from CAA-negative patients in terms of NLR. Two days after starting IVIG, the CAA-positive group had significantly higher NLRs than the CAA-negative group. Patients with aneurysm but not those with dilatation also had significantly higher NLRs than the CAA-negative group. The CAA-positive group was also more likely to exhibit IVIG resistance. This is similar to the observation that CAAs were more common in the IVIG-resistant group than in the IVIG-responsive group ( Table 1 ).
| Variable | CAA(-) ( n = 525) | CAA(+) | P | |||
|---|---|---|---|---|---|---|
| Dilatation ( n = 47) | Aneurysm ( n = 15) | Total ( n = 62) | CAA(-) vs. CAA(+) | CAA(-) vs. Aneurysm | ||
| Male | 289 (55.0%) | 38 (80.9%) | 13 (86.7%) | 51 (82.3%) | <0.001 | <0.001 |
| Age, months | 34.32 ± 0.99 | 19.77 ± 2.24 | 55.33 ± 8.94 | 27.73 ± 3.19 | 0.86 | 0.07 |
| Number of symptoms | 3.96 ± 0.03 | 3.64 ± 0.15 | 3.67 ± 0.23 | 3.65 ± 0.13 | <0.001 | 0.18 |
| Days of pre-IVIG fever | 4.64 ± 0.08 | 4.60 ± 0.33 | 5.73 ± 0.91 | 4.87 ± 0.34 | 0.02 | 0.03 |
| Days of post-IVIG fever | 2.39 ± 0.09 | 4.02 ± 0.47 | 4.13 ± 0.99 | 4.05 ± 0.43 | <0.001 | 0.003 |
| Days of total fever | 7.03 ± 0.10 | 8.62 ± 0.50 | 9.87 ± 1.20 | 8.92 ± 0.48 | <0.001 | <0.001 |
| 1st Blood ∗ | ||||||
| White blood cells (/μL) | 14154.03±235.61 | 14470.00±547.31 | 15770.00±1485.90 | 14784.52±546.73 | 0.09 | 0.24 |
| Neutrophils (/μL) | 9801.46±214.29 | 9259.45±544.73 | 11846.42±1256.37 | 9885.33±526.68 | 0.26 | 0.11 |
| Lymphocytes (/μL) | 3770.07±638.90 | 3764.07±329.27 | 2609.75±481.97 | 3438.80±280.86 | 0.83 | 0.75 |
| Monocytes (/μL) | 737.46±20.21 | 784.90±73.51 | 753.48±127.68 | 777.29±63.23 | 0.55 | 0.90 |
| Eosinophils (/μL) | 306.39±15.88 | 438.10±61.53 | 319.25±95.83 | 409.35±52.13 | 0.16 | 0.90 |
| NLR | 4.78±0.260 | 4.48±0.80 | 8.30±2.41 | 5.40±0.86 | 0.08 | 0.03 |
| Platelet counts (K/μL) | 352.71±4.50 | 382.38±15.06 | 382.00±45.42 | 382.29±15.62 | 0.11 | 0.29 |
| Erythrocyte sedimentation rate (mm/hr) | 77.65±1.33 | 80.60±4.79 | 78.53±8.26 | 80.10±4.12 | 0.45 | 0.91 |
| C-reactive protein (mg/L) | 97.91±3.90 | 98.27±10.45 | 109.35±23.74 | 100.99±9.72 | 0.57 | 0.62 |
| 2nd Blood † | ||||||
| White blood cells (/μL) | 8740.77±167.26 | 10968.51±695.35 | 13612.67±1395.96 | 11608.23±636.89 | 0.002 | <0.001 |
| Neutrophils (/μL) | 3621.77±132.21 | 5163.05±642.28 | 8632.41±1409.92 | 6016.17±620.14 | <0.001 | <0.001 |
| Lymphocytes (/μL) | 3849.91±73.41 | 4317.62±230.28 | 3502.04±503.22 | 4117.07±215.82 | 0.82 | 0.43 |
| Monocytes (/μL) | 674.22±17.30 | 850.50±59.48 | 796.78±115.96 | 837.29±52.74 | 0.34 | 0.24 |
| Eosinophils (/μL) | 444.01±14.75 | 543.75±64.55 | 519.48±127.47 | 537.78±57.36 | 0.001 | 0.41 |
| NLR | 1.20±0.07 | 1.39±0.22 | 4.72±1.75 | 2.21±0.49 | <0.001 | <0.001 |
| Platelet counts (K/μL) | 446.23±6.88 | 513.36±21.33 | 489.80±46.58 | 507.66±19.55 | 0.52 | 0.29 |
| Erythrocyte sedimentation rate (mm/hr) | 85.50±1.40 | 82.47±4.70 | 79.14±8.64 | 81.65±4.10 | 0.49 | 0.44 |
| C-reactive protein (mg/L) | 35.11±1.73 | 42.56±6.97 | 84.37±30.04 | 52.32±8.95 | <0.001 | <0.001 |
| 3rd Blood ‡ | ||||||
| White blood cells (/μL) | 8385.23±164.76 | 8981.25±337.63 | 8315.71±692.51 | 8778.70±313.27 | 0.05 | 0.94 |
| Neutrophils (/μL) | 2978.39±120.15 | 2960.22±346.51 | 3142.20±462.99 | 3015.60±273.97 | 0.57 | 0.79 |
| Lymphocytes (/μL) | 4467.17±109.08 | 4827.57±356.63 | 4003.04±349.83 | 4576.63±277.53 | 0.59 | 0.42 |
| Monocytes (/μL) | 537.55±14.69 | 576.16±55.60 | 435.71±42.02 | 533.42±42.46 | 0.54 | 0.19 |
| Eosinophils (/μL) | 325.02±17.42 | 484.23±98.16 | 583.52±182.19 | 514.45±86.14 | 0.002 | 0.01 |
| NLR | 0.76±0.04 | 0.82±0.21 | 0.82±0.14 | 0.82±0.15 | 0.18 | 0.77 |
| Platelet counts (K/μL) | 378.20±9.77 | 448.50±31.11 | 287.43±15.45 | 399.48±26.99 | 0.71 | 0.08 |
| Erythrocyte sedimentation rate (mm/hr) | 29.40±2.00 | 28.60±7.27 | 14.67±5.50 | 24.62±5.53 | 0.84 | 0.18 |
| C-reactive protein (mg/L) | 2.70±0.58 | 3.86±2.28 | 0.61±0.22 | 2.83±1.58 | 0.89 | 0.50 |
| IVIG resistance § | 186 (35.4%) | 27 (57.4%) | 9 (60%) | 36 (58.1%) | <0.001 | <0.001 |
Stay updated, free articles. Join our Telegram channel

Full access? Get Clinical Tree


