Myocardial damage in Duchenne muscular dystrophy (DMD) has lethal outcomes, making early detection of myocardial changes in patients with DMD vital, because early treatment can help prevent the development of myocardial fibrosis. The aim of the present study was, therefore, to test the hypothesis that transmural strain profile (TMSP) analysis can predict future left ventricular (LV) dysfunction in patients with DMD with preserved ejection fraction. We studied 82 consecutive patients with DMD without LV wall motion abnormality, with an ejection fraction of 60 ± 5% (all ≥55%) and age 11 ± 3 years. Echocardiography was performed at baseline and 1 year of follow-up. TMSP in the posterior wall was evaluated from the mid-LV short-axis view. A normal TMSP pattern (1 peak in the endocardium, group 1) was seen in 44 patients, and TMSP with a notch (2 peaks in the endocardium, group 2) in the remaining 38 (46%). Wall motion abnormality in the posterior wall was observed in 16 patients (42%) in group 2 at 1 year of follow-up but in none of the patients in group 1 (42% vs 0%; p <0.001). Importantly, multivariate analysis showed that only TMSP with a notch (odds ratios 1.524, p <0.001) was an independent determinant of the presence of LV posterior wall motion abnormality at 1 year of follow-up. In conclusion, subclinical LV dysfunction can be detected by evaluation of TMSP in patients with DMD who do not have wall motion abnormalities by conventional echocardiography. TMSP with a notch proved effective for evaluating subtle early changes in patients with DMD and might be useful for predicting LV dysfunction.
Previous investigators have reported that myocardial strain imaging is effective for the detection of left ventricular (LV) subclinical myocardial dysfunction in patients with Duchenne muscular dystrophy (DMD) with preserved LV ejection fraction (EF). Furthermore, the echocardiographic myocardial strain imaging system displays myocardial strain in each wall layer and its distribution in the form of a transmural myocardial strain profile, and this approach seems to be promising for the evaluation of myocardial function. Accordingly, the objectives of our study were to test the hypothesis that analysis using the transmural strain profile (TMSP) can predict future LV dysfunction in patients with DMD and preserved LVEF.
Methods
The study group consisted of 136 consecutive patients with DMD who were treated at the Division of Pediatrics of Kobe University Hospital from August 2007 to December 2011. For the baseline comparison, the control group consisted of 22 age- and LVEF-matched healthy volunteers (age 11.1 ± 2.6 years; LVEF 60.9 ± 4.8%). Patients with atrial fibrillation, left-sided heart failure, or more than mild aortic and/or mitral valvular heart disease were excluded from the study. The diagnosis of DMD was confirmed by genetic analysis. Mutation of the dystrophin gene, which forces the abnormal generation of dystrophin messenger RNA by the premature stop codon, was detected in all patients. The local ethics committee of our institution approved the present study, and all patients provided written informed consent.
The 12-lead electrocardiogram and serum examinations were performed on the same day as the echocardiographic examination. Deep Q wave >0.4 mV and low-voltage R in V 5 and S in V 1 detected by 12-lead electrocardiography have been recommended as markers of electrocardiographic abnormality in patients with DMD. The serum examination results, including those for brain natriuretic peptide, creatinine kinase, and aldolase, were obtained at baseline.
For the echocardiographic studies, a commercially available echocardiographic system (Aplio XG, Toshiba Medical Systems, Tochigi, Japan) was used. All patients were studied at baseline and 1 year of follow-up. Visual regional wall motion was interpreted according to the American Society of Echocardiography criteria with a 17-segment model by 2 experts’ consensus. Digital routine gray scale 2-dimensional cine loops from 3 consecutive beats were obtained from the parasternal long-axis, the mid-LV short-axis, and standard apical views. We used the parasternal long-axis view to obtain the LV end-diastolic and end-systolic dimension, fractional shortening (%FS), left atrial dimension, intraventricular septal thickness, LV posterior wall thickness, and aortic root dimension. The LVEF was assessed with the Teichholz rule. The pulsed-wave Doppler-derived transmitral velocity was obtained from the apical 4-chamber view for assessment of diastolic function. The early diastolic (E) and atrial (A) wave velocities, E/A ratio, and E-wave deceleration time were measured using pulsed-wave Doppler.
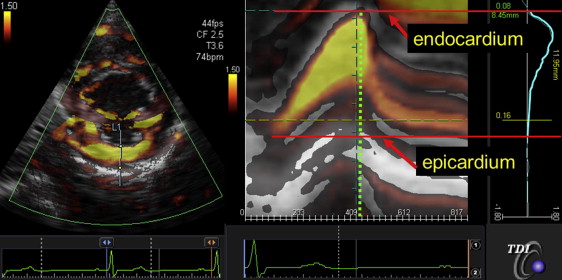
The tissue Doppler radial strain in the posterior wall was assessed from the mid-LV short-axis view to obtain the TMSP, as previously described in detail. The measurements were performed off-line using dedicated software (EchoEgent, Toshiba Medical Systems, Tochigi, Japan). In brief, Doppler angle correction was performed toward the contraction center to obtain radial strain distribution in the posterior wall. The radial strain distribution throughout the myocardium in the form of M-mode color-coded images and the profile of distribution (TMSP) at end systole were obtained ( Figure 1 ). We also identified the location of the peak strain, which was determined as the percentage of the distance between the endocardium and the epicardium accounted for by the wall thickness ( Figure 1 ).

All group data were compared using the 2-tailed Student t test for paired and unpaired data and are presented as the mean ± SD. The proportional differences were evaluated using either Fisher’s exact test or the chi-square test, as appropriate. Univariate logistic regression analysis was initially used to assess posterior wall motion abnormality at 1 year of follow-up. Multiple logistic regression analysis was then performed for an analysis of independent determinants of LV posterior wall motion abnormality at 1 year of follow-up. The intraclass correlation coefficient was used to determine the inter- and intraobserver reproducibility from 10 randomly selected subjects. For the assessment of intraobserver reproducibility, the measurements from these patients were analyzed using the same data set on 2 consecutive days, by an observer who was unaware of the results of the previous measurements. For the assessment of interobserver reproducibility, measurements for selected patients were analyzed by the second observer, using the same data set used for the analysis of intraobserver reproducibility, without knowledge of the values obtained by the first observer. A region of interest was not already defined on the same data set for reproducibility analysis. For all steps, p <0.05 was considered statistically significant. All the analyses were performed with commercially available software (MedCalc, version 10.4.0.0, MedCalc Software, Mariakerke, Belgium) and R, version 2.9.2 (R Foundation for Statistical Computing, Vienna, Austria).
Results
A total of 136 consecutive patients with DMD were enrolled in the present study. After the exclusion of 15 patients (11%) with suboptimal images from poor echocardiographic windows, 34 (25%) for the presence of LV regional wall motion abnormality, and 5 (4%) because of dilation of LV dimension, the 82 remaining patients with baseline and 1-year follow-up echocardiographic data formed the final study group. The mean age was 10.5 ± 3.2 years (range 4 to 23), and the mean LVEF was 60 ± 5% (all ≥55%; Table 1 ). The intraclass correlation coefficient for intraobserver reproducibility was 0.999 (95% confidence interval 0.998 to 0.999) for peak strain, and the corresponding interobserver reproducibility for this measurement was 0.994 (95% confidence interval 0.975 to 0.998). Moreover, the intra- and interobserver agreements for classifying patients into group 1 or 2 were excellent at 100% each.
| Variable | All Patients (n = 82) |
|---|---|
| Age (yrs) | 10.4 ± 3.2 |
| Systolic blood pressure (mm Hg) | 104.3 ± 11.4 |
| Diastolic blood pressure (mm Hg) | 62.6 ± 8.6 |
| Heart rate (beats/min) | 92.5 ± 12.0 |
| Creatine kinase (IU/L) | 7,149.0 ± 5,858.0 |
| Aldolase (IU/L) | 49.3 ± 40.1 |
| Brain natriuretic peptide (pg/ml) | 9.10 ± 6.04 |
| Electrocardiographic parameter | |
| Presence of deep Q wave (n) | 35 (43) |
| Low-voltage R in V 5 and S in V 1 (n) | 5 (6) |
| Echocardiographic parameters | |
| Left ventricular end-diastolic dimension (mm) | 38.8 ± 3.7 |
| Left ventricular end-systolic dimension (mm) | 25.0 ± 3.2 |
| % Fractional shortening (%) | 35.8 ± 4.6 |
| Left atrial dimension (mm) | 24.7 ± 4.4 |
| Intraventricular septal thickness (mm) | 6.7 ± 1.4 |
| Left ventricular posterior wall thickness (mm) | 7.0 ± 1.5 |
| Aortic root dimension (mm) | 22.5 ± 2.9 |
| Early diastolic wave velocity (cm/s) | 100.4 ± 16.5 |
| Atrial wave velocity (cm/s) | 50.4 ± 10.7 |
| Early diastolic and atrial wave velocities ratio | 2.07 ± 0.48 |
| Early diastolic-wave deceleration time (ms) | 163.8 ± 27.9 |
| Peak strain value (%) | 114 ± 58 |
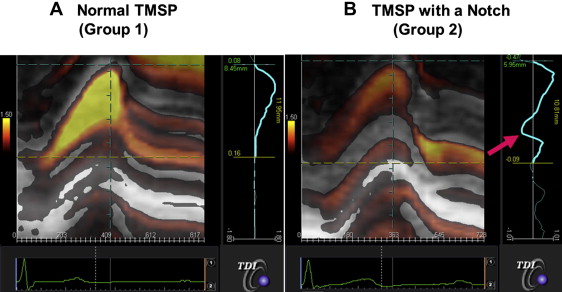
Two TMSP patterns were observed at baseline. One featured a 1-peak strain and was located in the endocardium (group 1, normal TMSP), and the other featured a 2-peak strain with a notch and was located in the endocardium (group 2, TMSP with a notch). In contrast, all subjects in the control group had a normal TMSP pattern. Group 1 included 44 patients (54%), and group 2 included 38 patients (46%). Figure 2 shows representative cases from groups 1 and 2. The baseline clinical and echocardiographic characteristics of the 2 groups are listed in Table 2 . The creatinine kinase and aldolase levels in group 1 were greater than those in group 2; however, the brain natriuretic peptide levels in the 2 groups were similar. The 2 groups showed a similar prevalence of the deep Q wave (43% vs 46%), but group 1 was more likely to have a smaller LV end-diastolic dimension (38 ± 3 vs 40 ± 4 mm, p <0.01), LV end-systolic dimension (24 ± 3 vs 26 ± 3 mm, p = 0.02), intraventricular septal thickness (6.4 ± 1.4 vs 7.1 ± 1.4 mm, p <0.05), and LV posterior wall thickness (6.5 ± 1.3 vs 7.5 ± 1.5 mm, p <0.01). Other conventional echocardiographic parameters, including LVEF and diastolic function, were similar for the 2 groups. Finally, the peak strain value was significantly greater for group 1 than for group 2 (134 ± 64% vs 91 ± 40%, p <0.01).

| Variable | Group 1 (n = 44) | Group 2 (n = 38) | p Value |
|---|---|---|---|
| Age (yrs) | 10.0 ± 3.7 | 10.9 ± 2.4 | NS |
| Systolic blood pressure (mm Hg) | 106.4 ± 12.5 | 102.5 ± 10.1 | NS |
| Diastolic blood pressure (mm Hg) | 63.2 ± 9.8 | 62.1 ± 7.5 | NS |
| Heart rate (beats/min) | 93.3 ± 11.2 | 91.8 ± 12.7 | NS |
| Creatine kinase (IU/L) | 8,807.5 ± 6,155.7 | 5,306.3 ± 4,967.4 | <0.01 |
| Aldolase (IU/L) | 59.6 ± 43.4 | 37.8 ± 33.2 | 0.02 |
| Brain natriuretic peptide (pg/ml) | 9.57 ± 6.93 | 8.57 ± 4.92 | NS |
| Electrocardiographic parameter | |||
| Presence of deep Q wave (n) | 18 (41) | 17 (45) | NS |
| Low-voltage R in V 5 and S in V 1 (n) | 1 (2) | 4 (11) | NS |
| Echocardiographic parameters | |||
| Left ventricular end-diastolic dimension (mm) | 37.7 ± 3.4 | 40.2 ± 3.5 | <0.01 |
| Left ventricular end-systolic dimension (mm) | 24.2 ± 2.9 | 25.9 ± 3.4 | 0.02 |
| % Fractional shortening (%) | 35.9 ± 4.1 | 35.7 ± 5.1 | NS |
| Left atrial dimension (mm) | 24.2 ± 4.1 | 25.2 ± 4.8 | NS |
| Intraventricular septal thickness (mm) | 6.4 ± 1.4 | 7.1 ± 1.4 | 0.05 |
| Left ventricular posterior wall thickness (mm) | 6.5 ± 1.3 | 7.5 ± 1.5 | <0.01 |
| Aortic root dimension (mm) | 22.0 ± 2.7 | 23.0 ± 3.1 | NS |
| Early diastolic wave velocity (cm/s) | 101.9 ± 17.4 | 98.6 ± 15.4 | NS |
| Atrial wave velocity (cm/s) | 50.0 ± 11.4 | 50.8 ± 10.1 | NS |
| Early diastolic and atrial wave velocities ratio | 2.12 ± 0.50 | 2.01 ± 0.45 | NS |
| Early diastolic-wave deceleration time (ms) | 161.2 ± 25.2 | 166.7 ± 30.7 | NS |
| Peak strain value (%) | 1.34 ± 0.64 | 0.91 ± 0.4 | <0.01 |
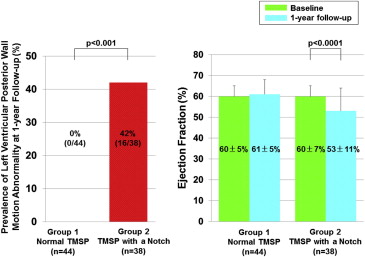
In group 2, 16 patients (42%) showed wall motion abnormality in the posterior wall at 1 year of follow-up, but none of the patients in group 1 did so (42% vs 0%; p <0.001; Figure 3 ). LVEF was significantly reduced in group 2 from 60 ± 7% to 53 ± 11% (p <0.0001) at 1 year of follow-up but remained almost the same in group 1 (60 ± 5% vs 61 ± 5%; Figure 3 ).

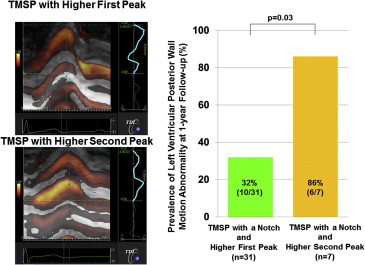
The 38 patients with TMSP with a notch were then subdivided into 2 groups according to the TMSP pattern ( Figure 4 ). Of these patients, 7 (18%) showed a higher second peak and a pattern associated with a greater prevalence of wall motion abnormality in the posterior wall at 1 year of follow-up. The remaining 31 patients (82%) had a higher first peak (86% vs 32%, respectively, p = 0.03; Figure 4 ) and a lower incidence of wall motion abnormality.


