The strain delay index is reportedly a marker of dyssynchrony and residual myocardial contractility. The aim of this study was to test the hypothesis that a relatively simple version of the strain dyssynchrony index (SDI) can predict response to cardiac resynchronization therapy (CRT) and that combining assessment of radial, circumferential, and longitudinal SDI can further improve the prediction of responders. A total of 52 patients who underwent CRT were studied. The SDI was calculated as the average difference between peak and end-systolic strain from 6 segments for radial and circumferential SDI and 18 segments for longitudinal SDI. Conventional dyssynchrony measures were assessed by interventricular mechanical delay, the Yu index, and radial dyssynchrony by speckle tracking strain. Response was defined as a ≥15% decrease in end-systolic volume after 3 months. Of the individual parameters, radial SDI ≥6.5% was the best predictor of response to CRT, with sensitivity of 81%, specificity of 81%, and an area under the curve of 0.87 (p <0.001). Circumferential SDI ≥3.2% and longitudinal SDI ≥3.6% were also found to be predictive of response to CRT, with areas under the curve of 0.81 and 0.80, respectively (p <0.001). Moreover, radial, circumferential, and longitudinal SDI at baseline were correlated with reduction of end-systolic volume with CRT. In addition, the response rate in patients with 3 positive SDIs was 100%. In contrast, rates in patients with either 1 or no positive SDIs were 42% and 22%, respectively (p <0.005 and p <0.001 vs 3 positive SDIs). In conclusion, the SDI can successfully predict response to CRT, and the combined approach leads to more accurate prediction than using individual parameters.
Because roughly 1/3 of patients do not respond to cardiac resynchronization therapy (CRT) when they are selected with standard clinical methods, including those based on QRS duration, several echocardiographic approaches to the quantification of mechanical dyssynchrony have been tested in an attempt to improve patient selection on the basis of electrocardiographic QRS duration. Speckle-tracking echocardiography strain has the advantage of differentiating active contraction from passive motion and is not affected by the Doppler angle of incidence, as in tissue Doppler imaging. Because this technique uses routine grayscale images, it allows the assessment of the 3 different types of speckle-tracking stain (radial, circumferential, and longitudinal). Lim et al recently reported the strain delay index determined by longitudinal speckle-tracking strain from standard apical views coupled with the factors of both left ventricular (LV) dyssynchrony and residual myocardial contractility. Although this new index was highly predictive of response to CRT, it was calculated from longitudinal strain only and required specific software for analysis. Accordingly, our objective was to test the hypothesis that our relatively simple version of the strain dyssynchrony index (SDI) can predict response to CRT and that a combined assessment of radial, circumferential, and longitudinal SDIs can further enhance the ability of the method to predict response to CRT. Furthermore, we evaluated conventional dyssynchrony measures for a comparison with the ability of the SDI to predict response to CRT.
Methods
The study included 56 consecutive patients with heart failure in New York Heart Association functional class III or IV with ejection fractions ≤35% and QRS durations ≥120 ms, who all underwent CRT. Four of these patients were excluded from all subsequent analyses because of inadequate echocardiographic image quality, so that 52 patients were enrolled in this study ( Table 1 ). The mean age was 67 ± 12 years, the mean ejection fraction was 25 ± 7%, and the mean QRS duration was 166 ± 26 ms. Thirteen patients (25%) had ischemic cardiomyopathy, defined as the presence of ≥75% stenosis of ≥1 major epicardial coronary artery and/or previous coronary revascularization. Thirty-three patients (64%) were diagnosed with sinus rhythm and 5 (10%) with atrial fibrillation. In addition, 14 (24%) had previously undergone the implantation of permanent right ventricular pacing ≥1 year before enrollment and features predominantly right ventricular pacing, which was defined as ≥90% paced when the device was interrogated at the time of enrollment. All patients were receiving optimal pharmacologic therapy, if tolerated. Written informed consent was obtained from all patients.
| Variable | All Patients | Responders | Nonresponders | p Value |
|---|---|---|---|---|
| (n = 52) | (n = 36) | (n = 16) | ||
| Age (years) | 67 ± 12 | 67 ± 12 | 65 ± 13 | NS |
| Men/women | 35/17 | 25/12 | 10/6 | NS |
| NYHA functional class III/IV | 44/8 | 31/5 | 13/3 | NS |
| QRS duration (ms) | 166 ± 26 | 165 ± 25 | 168 ± 27 | NS |
| SR/AF/paced | 33/7/12 | 22/4/10 | 11/3/2 | NS |
| EDV (ml) | 167 ± 71 | 164 ± 67 | 172 ± 82 | NS |
| ESV (ml) | 128 ± 63 | 127 ± 62 | 129 ± 68 | NS |
| Ejection fraction (%) | 25 ± 7 | 24 ± 7 | 27 ± 6 | NS |
| Heart failure cause | ||||
| Ischemic | 13 (25%) | 10 (28%) | 3 (19%) | NS |
| Nonischemic | 39 (75%) | 26 (72%) | 13 (81%) | NS |
| Medications | ||||
| ACE inhibitors/ARBs | 48 (92%) | 34 (94%) | 14 (88%) | NS |
| β blockers | 44 (85%) | 30 (88%) | 14 (88%) | NS |
| Diuretics | 45 (85%) | 31 (86%) | 14 (88%) | NS |
| Dyssynchrony measurements (ms) | ||||
| Yu index | 47 ± 17 | 48 ± 15 | 45 ± 20 | NS |
| IVMD | 45 ± 25 | 49 ± 25 | 34 ± 21 | <0.05 |
| Radial dyssynchrony by speckle-tracking strain | 248 ± 168 | 293 ± 171 | 146 ± 110 | <0.005 |
| SDI (%) | ||||
| Radial | 8.3 ± 4.6 | 10.1 ± 4.4 | 4.4 ± 2.3 | <0.001 |
| Circumferential | 3.7 ± 1.8 | 4.3 ± 1.8 | 2.5 ± 1.2 | <0.001 |
| Longitudinal | 4.0 ± 1.4 | 4.4 ± 1.2 | 3.0 ± 1.2 | <0.001 |
All echocardiographic studies were performed with a 3.5-MHz transducer using a commercially available echocardiography system (Vivid 7; GE Vingmed Ultrasound AS, Horten, Norway). Patients were studied before and 3 ± 1 months after CRT. Digital routine grayscale 2-dimensional cine loops were obtained, including mid-LV short-axis views at the level of the papillary muscle, standard apical views (4 chamber, 2 chamber, and long axis), and pulsed Doppler interrogation of the LV outflow tract. Sector width was optimized to allow complete myocardial visualization while maximizing the frame rate. Mean frame rates were 62 ± 7 frames/s in the standard apical view and 65 ± 4 frames/s in the short-axis view for grayscale imaging used for speckle-tracking analysis. For patients with atrial fibrillation, measurements of standard echocardiographic and speckle-tracking parameters were obtained as the averages of ≥4 cardiac cycles. Digital data were transferred to dedicated software (EchoPAC version 8.0.0; GE Vingmed Ultrasound AS) for subsequent off-line analysis. LV end-diastolic volume, end-systolic volume (ESV), and ejection fraction were obtained with the modified biplane Simpson’s method. A response to CRT was defined as reverse remodeling detected by a relative decrease of ≥15% in ESV at 3-month follow-up. In addition, clinical response was defined as an improvement of ≥1 grade in New York Heart Association functional class at 3-month follow-up.
Routine pulsed Doppler was used to determine interventricular dyssynchrony, as previously described. Interventricular mechanical delay was determined as the time difference in the onset of right ventricular ejection velocity to that of LV ejection velocity. An interventricular mechanical delay ≥40 ms was considered to constitute significant dyssynchrony.
Longitudinal dyssynchrony was determined using tissue Doppler cine loops from 3 consecutive beats, which were obtained in 3 standard apical views, as previously described in detail. Regions of interest (6 × 8 mm) were placed on the basal and mid-LV segments for each of the 3 standard views for a 12-site time to peak velocity analysis. Longitudinal tissue Doppler dyssynchrony was determined as the standard deviation of time to peak systolic velocities from the onset of the QRS complex of the 12 sites (Yu index). Longitudinal tissue Doppler dyssynchrony ≥32 ms was considered to constitute significant dyssynchrony.
For radial dyssynchrony analysis by speckle-tracking strain, routine grayscale mid-LV short-axis images were used, as previously described in detail. Briefly, an end-diastolic circular region of interest was traced on the endocardial cavity with a point-and-click approach. A second larger concentric circle was then automatically generated and manually adjusted near the epicardium. The software automatically divided the mid-LV short-axis and apical images into 6 standard segments and provided the radial, circumferential, and longitudinal speckle-tracking strain curves throughout the cardiac cycle. Radial dyssynchrony by speckle-tracking strain was defined as the time difference between the anteroseptal and posterior wall segmental peak strains. Radial dyssynchrony ≥130 ms was considered to constitute significant dyssynchrony.
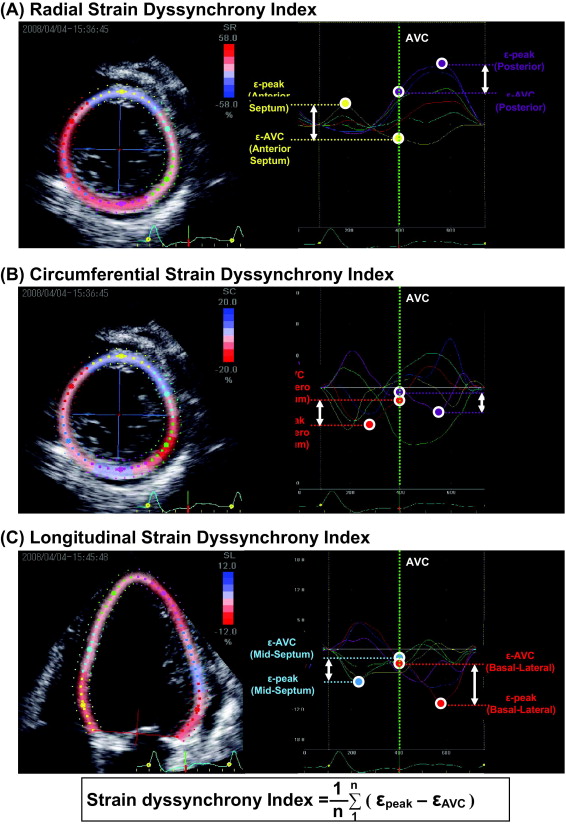
The SDI represents the average of the wasted energy due to LV dyssynchrony. The concept of our SDI was based on that of the strain delay index as demonstrated by Lim et al. Briefly, SDI analysis was performed by speckle-tracking strain using routine grayscale images. Radial and circumferential SDIs were evaluated from 6 standard segments using mid-LV short-axis views. Longitudinal SDI was assessed at basal, mid, and apical levels in the apical 4-chamber, 2-chamber, and long-axis views for a total of 18 sites ( Figure 1 ). The peak of the Q wave on the electrocardiogram was used as the reference time point for end-diastole. The timing of the aortic valve closure (AVC), defined as the end of LV outflow tract detected by pulsed Doppler, was used as the reference time point for end-systole. The wasted energy per segment because of dyssynchrony was expressed as the difference between peak strain (ε-peak) and AVC strain (ε-AVC) ( Figure 1 ). This difference increases with greater degrees of dyssynchrony, because the increase of dyssynchrony leads to the decrease in ε-AVC. The SDI was then calculated as the average of the absolute difference between ε-peak and ε-AVC from 6 segments for radial and circumferential SDI and 18 segments for longitudinal SDI. Three consecutive cardiac cycles were recorded and averaged for each measurement. If a segment showed negative radial strain or positive circumferential and longitudinal strain during the entire cardiac cycle, the difference between ε-peak and ε-AVC was assumed to be 0.
Biventricular pacing systems were implanted with right ventricular apical leads and LV leads through the coronary sinus in 50 of the patients. The LV leads were placed in the lateral veins of 23 patients, the posterolateral veins of 21 patients, the anterolateral veins of 4 patients, and the middle veins of 2 patients. The epicardial surgical approach was required for the remaining 2 patients. Of the 7 patients with atrial fibrillation, 3 underwent atrioventricular junction ablation at the same time as CRT, and 2 underwent defibrillation first and their atrial fibrillation disappeared after CRT. Device implantation was successful for all patients without any major complications. The atrioventricular interval was adjusted for optimal diastolic filling by Doppler echocardiographic assessment of mitral inflow, and the interventricular interval was adjusted by Doppler echocardiographic assessment of LV outflow 8 ± 2 days after implantation.
The reproducibility of the SDI was tested in 10 randomly selected patients by 2 independent observers for inter- and intraobserver variability. Interobserver variability was assessed by a second observer blinded to the values obtained by the first observer, and intraobserver variability at a different time by an observer blinded to the results of the previous measurements. Inter- and intraobserver variability was expressed as the absolute difference between the measurements divided by their mean value.
Continuous variables are expressed as mean ± SD. Group comparisons between before and 3 months after CRT were performed with paired t tests and group comparisons between responders and nonresponders with unpaired Student’s t tests. The diagnostic performance of LV dyssynchrony indexes for predicting response to CRT was evaluated by means of receiver-operating characteristic curve analysis. Univariate linear correlation analysis was used for a comparison of ESV reduction and SDIs. For all tests, p <0.05 was considered statistically significant. All the analyses were performed with commercially available software (SPSS version 15.0; SPSS, Inc., Chicago, Illinois).
Results
The baseline clinical and echocardiographic characteristics of the 52 patients are listed in Table 1 . Response to CRT, defined as a relative decrease in ESV of ≥15%, was observed in 36 patients (69%), and the remaining 16 patients (31%) were classified as nonresponders. Compared to nonresponders, responders were more likely to have greater interventricular mechanical delay (49 ± 25 vs 34 ± 21 ms, p <0.05), radial dyssynchrony assessed by speckle-tracking strain (293 ± 171 vs 146 ± 110 ms, p <0.005), and SDI (radial 10.1 ± 4.4% vs 4.4 ± 2.3%, circumferential 4.3 ± 1.8% vs 2.5 ± 1.2%, and longitudinal 4.4 ± 1.2% vs 3.0 ± 1.2%, all p values <0.001; Table 1 ). In contrast, there was no significant difference in the Yu index between responders and nonresponders ( Table 1 ).
Of the individual parameters, including SDI and conventional dyssynchrony measures, radial SDI ≥6.5% proved to be the best predictor of response to CRT, with sensitivity of 81%, specificity of 81%, and area under the curve of 0.88 (p <0.001; Figure 2 , Table 2 ). Circumferential SDI ≥3.2% and longitudinal SDI ≥3.6% were also found to be successful predictors for response to CRT, with sensitivity and specificity of 75% and 75%, for both parameters and areas under the curve of 0.81 and 0.80, respectively (all p values <0.001; Figure 2 , Table 2 ). Although a large scattering of data, particularly for circumferential and longitudinal SDIs, were observed, each SDI correlated significantly with percentage reduction in ESV after CRT (radial r = 0.64, p <0.001; circumferential r = 0.40, p <0.005; longitudinal r = 0.43, p <0.005; Figure 3 ). In contrast, only the Yu index was not predictive of response to CRT. Using predefined cut-off values of the conventional dyssynchrony parameters (40 ms for interventricular mechanical delay, 32 ms for Yu index, and 130 ms for radial dyssynchrony of speckle-tracking strain), sensitivity for these parameters was 67%, 89%, and 75%, and specificity was 56%, 31%, and 56%, respectively ( Table 2 ).
| Variable | AUC (95% CI) | Cutoff | Sensitivity (95% CI) | Specificity (95% CI) |
|---|---|---|---|---|
| Dyssynchrony measurements | ||||
| IVMD | 0.69 (0.55–0.81) | 40 ms | 67% (49%–81%) | 56% (30%–80%) |
| Yu Index | 0.54 (0.40–0.68) | 32 ms | 89% (74%–97%) | 31% (11%–59%) |
| Radial dyssynchrony by speckle-tracking strain | 0.74 (0.55–0.85) | 130 ms | 75% (60%–88%) | 56% (38%–69%) |
| SDI | ||||
| Radial | 0.87 (0.78–0.97) | 6.5% | 81% (74%–100%) | 81% (70%–97%) |
| Circumferential | 0.81 (0.68–0.92) | 3.2% | 75% (74%–98%) | 75% (60%–87%) |
| Longitudinal | 0.80 (0.65–0.88) | 3.6% | 75% (59%–100%) | 75% (57%–85%) |
Stay updated, free articles. Join our Telegram channel

Full access? Get Clinical Tree


