We evaluated the clinical utility of cardiac magnetic resonance imaging (CMR) combined with a novel high-sensitivity troponin T assay (hs-cTnT) in the diagnosis of inflammatory cardiomyopathy. CMR, measurement of hs-cTnT, and endomyocardial biopsy were performed in 42 patients with dilated cardiomyopathy and a short-term history of heart failure (median 2 months, interquartile range 1 to 3.5). The patients were followed up for 25 ± 9 months for events. Endomyocardial biopsy revealed myocarditis in 15 subjects (36%). The sensitivity, specificity, and diagnostic accuracy of the individual CMR tissue parameters for myocardial inflammation was 40%, 96%, and 76% for early gadolinium enhancement, 87%, 44%, and 60% for late gadolinium enhancement, 47%, 89%, and 74% for pericardial effusion, and 67%, 85%, and 79% for any 2 of the criteria simultaneously, respectively. An assessment of myocardial edema on T 2 -weighted imaging and/or hs-cTnT assay were inadequate for the diagnosis. The extent of late gadolinium enhancement and increased hs-cTnT concentration were significant predictors of a composite end point of cardiac death, urgent heart transplantation, and hospitalization for worsening heart failure (hazard ratio 1.1, 95% confidence interval 1.0 to 1.2, per percentage of left ventricular mass; and hazard ratio 2.2, 95% confidence interval 1.4 to 3.5, per ln ng/L; p = 0.008 and p = 0.001, respectively). In conclusion, the results of the present study have demonstrated a modest performance for CMR and a limited use of the hs-cTnT assay in the diagnosis of inflammatory cardiomyopathy. Nonetheless, in these patients, CMR and/or hs-cTnT assessment seems to be useful for the prediction of the clinical outcome.
Clinical experience with the use of cardiac magnetic resonance imaging (CMR) for noninvasive detection of myocardial inflammation in those presenting with unexplained recent-onset dilated cardiomyopathy (DC) is currently lacking. Some of the CMR features typically found in acute myocarditis are less likely to be expected at a later stage of myocardial inflammation, such as in the case of inflammatory DC. Moreover, some CMR findings in inflammatory DC might be attributable, not only to myocardial inflammation, but also to pathologic processes related to the heart failure itself. The high-sensitivity cardiac troponin T (hs-cTnT) assay permits detection of ongoing myocyte necrosis in quantities much lower than the resolution capability of CMR for myocardial damage. We hypothesized that the combined strategy of CMR and hs-cTnT assessment could provide a sensitive and clinically applicable noninvasive diagnosis of inflammatory DC. In addition, we sought to investigate whether the hs-cTnT and CMR findings could be useful in the estimation of prognosis in patients with recent-onset DC.
Methods
From November 2008 to September 2010, 42 consecutive patients with DC and a history of heart failure symptoms for <6 months were enrolled in the present study. DC was defined by the presence of left ventricular dilation (left ventricular end-diastolic diameter >33 mm/m in men and >32 mm/m in women) and left ventricular systolic dysfunction (left ventricular ejection fraction <45%) in the absence of coronary artery disease (ruled out by cardiac catheterization), severe systemic arterial hypertension, and primary valve disease. Subjects with a history of drug abuse or excessive alcohol consumption and/or presenting with sustained supraventricular tachyarrhythmias were excluded. At baseline, all patients underwent a thorough cardiologic examination, assessment of hs-cTnT and B-type natriuretic peptide, CMR, and endomyocardial biopsy (EMB). The institutional review board approved the present study, and all patients provided written informed consent. All patients were treated according to the current guidelines for the management of heart failure, and they were followed up in a dedicated heart failure clinic. The heart failure medication was usually initiated at a referring community hospital before recruitment to the study.
All biopsies were performed within 2 days after the CMR examination. The procedure and analyses of the EMB specimens were performed using methods previously described in detail. In brief, EMB was performed by way of the internal jugular vein using a flexible bioptome (7F diameter, Cordis Europe, Waterloo, Belgium) under fluoroscopic guidance. Eight to ten samples were obtained from the right ventricular side of the interventricular septum. Histopathologic analysis was based on the Dallas criteria. Immunohistochemistry for the characterization of inflammatory cell infiltrates was performed on paraffin sections treated with monoclonal antibodies (anti-CD3 and anti-CD68, Dako, Glostrup, Denmark). The immunohistochemical criteria for myocardial inflammation were determined by the detection of ≥14 infiltrative leukocytes/mm 2 (CD3+ T lymphocytes and CD68+ macrophages) and/or ≥7 CD3+ T lymphocytes/mm 2 . Quantitative polymerase chain reaction was performed for the detection of common cardiotropic viruses in the EMB specimens, as previously described. The extent of interstitial and replacement fibrosis was assessed visually by morphometric study according to Loud and Anversa.
Peripheral venous blood samples were drawn in the morning before EMB. Detection of hs-cTnT was performed using an electrochemiluminescent immunoassay (T hs STAT, Cobas e411, Roche Diagnostics GmbH, Mannheim, Germany) according to the manufacturer’s recommendations. The parameters of the assay were as follows: the lower limit of detection at 5 ng/L, measuring range 3 to 10,000 ng/L, 10% intra-assay coefficient of variation at 13 ng/L, intra-assay coefficient of variation <3.2% and interassay coefficient of variation <6.2% at a concentration of 12.6 ng/L. The upper reference limit was set at 13.5 ng/L. The B-type natriuretic peptide plasma levels were measured using chemiluminescent immunoanalysis (Architect B-type natriuretic peptide, Abbott Diagnostics, Abbott Park, Illinois). The parameters of the assay were as follows: lower limit of detection 10 ng/L, intra-assay coefficient of variation <3.8%, and interassay coefficient of variation <5.3%.
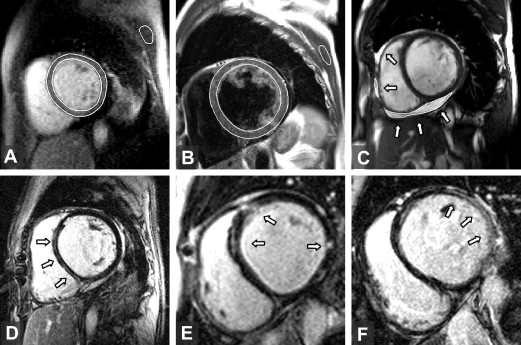
The CMR studies were performed using a clinical 1.5 Tesla MR scanner (Avanto, Siemens Medical Solutions, Erlangen, Germany). Cine images were obtained by a TrueFISP sequence (repetition time/echo time 65/1.2 ms, flip angle 70°, slice thickness 8 mm, without gaps) in short-axis and orthogonal long-axis planes. A breath-hold T 2 -weighted dark blood sequence (repetition time/echo time 2 RR/58 ms, inversion time 140 ms, slice thickness 8 mm, gap 2 mm) was acquired in short-axis slices. Images for assessment of early enhancement were acquired in basal, mid-papillary, and apical short-axis slices using a T 1 -weighted turboFLASH sequence (repetition time/echo time 170/1.05 ms, flip angle 12°, inversion time 100 ms, slice thickness 10 mm) before and at 40 to 70 seconds after intravenous bolus injection of 0.2 mmol/kg of gadobutrol (Gadovist, Bayer Schering, Berlin, Germany). Images for late gadolinium enhancement (LGE) were acquired 10 to 15 minutes after the administration of contrast in the short-axis and orthogonal long-axis planes using phase-sensitive inversion-recovery sequences (repetition time/echo time 690 to 850/3.2 ms, inversion time adjusted to null normal myocardium, slice thickness 8 mm, gap 0.8 mm, in-plane resolution 1.7 × 1.7 mm).
The quality of the CMR images was good to acceptable in all patients. No sequence was excluded from the present analysis. Ventricular volumes, mass, and ejection fractions were determined from cine images using Segment, version 1.8 (available at: http://segment.heiberg.se ). The presence and distribution of LGE was independently determined by 2 expert radiologists (D.K. and J.W.) in a blinded fashion. The agreement between the 2 radiologists was a kappa of 0.75 (95% confidence interval 0.53 to 0.97, p = 0.001). To quantify the extent of LGE on the short-axis stacks, a semiautomated thresholding technique implemented in Matlab (Mathworks, Natick, Massachusetts) was performed by applying 2 SD above the mean signal intensity of a selected region in the normal myocardium. A quantitative assessment of myocardial edema and early enhancement followed previously described methods. An edema ratio of ≥1.9 and early enhancement of ≥45% were regarded as abnormal findings. The myocardial edema ratio, early enhancement, and quantity of LGE were analyzed by a single observer (M.S.), who was unaware of the results of EMB. The corresponding intraobserver relative variability was 7 ± 7%, 10 ± 7%, and 5 ± 3%, respectively. The amount of pericardial effusion was quantified by summation of the disks on the short-axis cine images. A total effusion volume of >50 ml was regarded as a pathologic finding. Representative images of the CMR techniques used are displayed in Figure 1 .
Continuous variables were compared using the t tests and are expressed as the mean ± SD or median and interquartile range. Owing to the right-skewed distribution, the biomarker concentrations were transformed to natural logarithm before analysis. Categorical variables are expressed as frequencies and were compared using the chi-square or Fisher’s exact test. The EMB results were used as a reference standard to calculate the sensitivity and specificity of CMR and hs-cTnT for detection of myocardial inflammation. A stepwise logistic regression analysis was performed to identify the variables predictive of inflammatory DC and the variables associated with LGE. The log-rank test and Cox’s proportional hazard models were performed to analyze the associations with the composite end point, using the time to the first event. All statistical analyses were conducted with SPSS, version 16.0 (SPSS, Chicago, Illinois). p Values <0.05 were considered statistically significant.
Results
The baseline clinical, biochemical, and EMB findings are summarized in Table 1 . All 42 patients presented with recent-onset congestive heart failure. At recruitment, none of the patients showed a clinical picture suggestive of acute myocarditis. Inflammatory DC was found by immuhistochemical analysis of the EMB specimens in 15 patients (36%). In these patients, the mean count of CD3+ T lymphocytes was 12 ± 5/mm 2 . The classic Dallas (histologic) criteria were met in only 3 patients presenting with borderline myocarditis. The remaining 27 patients (64%) were diagnosed with idiopathic DC. The most common genome found in the EMB specimens was parvovirus B19 (n = 25), followed by human cytomegalovirus (n = 4) and enterovirus (n = 1).
| Variable | Idiopathic DC (n = 27) | Inflammatory DC (n = 15) | p Value |
|---|---|---|---|
| Age (yrs) | 45 ± 12 | 42 ± 8 | 0.29 |
| Men | 19 (70%) | 11 (73%) | 0.81 |
| Duration of heart failure (mo) | 2 (1–3) | 2 (1–3) | 0.58 |
| Prodromes of viral disease | 5 (19%) | 6 (40%) | 0.13 |
| New York Heart Association class | 2.4 ± 0.7 | 2.8 ± 0.9 | 0.23 |
| Diabetes mellitus | 1 (4%) | 1 (7%) | 0.66 |
| Systemic hypertension | 2 (7%) | 1 (7%) | 0.93 |
| Glomerular filtration rate (ml/min/1.73 m 2 ) | 81 ± 23 | 79 ± 15 | 0.69 |
| Angiotensin-converting enzyme inhibitors | 24 (89%) | 14 (93%) | 0.64 |
| Angiotensin receptor blockers | 4 (15%) | 1 (7%) | 0.63 |
| β Blockers | 5 (19%) | 4 (27%) | 0.54 |
| Loop diuretics | 24 (89%) | 14 (93%) | 0.66 |
| Spironolactone | 20 (74%) | 13 (87%) | 0.34 |
| Normal sinus rhythm | 26 (96%) | 15 (100%) | 0.45 |
| Left bundle branch block | 3 (11%) | 2 (13%) | 0.83 |
| High-sensitivity troponin T level (ng/L) | 11 (5–32) | 17 (5–30) | 0.55 |
| High-sensitivity troponin T >13.5 ng/L | 12 (44%) | 10 (67%) | 0.20 |
| Conventional troponin I >0.03 μg/L | 7 (26%) | 6 (40%) | 0.34 |
| Maximum conventional troponin I (μg/L) | 1.27 | 3.61 | — |
| C-reactive protein (mg/L) | 2 (1–7) | 3 (2–9) | 0.36 |
| B-type natriuretic peptide (ng/L) | 963 (240–1,508) | 647 (279–1,180) | 0.27 |
| Viral genome in biopsy specimen | 16 (59%) | 11 (73%) | 0.36 |
| Extent of fibrosis in biopsy specimen (%) | 14 ± 7 | 15 ± 9 | 0.61 |
The comparison of CMR findings in inflammatory and idiopathic DC are summarized in Table 2 . LGE was present in 67% of the study group and was significantly more common in inflammatory than in idiopathic DC. LGE had a pattern of a single, thin, mid-wall stripe located in the interventricular septum (n = 12) or within the inferolateral or lateral wall (n = 4), multiple mid-wall stripes located in different areas (n = 7), or a patchy transmural lesion found predominantly in the lateral wall (n = 5; Figure 1 ). The prevalence of myocardial inflammation found by right ventricular EMB did not differ significantly with respect to localization of LGE in the left ventricular (interventricular septum vs nonseptal regions 16 of 28 [50%] vs 12 of 28 [42%], p = 0.66). No characteristic localizations or patterns of LGE were observed with regard to a particular viral genome found in the EMB specimen. A positive correlation was found between the extent of LGE in the left ventricle and the hs-cTnT and B-type natriuretic peptide levels (r = 0.68 and r = 0.53, respectively; p <0.001). The variables associated with the occurrence of LGE are listed in Table 3 . On multivariate logistic analysis, the finding of myocardial inflammation in the EMB specimens and increased B-type natriuretic peptide plasma levels (per ln ng/L) were independently associated with LGE (odds ratio 11.0, 95% confidence interval 1.3 to 96 and odds ratio 3.5, 95% confidence interval 1.3 to 9.8; p = 0.03 and p = 0.017, respectively). Myocardial early enhancement proved to have moderate reliability for the detection of inflammation (area under receiver operating characteristic curve 0.68, 95% confidence interval 0.5 to 0.89, p = 0.049). The assessment of the myocardial edema ratio was not useful for the identification of inflammation (area under receiver operating characteristic curve 0.49). Abnormal pericardial effusion with a mean volume of 76 ml (range 52 to 185) was more common in inflammatory than in idiopathic DC. Considering all the possible combinations of the 4 CMR techniques, the best diagnostic accuracy for the detection of inflammation was achieved when the criterion for the diagnosis was defined as the simultaneous presence of any 2 of the CMR features ( Table 4 ).
| Characteristic | Idiopathic DC (n = 27) | Inflammatory DC (n = 15) | p Value |
|---|---|---|---|
| Left ventricular ejection fraction (%) | 22 ± 11 | 21 ± 9 | 0.74 |
| Left ventricular end-diastolic volume (ml/m 2 ) | 137 ± 39 | 148 ± 46 | 0.43 |
| Left ventricular end-diastolic diameter (mm) | 67 ± 8 | 71 ± 7 | 0.14 |
| Left ventricular mass (g/m 2 ) | 106 ± 26 | 106 ± 27 | 0.96 |
| Right ventricular ejection fraction (%) | 24 ± 9 | 23 ± 8 | 0.64 |
| Right ventricular end-diastolic volume (ml/m 2 ) | 80 ± 35 | 76 ± 23 | 0.71 |
| Interventricular septum (mm) | 9 ± 2 | 9 ± 2 | 0.45 |
| Edema ratio | 1.5 ± 0.3 | 1.5 ± 0.4 | 0.67 |
| Edema ratio >1.9 | 2 (7%) | 2 (13%) | 0.63 |
| Early gadolinium enhancement (%) | 22 ± 13 | 38 ± 32 | 0.030 † |
| Early gadolinium enhancement >45% | 1 (4%) | 6 (40%) | 0.005 † |
| Late gadolinium enhancement present | 15 (56%) | 13 (87%) | 0.049 † |
| Late gadolinium enhancement extent in left ventricle ∗ (%) | 6 ± 4 | 5 ± 3 | 0.625 |
| Late enhancement mid-wall stripe pattern | 11 (41%) | 9 (60%) | 0.23 |
| Pericardial effusion >50 ml | 3 (11%) | 7 (47%) | 0.020 † |
| Variable | LGE | p Value | |
|---|---|---|---|
| Absent (n = 14) | Present (n = 28) | ||
| New York Heart Association class | 2.2 ± 0.7 | 3.0 ± 0.8 | 0.006 ∗ |
| Left ventricular ejection fraction (%) | 23 ± 11 | 21 ± 9 | 0.44 |
| Left ventricular end diastolic volume (ml/m 2 ) | 128 ± 38 | 147 ± 42 | 0.19 |
| Left ventricular end diastolic diameter (mm) | 67 ± 9 | 69 ± 7 | 0.47 |
| Left ventricular mass (g/m 2 ) | 108 ± 28 | 123 ± 23 | 0.59 |
| B-type natriuretic peptide (ng/L) | 283 (113–812) | 1,031 (592–1,469) | 0.003 ∗ |
| High-sensitivity troponin T (ng/L) | 6 (4–16) | 18 (9–54) | 0.021 ∗ |
| High-sensitivity troponin T >13.5 pg/L | 4 (28%) | 19 (68%) | 0.023 ∗ |
| Conventional troponin I >0.03 μg/L | 3 (21%) | 10 (36%) | 0.35 |
| Maximum conventional troponin I (μg/L) | 0.3 | 3.6 | — |
| Glomerular filtration rate (ml/min/1.73 m 2 ) | 74 ± 24 | 82 ± 18 | 0.40 |
| Myocardial inflammation in biopsy | 2 (14%) | 13 (46%) | 0.04 ∗ |
| Fibrosis extent in biopsy (%) | 12 ± 5 | 16 ± 9 | 0.18 |
| Variable | Sensitivity (%) | Specificity (%) | Accuracy (%) | OR (95% CI) |
|---|---|---|---|---|
| Tissue edema ∗ | 13 | 93 | 64 | NS |
| Increased early gadolinium enhancement † | 40 | 96 | 76 | 17 (2–164) |
| Late gadolinium enhancement present | 87 | 44 | 60 | 5 (1–28) |
| Pericardial effusion ‡ | 47 | 89 | 74 | 7 (1.5–34) |
| Any criteria simultaneously | 67 | 85 | 79 | 12 (3–52) |
| Late and early gadolinium enhancement | 86 | 74 | 76 | 17 (2–164) |
| Late gadolinium enhancement plus pericardial effusion | 70 | 75 | 74 | 7 (1.5–37) |
| High-sensitivity troponin T elevated § | 67 | 56 | 60 | NS |
| Cardiovascular magnetic resonance feature plus elevated high-sensitivity troponin T | ||||
| Tissue edema | 7 | 100 | 66 | NS |
| Increased early gadolinium enhancement | 27 | 100 | 74 | NS |
| Pericardial effusion | 47 | 93 | 76 | 11 (2–64) |
| Late gadolinium enhancement present | 67 | 67 | 67 | 4 (1–15) |
| Any 2 criteria simultaneously | 53 | 93 | 78 | 14 (2–28) |
| Late gadolinium enhancement plus pericardial effusion | 78 | 76 | 76 | 11 (2–64) |
| Cardiovascular magnetic resonance feature or elevated high-sensitivity troponin T | ||||
| Tissue edema | 73 | 48 | 57 | NS |
| Increased early gadolinium enhancement | 12 | 52 | 57 | NS |
| Pericardial effusion | 67 | 52 | 57 | NS |
| Late gadolinium enhancement present | 87 | 33 | 52 | NS |
Stay updated, free articles. Join our Telegram channel

Full access? Get Clinical Tree


