Aortic valve stenosis (AS) in patients >75 years of age is a challenge for diagnosis and management of every day clinical routine. Therefore, this clinical follow-up study aims to investigate predictors of death in patients with advanced stages of AS. In a single-center study, all patients (n = 157) with primary conservatively treated severe AS (mean age 78 ± 6 years) were included. All patients had initially refused aortic valve replacement (AVR). During a median follow-up of 2.6 years (quartiles 1.7, 3.8), 62 patients with severe AS switched to AVR and 95 remained conservatively treated (no AVR). Routine clinical data were assessed together with conventional echocardiography including the measurement of longitudinal wall function and deformation (mitral ring displacement and longitudinal strain and strain rate imaging). The end points were all-cause and cardiac death. During follow-up, cardiac death occurred in 49% in no-AVR group. In a Cox regression analysis, New York Heart Association functional class, valvuloarterial impedance, stroke volume, longitudinal strain and strain rate, and mitral annular displacement identified an increased risk of all-cause death (hazard ratio [HR] for mitral annular displacement 15.9, 95% confidence interval [CI] 6.24 to 40.86, p <0.001, positive predictive value 91%). In contrast, ejection fraction or EuroSCORE was not predictive (ejection fraction: HR 1.3, 95% CI 0.82 to 2.33, p = 0.25; EuroSCORE: HR 1.1, 95% CI 0.64 to 2.02, p = 0.64). Furthermore, in multivariate regression analysis, only longitudinal mitral annular displacement and longitudinal strain rate was a significant predictor of all-cause and cardiac death risk. These data show that prognosis in elderly patients with AS is determined by symptoms, hemodynamics, and particularly by cardiac long-axis function. Thus, for risk stratification, a comprehensive assessment of cardiac function including the measurement of longitudinal mitral annular displacement should be considered.
Aortic valve stenosis (AS) constitutes a clinical problem with growing socioeconomic importance because of the continuously aging populations and an increasingly complex management. Besides conventional surgical aortic valve replacement (AVR), transcatheter aortic valve implantation (TAVI) is a particularly promising novel treatment option, but data on long-term results are still lacking. To optimally treat and inform patients of their prognosis, detailed knowledge on the natural evolution of severe AS and its determinants is crucial. Although AVR is the treatment of choice, with excellent survival rates if performed timely, several surveys indicated that 30% to 40% of patients with severe symptomatic AS are not referred for AVR or TAVI mainly because of lacking knowledge of the dismal prognosis of untreated AS and misconceptions about surgical risks, particularly in elderly patients. Although risk scores for patients with severe AS were defined before the era of TAVI, none of these scores reliably predicts prognosis. Assessing AS severity has remained challenging. For example, the estimated aortic valve area (AVA) or ejection fraction (EF) may not necessarily be useful risk indicators, especially because risk is very much determined by the state of the myocardium. Thus, besides valvular and hemodynamic parameters, the present study aimed to identify predictors of long-term prognosis in AS focusing on imaging biomarkers representing longitudinal myocardial function.
Methods
All patients, referred for AS assessment from 2005 to 2007 from general practitioners or specialist outpatient clinics, were consecutively included in the present study if (1) they had isolated AS, that is, absence of previous myocardial infarction or coronary artery stenosis >50% on angiogram; all patients had a coronary angiography, (2) the severity of AS was high, and (3) they had opted for conservative treatment initially. Thirteen percentage of patients were asymptomatic but had an indication for AVR because of reduced left ventricular (LV) EF, severe hypertrophy, or symptoms during stress echocardiography. Severe AS was defined as AVA <1.0 cm 2 . In patients with low-flow low-gradient AS (reduced EF and a mean gradient [MG] of <40 mm Hg despite an AVA of <1.0 cm²), the severity of AS may be particularly difficult to assess because compromised aortic valve opening may be due to either significant valvular stenosis or poor LV function. In such cases (14%), a low-dose dobutamine stress echocardiography was performed to confirm true severe AS, and only patients with true stenosis were included. Eleven percentage of patients presented a paradoxical low-flow low-gradient AS with an EF of >50% and a MG of <40 mm Hg. In total, 157 patients were followed up for a median of 2.6 years (quartiles 1.7, 3.8).
During the follow-up period, 62 of 157 patients with severe AS changed their initial decision because of symptom progression or increasing psychological strain and underwent AVR subsequently. The median time to revision of initial decision for patients with severe AS was 2.0 months (quartiles 1.0, 5.2). Hence, 95 patients with severe AS remained conservatively treated (no AVR) during the complete follow-up period.
At study inclusion, all patients underwent a standard echocardiographic examination. Published data suggest that the proportion of patients with severe AS surviving up to 2 years of conservative treatment may be as low as 20%. To account for potential improvement in outcome, the investigators decided to define a follow-up period of at least 2 years, so that a sufficiently large number of patients should have reached an end point defined as all-cause or cardiac death. The study conformed to the principles outlined in the Declaration of Helsinki and was approved by the Ethics Committee of University Hospital Würzburg. Patients signed an informed consent before the study start.
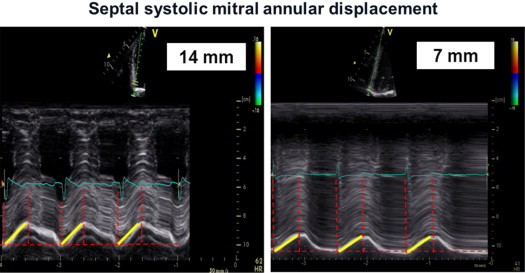
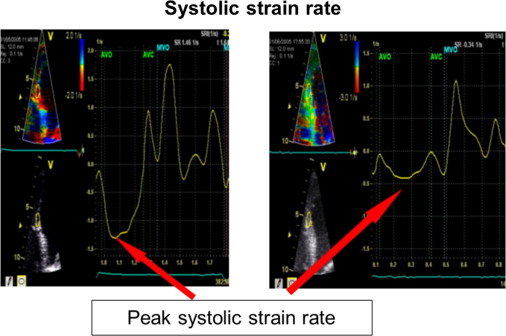
Transthoracic echocardiography was performed using a Vivid 7 System (GE, Vingmed Ultrasound, Horten, Norway) with a 3.5-MHz transducer. A standardized echocardiographic study for systolic and diastolic parameters was done. LV end-diastolic and end-systolic dimensions as well as end-diastolic thicknesses of the septum and posterior wall were measured from M-mode parasternal LV long-axis images. EF (modified Simpson’s biplane method) and stroke volume index (SVI) were calculated. Continuous-wave Doppler recordings for assessing maximal aortic valve velocity were derived using the multiwindow interrogation. Peak aortic valve and LV outflow tract velocities and gradients were measured using continuous- and pulsed-wave Doppler. AVA was calculated by the continuity equation according to American Heart Association/European Society of Cardiology guidelines. LV mass was computed by the Devereux-modified cube formula and normalized for body surface area to obtain the LV mass index. In addition, valvuloarterial impedance [Z va = (SAP + MG)/SVI; with SAP = systolic arterial pressure] was assessed. Septal and lateral systolic mitral annular displacements were assessed using M-mode echocardiography in an apical 4-chamber view by measuring the maximal excursion of the mitral annular from the onset of QRS complex until the end of T wave on theelectrocardiogram ( Figure 1 ). The reproducibility of this marker was examined by triple (intraobserver) and double measurements (interobserver) of 10 different patients, yielding coefficients of variation of 5.5% and 6.3% for intra- and interobserver reproducibility, respectively ( Figure 1 ). For survival analyses, a mitral annular displacement cut-off value of <7 mm was used because previous studies had indicated a substantially increased mortality risk below this threshold for patients with severe AS, most likely owing to a greater degree of myocardial fibrosis. The analogous method was used at the tricuspid annulus to measure the tricuspid annular plane systolic excursion. Furthermore, tissue Doppler imaging with a frame rate of at least 150 frames/s was done immediately after conventional echocardiography and postprocessed with a dedicated software (Echopac, GE Ultrasound). Radial function was assessed by peak systolic strain and strain rate (related to regional contractility) scanning the posterior wall from parasternal views. For longitudinal function, these parameters were extracted from the midventricular segment of the septum and lateral wall using an apical 4-chamber view ( Figure 2 ). For right ventricular (RV) function, the strain and strain rate was extracted from the RV free lateral wall. The E/A ratio was measured from pulsed-wave Doppler mitral inflow velocities, and E/E′ from pulsed-wave tissue Doppler in the septal and lateral mitral annulus. Later, a mean of both was calculated. The systolic pressure gradient (right ventricle/right atrium) was measured from continuous-wave Doppler across the tricuspid valve.
Data are presented as mean ± SD or median (quartiles), as appropriate. Groups were compared by t , Mann-Whitney U , chi-square, or Fisher’s exact test, as appropriate ( Tables 1 and 2 ). For prognostic analyses, Cox proportional hazards regression was used. Prognostic indicators were sought among variables reported in Tables 1 and 2 , and hazard ratio with its 95% confidence interval, Wald index, and the area under the receiver operating characteristics curve (with its standard error) are reported. The latter analyses were performed with fixed adjustment for gender and age. The proportionality assumption was ascertained by inspection of log-minus-log plots and no violation was observed. Furthermore, in a multivariate logistic regression approach, independent predictors were sought by backward selection using the likelihood ratio criterion (p in = 0.05, p out = 0.1). All tests were performed 2 sided. SPSS, version 18.0.1 (SPSS Inc, Chicago, Illinois), was used.
| Characteristic | AVR | p | |
|---|---|---|---|
| No (n = 95) | Yes (n = 62) | ||
| Age (yrs) | 82 (79, 86) | 78 (76, 80) | 0.65 |
| Men | 39 (41) | 39 (63) | 0.006 |
| Body surface area (m²) | 1.76 ± 0.18 | 1.88 ± 0.19 | 0.13 |
| NYHA functional class I/II/III/IV | 13/19/43/20 | 8/20/23/11 | 0.38 |
| EuroSCORE, (%) | 14 (8, 21) | 15 (12, 17) | 0.27 |
| Systolic blood pressure (mm Hg) | 130 ± 26 | 131 ± 37 | 0.78 |
| Diastolic blood pressure (mm Hg) | 74 ± 11 | 75 ± 14 | 0.75 |
| Angina pectoris | 30 (32) | 28 (45) | 0.06 |
| Syncope | 10 (11) | 8 (13) | 0.41 |
| Atrial fibrillation | 37 (39) | 23 (37) | 0.12 |
| Coronary artery disease | 35 (37) | 25 (40) | 0.14 |
| History of hypertension | 69 (73) | 47 (76) | 0.21 |
| Diabetes mellitus | 36 (38) | 20 (32) | 0.37 |
| Hyperlipoproteinemia | 43 (45) | 42 (60) | 0.04 |
| Current smoker | 23 (24) | 13 (21) | 0.41 |
| Family history for coronary artery disease | 10 (11) | 7 (11) | 0.41 |
| ACEi/ARB | 57 (60) | 38 (62) | 0.41 |
| β Blocker | 57 (60) | 42 (68) | 0.49 |
| Diuretics | 78 (82) | 53 (85) | 0.48 |
| Calcium channel blocker | 15 (16) | 11 (18) | 0.47 |
| Cardiac glycoside | 30 (32) | 19 (31) | 0.49 |
| Statin | 37 (39) | 27 (43) | 0.38 |
| Aspirin | 52 (55) | 33 (53) | 0.43 |
| Anticoagulation ∗ | 21 (22) | 13 (21) | 0.49 |
| Mineralocorticoid receptor blocker † | 15 (16) | 7 (11) | 0.27 |
| Characteristic | AVR | p | |
|---|---|---|---|
| No (n = 95) | Yes (n = 62) | ||
| Severity of AS | |||
| AVA (cm 2 ) | 0.8 ± 0.1 | 0.8 ± 0.1 | 0.83 |
| Indexed AVA (cm²/m 2 ) | 0.4 ± 0.1 | 0.4 ± 0.1 | 0.86 |
| Peak aortic velocity (m/s) | 3.9 ± 0.9 | 4.0 ± 0.9 | 0.87 |
| Mean aortic gradient (mm Hg) | 42 (27, 55) | 45 (24, 5) | 0.73 |
| Maximal aortic gradient (mm Hg) | 60 (44, 82) | 64 (42, 77) | 0.34 |
| Index of global hemodynamic load | |||
| Valvuloarterial impedance (mm Hg/ml/m 2 ) | 7.9 ± 1.0 | 7.8 ± 1.2 | 0.63 |
| Systolic and diastolic parameters | |||
| EF (%) | 53 ± 14 | 54 ± 13 | 0.56 |
| SVI (ml/m 2 ) | 43 (30, 51) | 41 (29, 49) | 0.62 |
| Septal/lateral mitral annular displacement (mm) | 7.3 ± 2.1 | 7.5 ± 2.0 | 0.17 |
| Septal mitral annular displacement (mm) | 6.9 ± 1.9 | 6.9 ± 1.8 | 0.13 |
| Lateral mitral annular displacement (mm) | 7.9 ± 2.1 | 8.1 ± 1.9 | 0.11 |
| Tricuspid ring displacement (mm) | 15 ± 5 | 15 ± 5 | 0.72 |
| Radial (posterior) systolic strain rate (s −1 ) | 1.43 ± 0.48 | 1.25 ± 0.52 | 0.69 |
| Longitudinal (septal/lateral) strain rate (s −1 ) | −0.84 ± 0.33 | −0.92 ± 0.30 | 0.86 |
| Longitudinal (septal) systolic strain rate (s −1 ) | −0.88 ± 0.33 | −0.97 ± 0.27 | 0.05 |
| Longitudinal (lateral) systolic strain rate (s −1 ) | −0.80 ± 0.30 | −1.0 ± 0.27 | 0.13 |
| Longitudinal (lateral) RV strain rate (s −1 ) | −1.87 ± 0.54 | −1.61 ± 0.55 | 0.80 |
| Radial (posterior) systolic strain (%) | 27 ± 12 | 24 ± 13 | 0.79 |
| Longitudinal (septal) systolic strain (%) | −14 ± 6 | −16 ± 6 | 0.42 |
| Longitudinal (lateral) systolic strain (%) | −12 ± 5 | −15 ± 5 | 0.54 |
| Longitudinal (lateral) RV strain (%) | −25 ± 8 | −24 ± 10 | 0.20 |
| Systolic pulmonary arterial pressure (mm Hg) | 42 ± 17 | 40 ± 15 | 0.32 |
| E/A | 0.8 (0.6, 1.3) | 1.0 (0.7, 1.3) | 0.31 |
| E/E′ | 18 (15, 24) | 23 (18, 27) | 0.001 |
| LV geometry | |||
| LV end-systolic diameter (mm) | 33 ± 11 | 35 ± 10 | 0.64 |
| LV end-diastolic diameter (mm) | 46 ± 9 | 49 ± 9 | 0.78 |
| Posterior wall thickness (end-diastolic) (mm) | 12.5 ± 2.0 | 13.0 ± 1.8 | 0.31 |
| Interventricular septal thickness (end-diastolic) (mm) | 12.5 ± 2.1 | 13.1 ± 1.8 | 0.24 |
| LV mass index (g/m 2 ) | 160 (118, 192) | 174 (145, 219) | 0.04 |
Results
Table 1 lists the baseline characteristics of the 2 patient groups. Comparing patients with severe AS, the only differences between no-AVR and surgically treated patients were gender and hyperlipoproteinemia. All other cardiovascular risk factors, co-morbid conditions, and pharmacotherapy were similarly distributed between the groups. The percentage of patients with atrial fibrillation was larger than that of patients treated with anticoagulant. Not all patients with atrial fibrillation were anticoagulated because of co-morbidities or contraindications. Echocardiographic data for the 2 patient groups are listed in Table 2 . Among patients with severe AS, there was no significant difference between surgically and nonsurgically treated patients regarding AS severity; however, E/E′ and LV mass index was significantly different in patients opting for AVR during follow-up ( Table 2 ). However, all other functional and deformation parameters such as strain and strain rate were not different between both groups.
All-cause and cardiac mortality in the overall cohort was 68 (43%) of 157 and 56 (35%) of 157, respectively. Tables 3 and 4 lists major characteristics of survivors and deceased in both AVR and non-AVR groups. In AVR group, significant differences could be seen for all longitudinal functional parameters including RV longitudinal function as well as hemodynamic characteristics such as Z va , MG, and SVI with higher values for survivors. Furthermore, New York Heart Association class IV was present significantly more often in deceased. In contrast, atrial fibrillation, syncope, coronary artery disease, EF, and EuroSCORE did not differ. Similar findings could be seen in the subgroup of patients with AVR except for RV function and New York Heart Association class ( Table 4 ). Figure 3 displays the Kaplan-Meier survival curves for the 2 study groups with severe AS. Panel (A) shows that preserved mitral annular displacement (defined as mitral annular displacement of ≥7 mm) was associated with a significant better survival rate for both no-AVR and surgically treated patients. In contrast, a preserved EF (panel B) did not predict better survival of conservatively (no-AVR) or surgically treated patients. Of note, among no-AVR group, 52 (91%) of 57 with a mitral annular displacement of <7 mm and 24 (70%) of 34 with EF of ≤50% died and all cause death was recorded only in 5 (13%) of 38 with a mitral annular displacement of ≥7 mm, but 28 (46%) of 61 with an EF of >50% died. When combining preserved EF with a preserved or slightly reduced longitudinal function (i.e., mitral annular displacement of ≥7 mm), 84% of the patients refusing AVR survived (panel C) . In contrast, only 3.4% with a preserved EF and severely reduced longitudinal function (mitral annular displacement of <7 mm) refusing AVR survived. Survival rate was 100% if both mitral annular displacement and EF was preserved in patients opting for AVR during follow-up. However, only 40% of patients who underwent AVR during follow-up with a normal EF but reduced longitudinal wall function survived (panel C) .
| Characteristic | All Patients (n = 95) | Survivor (n = 38) | Deceased (n = 57) | p |
|---|---|---|---|---|
| Age (yrs) | 82 (79, 86) | 82 (80, 87) | 81 (78, 85) | 0.64 |
| NYHA I/II/III/IV | 13/19/43/20 | 8/6/21/3 | 5/13/22/17 | 0.04 |
| Syncope | 10 (11) | 4 (11) | 6 (11) | 0.49 |
| Coronary artery disease | 35 (37) | 13 (34) | 22 (38) | 0.34 |
| Atrial fibrillation | 37 (39) | 13 (34) | 24 (42) | 0.28 |
| EuroSCORE (%) | 14 (8, 21) | 13 (8, 20) | 16 (8, 23) | 0.35 |
| AVA (cm²) | 0.8 ± 0.1 | 0.81 ± 0.1 | 0.78 ± 0.1 | 0.36 |
| Peak transvalvular gradient (m/s) | 61 (44, 82) | 67 (51, 83) | 55 (42, 68) | 0.04 |
| Mean transvalvular aortic gradient (mm Hg) | 42 (27, 55) | 46 (36, 55) | 35 (30, 45) | 0.03 |
| Ejection fraction (%) | 53 ± 14 | 56 ± 14 | 53 ± 14 | 0.05 |
| Mitral annular displacement (septal/lateral) (mm) | 7.3 ± 2.1 | 8.7 ± 1.8 | 6.1 ± 1.6 | <0.001 |
| Longitudinal strain rate (septal/lateral) (mm) | −0.84 ± 0.33 | −0.97 ± 0.4 | −0.72 ± 0.2 | <0.001 |
| Longitudinal strain (septal/lateral) (mm) | −13 ± 5 | −15 ± 6.5 | −12 ± 6.0 | 0.01 |
| Tricuspid ring displacement (mm) | 15 ± 5 | 16 ± 5.6 | 13 ± 4.0 | 0.01 |
| Valvuloarterial impedance (mm Hg/ml/m 2 ) | 7.9 ± 1.0 | 6.7 ± 1.1 | 9.1 ± 1.2 | 0.01 |
| E/E′ | 18 (15, 24) | 19.7 (16, 22) | 20.4 (15, 24) | 0.43 |
| SVI (ml) | 43 (30, 51) | 48 (33, 58) | 35 (23, 45) | 0.04 |
| LV mass index (g/m 2 ) | 160 (118, 192) | 163 (135, 199) | 157 (113, 188) | 0.30 |
| Characteristic | All Patients (n = 62) | Survivors (n = 54) | Deceased (n = 8) | p |
|---|---|---|---|---|
| Age (yrs) | 78 (76, 80) | 77 (76, 80) | 79 (78, 81) | 0.41 |
| NYHA I/II/III/IV | 8/20/23/11 | 8/17/21/8 | 0/3/4/1 | 0.13 |
| Syncope | 8 (13%) | 7 (13%) | 1 (13%) | 0.96 |
| Coronary artery disease | 25 (40%) | 22 (41%) | 3 (38%) | 0.87 |
| Atrial fibrillation | 23 (37%) | 20 (37%) | 3 (38%) | 0.76 |
| EuroSCORE (%) | 15 (12, 17) | 15 (12, 17) | 16 (8, 17) | 0.57 |
| Aortic valve area (cm²) | 0.8 ± 0.1 | 0.8 ± 0.1 | 0.8 ± 0.1 | 0.78 |
| Peak aortic velocity (m/s) | 4.0 ± 0.9 | 4.1 ± 0.9 | 3.9 ± 0.9 | 0.64 |
| Mean transvalvular aortic gradient (mm Hg) | 45 (24, 54) | 46 (43, 57) | 44 (28, 54) | 0.56 |
| Ejection fraction (%) | 54 ± 13 | 54 ± 14 | 56 ± 11 | 0.62 |
| Mitral annular displacement (septal/lateral) (mm) | 7.5 ± 2.0 | 8.2 ± 1.6 | 6.3 ± 1.2 | <0.001 |
| Longitudinal strain rate (septal/lateral) (mm) | −0.92 ± 0.30 | −1.15 ± 0.24 | −0.72 ± 0.11 | <0.001 |
| Longitudinal strain (septal/lateral) (mm) | −16 ± 5 | −18 ± 5 | −13 ± 5 | 0.04 |
| Tricuspid ring displacement (mm) | 15 (5) | 16 (5) | 15 (5) | 0.65 |
| Valvuloarterial impedance (mm Hg/ml/m 2 ) | 7.8 ± 1.2 | 6.7 ± 2.1 | 8.7 ± 1.8 | <0.001 |
| E/E′ | 23 (18, 27) | 23 (20, 27) | 22 (13, 28) | 0.39 |
| SVI (ml) | 41 (29, 49) | 45 (43, 57) | 37 (35, 47) | 0.01 |
| LV mass index (g/m 2 ) | 174 (145, 219) | 175 (144, 210) | 173 (142, 219) | 0.44 |
Stay updated, free articles. Join our Telegram channel

Full access? Get Clinical Tree


