Accurate noninvasive assessment of right atrial pressure (RAP) is important for volume management in patients with heart failure (HF). Transient elastography is a noninvasive and reliable method to assess liver stiffness (LS). We investigated the value of LS for evaluation of RAP in patients with HF without structural liver disease. We measured LS using transient elastography (Fibroscan) in 31 patients undergoing right-sided cardiac catheterization (test group). The relation between LS and RAP found in the test group was used to derive the best-fit model to predict RAP. The applicability of the model was then tested in a validation group of 49 additional patients. There was an excellent correlation between LS and RAP in the test group (r = 0.95, p <0.0001; RAP = −5.8 + 6.7 × ln [LS]). Natural log transformation (ln) of LS provided the regression equation to predict RAP. When the equation model derived from the test group was applied to the validation group, predicted RAP correlated excellently with actual RAP (r = 0.90, p <0.0001). The receiver operating characteristic curve analyses in the test group showed that LS favorably compared with echocardiography for detecting RAP >10 mm Hg (area under the curve 0.958 vs 0.800, respectively, p = 0.047). In the validation group, LS with a cut-off value of 10.6 kPa for identifying RAP >10 mm Hg had a higher sensitivity and accuracy (p = 0.046 and p = 0.049, respectively) than echocardiography. In conclusion, LS may offer an accurate noninvasive diagnostic method to assess RAP in patients with HF.
Increased right atrial pressure (RAP) causes liver congestion in most patients hospitalized with acute heart failure syndrome. Anatomically, the liver is wrapped in a distensible but nonelastic envelope. Thus, liver congestion due to RAP elevation may lead to increased liver stiffness (LS). One experimental study of Landrace pigs showed that LS derived from transient elastography is directly influenced by central venous pressure in a reversible manner. Transient elastography is a noninvasive and reliable approach that has been introduced to assess LS by measuring the liver shear wave speed; however, the method has mainly been studied to stage liver fibrosis. In the present study, we hypothesized that in the absence of structural liver disease, LS as assessed by transient elastography can be used to evaluate RAP in patients with heart failure (HF). To test this hypothesis, we investigated the relation between LS and invasively measured RAP. Furthermore, we compared the predictive value of LS with that of conventional echocardiography for identifying elevated RAP.
Methods
Patients admitted with HF and scheduled for right-sided cardiac catheterization were prospectively enrolled over a period of 8 months. Right-sided cardiac catheterization was indicated in patients who required accurate hemodynamic monitoring because of clinically indeterminate volume and those refractory to initial therapy. Patients being considered for cardiac transplantation or placement of a mechanical circulatory support system were also included. The diagnosis of HF was primarily based on signs and symptoms derived from a thorough history and physical examination. Patients with history or signs of liver disease on hepatic ultrasound or invalid LS measurements due to severe obesity, narrow intercostal space, and substantial ascites were excluded from the study. The study protocol was approved by the institutional ethical committee, and written informed consent was obtained from all patients.
Both LS monitoring and echocardiographic assessments were performed within 3 hours before right-sided cardiac catheterization by a different examiner for each examination. The examiners were blinded to each other’s results. Routine laboratory testing was performed on the same day. To identify the best model for deriving RAP from LS, the patients were divided into 2 subgroups: the test group and the validation group. We first obtained a regression equation between RAP and LS in the initial population (test group) and subsequently tested it in the second population (validation group). Finally, we developed the revised equation model for estimating RAPs from LS values in all patients. Thereafter, we compared the performance of LS for predicting RAP elevation with the conventional echocardiographic approach. LS was measured at the end-expiratory period using transient elastography with a Fibroscan device (Echosens, Paris, France). The tip of the transducer was placed vertically on the skin between the rib bones at the level of the right liver lobe while the patient was lying supine with the right arm fully abducted. All measurements were done by a single certified examiner (TT) who had previously performed >500 determinations. Absolute and median values are expressed in kilopascals (kPa). When LS values showed an interquartile range/median ratio >0.25 or a success rate <60%, they were considered invalid. In each patient, up to 10 successful measurements were performed, and individuals with invalid measurements were excluded from the final analysis. LS examination was performed in <5 minutes in all cases.
Right-sided cardiac catheterization was performed in the cardiac catheterization laboratory or cardiac care unit using a flow-directed pulmonary artery catheter. Pressure calibration was performed before and after pressure measurements. All readings were referenced to the midaxillary line with the patient in the supine position. Pressure measurements were determined at the end-expiratory period, with an average of 3 to 5 cycles obtained. Cardiac output was measured by the assumed Fick equation.
Echocardiography was performed by an experienced operator using a Vivid q portable ultrasound system equipped with a 1.5- to 3.6-MHz 3S-RS probe (GE, Healthcare, Milwaukee, Wisconsin), as previously described. Routine echocardiographic measurements were obtained according to the guidelines of the American Society of Echocardiography. The maximal and minimal inferior vena cava (IVC) diameters were measured within 3 cm of the IVC-right atrium junction during passive respiration. Echocardiographically estimated RAP was measured semiquantitatively based on IVC size and respiratory collapse rate according to American Society of Echocardiography criteria.
Intra- and interobserver agreements were analyzed by calculating the intraclass correlation coefficient in 10 randomly selected patients. Intrarater agreement was calculated as the agreement between the first and second LS of the single observer (TT), whereas interrater agreement was calculated as the agreement between the first LS of the 2 observers (TT and YT).
Statistical analyses were performed using JMP software, version 10.0 (SAS Institute, Cary, North Carolina) and SPSS for Windows, version 20.0 (SPSS Inc., Chicago, Illinois). A 2-sided p value <0.05 was considered statistically significant. Bland-Altman plots were used to show agreement between invasively determined RAP and LS-derived RAP, by plotting the difference against the mean. Categorical data are presented as percentages, normally distributed continuous data are presented as mean ± SD, and nonnormally distributed variables are presented as median and interquartile range. Kruskal-Wallis tests were used to compare continuous variables between groups, and chi-squared tests were used for categorical variables. For each continuous variable, linearity was assessed and an appropriate transformation applied, if necessary. Natural log transformation (ln) of LS was used to satisfy the model assumptions; the “best-fit” line of the relation between LS and RAP was determined by simple linear regression analysis. Comparison between regression lines was made by analysis of covariance. Receiver operating characteristic (ROC) curves and area under the curve were computed to (1) compare the effectiveness of transient elastography and echocardiography and (2) examine their optimal sensitivity and specificity to predict RAP elevation. An RAP of >10 mm Hg was considered a clinically significant elevation in RAP. For comparison of correlated ROC areas, the method described by DeLong et al was used. Relations between LS and other variables were assessed by Pearson, Spearman, and point-biserial correlation coefficients. Only variables with a probability value <0.1 in univariate analysis were entered into multivariate analysis. Stepwise multiple linear regression analyses were performed to identify the determinants of LS.
Results
In total, 105 subjects were screened for this study. Sixteen patients were excluded before scanning because of organic hepatic diseases. Of 89 consecutive patients enrolled in the study, 9 patients with invalid LS were also excluded: 5 patients with interquartile range >0.25 and 4 with success rate <60%. Indications for right-sided cardiac catheterization and clinical diagnosis are presented in Table 1 . In the remaining 80 patients, initial 31 patients were analyzed for the test group and additional 49 for the validation group. Eleven patients were examined during mechanical ventilation. There was no significant difference in clinical characteristics between the 2 groups ( Table 2 ).
| Clinical Diagnosis | Value, n = 80 |
|---|---|
| Dilated cardiomyopathy | 21 (26) |
| After valvular surgery ∗ | 12 (15) |
| Valvular heart disease † | 5 (6) |
| After heart transplantation | 5 (6) |
| Pulmonary hypertension | 5 (6) |
| After coronary artery bypass surgery | 4 (5) |
| Cardiac sarcoidosis | 4 (5) |
| Ischemic cardiomyopathy | 3 (4) |
| Pulmonary embolization | 3 (4) |
| Hypertrophic cardiomyopathy | 3 (4) |
| HF with preserved ejection fraction | 3 (4) |
| Constrictive pericarditis | 3 (4) |
| Acute coronary syndrome | 2 (3) |
| Atrial septal defect | 2 (3) |
| Fulminant myocarditis | 2 (3) |
| Drug-induced cardiomyopathy | 1 (1) |
| Sick sinus syndrome | 1 (1) |
| Ventricular tachycardia | 1 (1) |
∗ Of “after valvular surgery,” 3 were aortic and mitral valve replacements, 3 were isolated mitral valve replacement, 3 were isolated aortic valve replacement, 2 were isolated mitral valve repair, and 1 was isolated pulmonary valve replacement.
† Of valvular heart disease, 4 were severe aortic stenosis and 1 was severe mitral regurgitation.
| Variable | Test Group (n = 31) | Validation Group (n = 49) |
|---|---|---|
| Age (yrs) | 57 ± 17 | 58 ± 18 |
| Men | 22 (78%) | 38 (78%) |
| Body mass index (kg/m 2 ) | 22.1 (18.7–24.4) | 21.9 (19.4–25.3) |
| Body surface area (m 2 ) | 1.66 ± 0.18 | 1.67 ± 0.20 |
| New York Heart Association functional class, Ⅰ/Ⅱ/Ⅲ/Ⅳ | 3/10/10/8 | 3/25/9/12 |
| On mechanical ventilation | 6 (20%) | 5 (10%) |
| LS (kPa) | 8.5 (5.3–12) | 9.5 (5.9–15.3) |
| Hemoglobin (g/dL) | 12.0 (9.6–13.5) | 12.1 (9.8–14.1) |
| Platelet count (10 4 /mm 3 ) | 18.4 ± 8.4 | 17.9 ± 5.9 |
| Aspartate aminotransferase (IU/L) | 24 (18–42) | 25 (19–45) |
| Alanine aminotransferase (IU/L) | 20 (12–31) | 25 (15–35) |
| γ-Glutamyl transpeptidase (IU/L) | 58 (31–91) | 64 (38–124) |
| Alkaline phosphatase (IU/L) | 230 (161–331) | 236 (186–331) |
| Lactic dehydrogenase (IU/L) | 222 (183–368) | 219 (191–312) |
| Total bilirubin (mg/dl) | 0.7 (0.5–1.1) | 0.8 (0.5–1.5) |
| Total cholesterol (mg/dl) | 168 ± 44 | 166 ± 38 |
| Triglycerides (mg/dl) | 94 (59–165) | 112 (66–164) |
| High-density lipoprotein cholesterol (mg/dl) | 48 ± 18 | 47 ± 14 |
| Low-density lipoprotein cholesterol (mg/dl) | 95 ± 34 | 92 ± 27 |
| Albumin (g/dl) | 3.8 (3.3–4.2) | 3.9 (3.3–4.3) |
| Estimated glomerular filtration ratio (ml/min/1.73 m 2 ) | 61 ± 28 | 51 ± 24 |
| B-type natriuretic peptide (pg/ml) | 274 (69–610) | 275 (57–534) |
| Mean RAP (mm Hg) | 9 (5–12) | 9 (6–14) |
| Heart rate (beats/min) | 75 (67–93) | 78 (66–89) |
| Systolic blood pressure (mm Hg) | 106 (90–114) | 102 (91–121) |
| Diastolic blood pressure (mm Hg) | 59 (56–64) | 58 (52–65) |
| Systolic pulmonary artery pressure (mm Hg) | 35 (28–48) | 36 (27–46) |
| Diastolic pulmonary artery pressure (mm Hg) | 17 (12–25) | 18 (13–22) |
| Pulmonary capillary wedge pressure (mm Hg) | 14 (10–25) | 17 (11–23) |
| Cardiac output (L/min) | 3.63 (3.27–4.82) | 3.67 (2.75–4.58) |
| Cardiac index (L/min/m 2 ) | 2.26 (1.80–2.84) | 2.10 (1.76–2.70) |
| Maximal IVC diameter (mm) | 18 (11–22) | 17 (13–23) |
| Minimal IVC diameter (mm) | 15 (5–19) | 11 (5–17) |
| Estimated RAP (mm Hg) | 8 (3–15) | 8 (3–15) |
| Left ventricular end-diastolic dimension (mm) | 51 (46–70) | 54 (48–67) |
| Left ventricular end-systolic dimension (mm) | 40 (29–65) | 43 (32–62) |
| Left ventricular ejection fraction (%) | 46 (23–68) | 39 (24–64) |
| Left ventricular end-diastolic volume (ml) | 156 (112–234) | 174 (147–242) |
| Left ventricular end-systolic volume (ml) | 84 (54–188) | 95 (62–188) |
| Mitral regurgitation grade (none/mild/moderate/severe) | 14/11/3/3 | 15/16/10/6 |
| Tricuspid regurgitation grade (none/mild/moderate/severe) | 12/10/8/1 | 16/17/10/3 |
| Tricuspid regurgitation pressure gradient (mm Hg) | 30 (23–35) | 24 (18–37) |
| Right ventricular diameter (mm) | 38 ± 8 | 38 ± 9 |
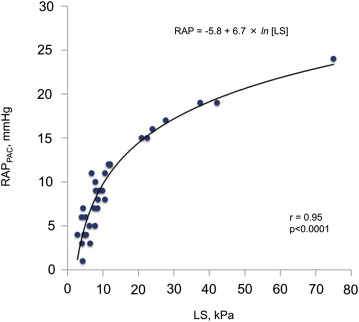
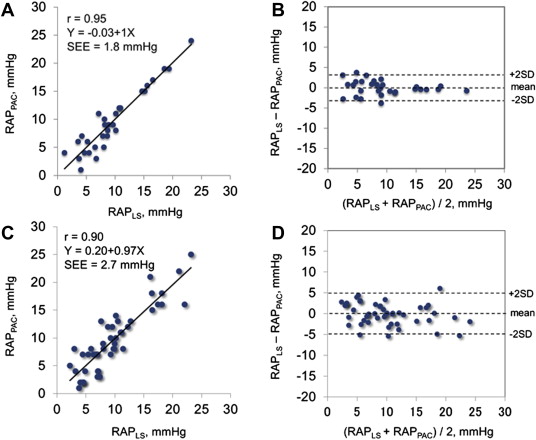
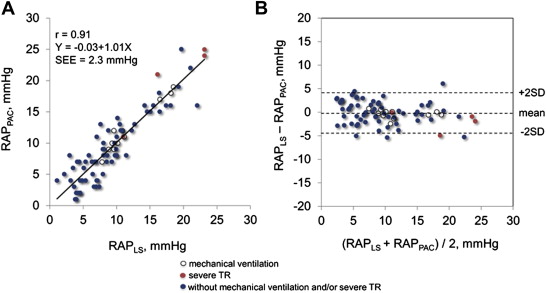
In the test group, we found a close curvilinear relation between LS and RAP measured by pulmonary artery catheter ( Figure 1 ). There was an excellent linear relation between ln [LS] and RAP measured by pulmonary artery catheter. Predicted RAP using the “best-fit” equation model correlated well with RAP ( Figure 2 ). Bland-Altman plots revealed that the mean difference between predicted and actual RAP was −0.14 ± 1.77 mm Hg, with no tendency for a systematic bias ( Figure 2 ). When the equation model derived from the test group was applied to the validation group, predicted RAP still correlated excellently with the actual RAP ( Figure 2 ). Bland-Altman plots revealed that the mean difference between predicted and actual RAP averaged −0.05 ± 2.64 mm Hg, with no tendency for a systematic bias ( Figure 2 ). When the equation model was tested in all 80 patients, correlation between predicted and actual RAP remained excellent ( Figure 3 ). Bland-Altman plots revealed that the mean difference between predicted and observed RAP averaged −0.09 ± 2.33 mm Hg, with no tendency for a systematic bias ( Figure 3 ). Notably, the relation persisted even in patients on mechanical ventilation or with severe tricuspid regurgitation (r = 0.97, p <0.0001; Figure 3 ). Analysis of covariance did not show a significant difference between the equation model derived from both groups (RAP = −5.9 + 6.8 × ln [LS]) and the equation model developed in the test group (p = NS).
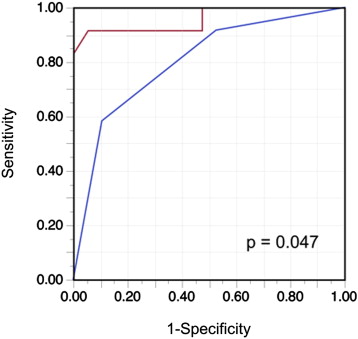
Consistent with previous observations, RAP values estimated on the basis of IVC diameter and collapse (American Society of Echocardiography criteria) correlated significantly with actual RAP (r = 0.65, p <0.0001) in the test group. The ROC curve analysis of the IVC parameters showed a significant discriminatory ability to identify RAP >10 mm Hg (area under the curve = 0.800, 95% CI 0.604 to 0.913, p <0.0001). The corresponding optimal cut-off value was 15 mm Hg (range, 10 to 20). The area under the curve of LS for identification of RAP >10 mm Hg was 0.958 (95% CI 0.757 to 0.994, p <0.0001), which was significantly greater than that of the 2-dimensional echocardiographic IVC parameters ( Figure 4 ). Based on the ROC curve analysis, the optimal cut-off value for LS for detection of RAP >10 mm Hg was an LS ≥10.6 kPa. The 2 methods for detecting elevated RAP were examined in the validation group ( Table 3 ). The value of LS yielded a good balance among sensitivity, specificity, and accuracy in the validation group. Furthermore, LS ≥10.6 kPa showed a significantly greater sensitivity and accuracy for detecting RAP >10 mm Hg than echocardiography.