The presentation of stress cardiomyopathy (SC) with nonobstructive coronary artery disease mimics that of ST-segment elevation myocardial infarction (STEMI) due to coronary occlusion. No single parameter has been successful in differentiating the 2 entities. We thus sought to develop a noninvasive clinical tool to discriminate between these 2 conditions. We retrospectively reviewed 59 consecutive cases of SC at our institution from July 2005 through June 2011 and compared those with 60 consecutives cases of angiographically confirmed STEMI treated with primary percutaneous coronary intervention in the same period. All patients underwent acute echocardiography, and the peak troponin I level was determined. The troponin-ejection fraction product (TEFP) was derived by multiplying the peak troponin I level and the echocardiographically derived left ventricular ejection fraction. Comparing the SC and STEMI groups, the mean left ventricular ejection fraction at the time of presentation was 30 ± 9% versus 44 ± 11%, respectively (p <0.001), and the peak troponin I was 7.6 ± 18 versus 102.2 ± 110.3 ng/dl, respectively (p <0.001). The mean TEFP was thus 182 ± 380 and 4,088 ± 4,244 for the SC and STEMI groups, respectively (p <0.001). Receiver operating characteristic curve analysis showed that a TEFP value ≥250 had a sensitivity of 95%, a specificity of 87%, a negative predictive value of 94%, a positive predictive value of 88%, and an overall accuracy of 91% to differentiate a true STEMI from SC (C-statistic 0.91 ± 0.02, p <0.001). In conclusion, for patients not undergoing emergent angiography, the TEFP may be used with high accuracy to differentiate SC with nonobstructive coronary artery disease from true STEMI due to coronary occlusion.
The discrimination of the likelihood of stress cardiomyopathy (SC) versus ST-segment elevation myocardial infarction (STEMI) due to coronary thrombosis is of particular importance when it involves unstable (i.e., high-risk) patients with critical medical conditions such as severe sepsis, postoperative shock, respiratory failure, or oncologic patients during the nadir phase of chemotherapy induction, in whom cardiac catheterization entails increased risk. Thus far, no reliable predictor to suggest SC or, more importantly, to rule out STEMI due to coronary occlusion in such clinical conditions has been reported. From experience, we have noticed that patients with SC often have a significantly reduced left ventricular ejection fraction (LVEF), disproportionate to the level of the troponin increase (i.e., the peak troponin level is less than would otherwise be expected), whereas in the cases of STEMI, the troponin increase is relatively greater for the moderately reduced LVEF. The synchronous trend toward a lower value of peak troponin level and LVEF in SC compared with STEMI has led us to propose a novel parameter, “TEFP,” which is derived from the product of “peak troponin I level” and echocardiographically derived acute “LVEF.” We thus sought to evaluate the utility of TEFP in distinguishing between SC and STEMI in critically ill hospitalized patients.
Methods
After obtaining approval from the institutional review board, we retrospectively reviewed 76 consecutive cases at our institution (from July 2006 through June 2012) with acute coronary syndromes, in whom coronary angiography demonstrated nonobstructive coronary disease and in whom a diagnosis SC was made. We also reviewed 80 consecutives cases of angiographically confirmed STEMI due to coronary occlusion during the same period, starting in July 2006. The demographic data, medical history, cardiac biomarkers, 12-lead electrocardiogram, echocardiogram, coronary angiogram, and ventriculogram findings were reviewed. All patients from both groups had to have at least 2 samples of troponin I measured 8 to 12 hours apart and checked within 24 hours from onset of symptoms or electrocardiographic abnormality. The peak troponin I level and the baseline acute echocardiographically derived LVEF was used for the product calculation. An echocardiogram of good technical quality obtained within 24 hours of syndrome onset had to be available to be reviewed, to allow the use of the biplane Simpsons’ method to assess LVEF. Also, they had to have a follow-up echocardiography to reassess LVEF recovery. The peak troponin I level and the echocardiographically derived LVEF was used for the TEFP calculation. A follow-up echocardiogram within 1 month was also required in all patients with SC to reassess LVEF recovery.
The selected patients with SC satisfied the Mayo Clinic criteria for the diagnosis of SC as follows: (1) transient akinesia or dyskinesia in the left ventricular apical and midventricular segments with regional wall motion abnormalities extending beyond a single epicardial vascular distribution; (2) the absence of obstructive coronary disease or angiographic evidence of an acute plaque rupture; (3) new electrocardiographic abnormalities (either ST-segment elevation or T-wave inversion); and (4) the absence of recent significant head trauma, intracranial bleeding, pheochromocytoma, obstructive epicardial coronary artery disease, myocarditis, or hypertrophic cardiomyopathy. We excluded patients with intermediate obstructive coronary artery disease (as determined by angiographic evidence of >50% diameter stenosis in at least one of the epicardial vessel that was associated with the affected wall motion abnormality), patients with persistent wall motion abnormalities, and patients without a follow-up echocardiogram to reassess left ventricular function reversibility of the wall motion abnormalities. The control group included the patients with ST-segment elevation on the electrocardiogram and whose coronary angiogram showed total occlusion (Thrombolysis In Myocardial Infarction 0 or 1 flow) of at least 1 epicardial coronary artery, with Thrombolysis In Myocardial Infarction 0 or 1 flow in that subtending the corresponding myocardial territory, and those who underwent successful primary percutaneous coronary intervention and revascularization in the same procedure. Patients deemed by the operator to have chronic total occlusion or the patients whose culprit-occluded vessel could not be revascularized were excluded.
Echocardiograms of all cases of SC and STEMI included in this study were independently reviewed by 2 different echocardiographers certified by the National Board of Echocardiography (F.O.N and O.S), and the LVEF was calculated using the biplane Simpson’s method, from orthogonal 2-chamber and 4-chamber apical views. When the LVEF differed by >5% between the 2 assessors, the case was reviewed and a consensus was established.
Continuous variables were analyzed using Student t test and are presented as mean ± 1 SD. The categorical data are presented as percentages and frequencies and were analyzed using the chi-square test. A p value of <0.05 was considered to be significant. The variable analyzed was defined as the product of the peak troponin level multiplied by the LVEF (troponin × ejection fraction product—TEFP). Corresponding receiver operating characteristic (ROC) curves were plotted for the TEFP and peak troponin level. Then, the optimal discriminating threshold of TEFP value was determined. The sensitivity, specificity, negative predictive value, positive predictive value, and accuracy were calculated as well. All statistical analyses were performed using SPSS, version 17 (SPSS Institute, Chicago, Illinois).
Results
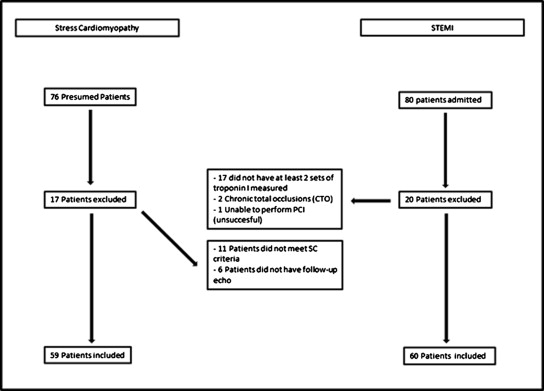
We initially evaluated 76 cases of presumed SC; of which, 17 were excluded because of not meeting inclusion criteria or for the presence of at least 1 exclusion criterion. Therefore, we analyzed 59 consecutive cases of definite SC. In the STEMI group, 80 consecutive cases were initially reviewed, but 20 did not satisfy the inclusion and/or exclusion criteria and were excluded from the analysis ( Figure 1 ). The final study population thus consisted of 59 patients with SC and 60 patients with true STEMI.

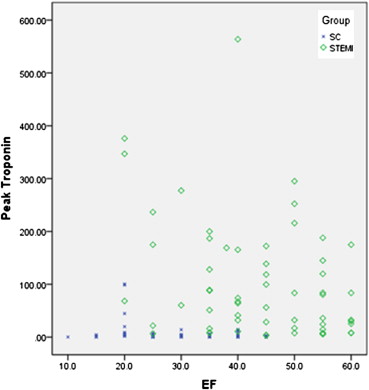
Patient characteristics are listed in Table 1 . The peak troponin I level was 7.6 ± 18 ng/dl in the SC group, which is significantly lower than the 102.2 ± 110.3 ng/dl in the STEMI group (p <0.001). The SC group had a lower LVEF than the STEMI group (30 ± 9% vs 44 ± 11%, p <0.001). After a mean follow-up duration of 10 days, the LVEF of SC group improved significantly from 30 ± 9% to 56 ± 9% (p <0.001). The peak troponin I level (ng/dl) was multiplied by the echocardiographically derived acute LVEF (%); the troponin-LVEF product (TEFP) was calculated for the SC and the STEMI groups and then compared. The mean TEFP was 182 ± 380 and 4,088 ± 4,244, respectively, for SC and STEMI groups (p <0.001). A scatter plot ( Figure 2 ) of peak troponin levels versus LVEF demonstrated the different distributions of the 2 groups of patients with SC and those with STEMI. The ROC curves of TEFP ( Figure 3 ) and peak troponin levels were plotted to determine the optimum cut-off value where to separate the patients with SC and patients with STEMI. The areas under the ROC curves (C-statistic) were 0.91 ± 0.02, p <0.001 for TEFP and 0.81 ± 0.03, p <0.001 for peak troponin level. The comparison between both ROC curves showed significant difference in those parameters (p <0.01; Figure 4 ). At a TEFP value ≥250, STEMI can be discriminated from SC with a sensitivity of 95%, a specificity of 87%, a negative predictive value of 94%, a positive predictive value of 88%, and an overall accuracy of 91% ( Table 2 ).
| Characteristic | STEMI (n = 60) | SC (n = 59) | p |
|---|---|---|---|
| Age (mean ± SD) | 62 ± 16 | 74 ± 27 | <0.001 |
| Women (%) | 17 (31) | 37 (63) | <0.001 |
| Peak troponin I (ng/dl) | 102.2 ± 110.3 | 7.6 ± 18.7 | <0.001 |
| LVEF (%) | 44 ± 11 | 30 ± 9 | <0.001 |
| TEFP | 4,088 ± 4,244 | 182 ± 380 | <0.001 |


