Noninvasive imaging that provides anatomic information while excluding intracardiac thrombus would be of significant clinical value for patients referred for catheter ablation of atrial fibrillation (AF). This study assessed the diagnostic performance of a dual-enhancement single-phase cardiac computed tomography (CT) protocol for thrombus and circulatory stasis detection in AF patients before catheter ablation. We studied 101 consecutive symptomatic AF patients (71 men and 30 women; mean age, 61.8 years) who were scheduled to have catheter ablation. All patients had undergone pre-AF ablation CT imaging and transesophageal echocardiography on the same day. CT was performed with prospective electrocardiographic gating, and scanning began 180 seconds after the test bolus. Mean left atrial appendage (LAA)/ascending aorta Hounsfield unit (HU) ratios were measured on CT images. Among the 101 patients, 9 thrombi and 18 spontaneous echo contrasts were detected by transesophageal echocardiography. The overall sensitivity, specificity, positive predictive value, and negative predictive value of CT for the detection of thrombi in the LAA were 89%, 100%, 100%, and 99%, respectively. The mean LAA/ascending aorta HU ratios were significantly different between thrombus and circulatory stasis (0.17 vs 0.33, p = 0.002). Dual-enhancement single-scan cardiac CT is a sensitive modality for detecting and differentiating LAA thrombus and circulatory stasis.
Computed tomography (CT) is a widely available and reproducible imaging technique that can quickly, accurately, and noninvasively determine pulmonary vein and left atrium (LA) anatomy. In addition, CT allows excellent visualization of left atrial appendage (LAA) and might be useful for excluding LAA thrombus. Although CT is a sensitive modality for detecting intracardiac thrombus, CT can result in false-positive findings, such as circulatory stasis, which is also seen as a filling defect on CT images. CT cannot visually distinguish every case of circulatory stasis from definite thrombus, resulting in reduced specificity. In most cases, both CT and transesophageal echocardiography (TEE) are used to obtain the anatomy of the LA and pulmonary vein and to exclude the presence of thrombus in the LA or LAA. We developed a dual-enhancement single-phase cardiac CT protocol to detect and differentiate intracardiac thrombus and circulatory stasis, while simultaneously evaluating pulmonary vein and LA anatomy. The aim of this study was to assess the diagnostic performance of a dual-enhancement single-phase cardiac CT protocol for LAA thrombus and spontaneous echo contrast (SEC) detection in atrial fibrillation (AF) patients before catheter ablation using TEE as a standard reference.
Methods
Our institutional review board approved this study, and patients provided informed consent. From March 2010 to December 2011, 117 consecutive patients who were scheduled for catheter ablation for symptomatic AF were prospectively enrolled in this study. Patients were excluded if they failed to perform TEE (n = 3), had contrast agent allergy or renal dysfunction (n = 2), or refused to provide written informed consent (n = 11). Finally, the study included 101 patients with symptomatic AF who planned to perform catheter ablation and underwent pre-AF ablation imaging. Before catheter ablation, all patients underwent TEE and CT examinations on the same day. The study consisted of 71 men and 30 women, aged from 35 to 81 years (mean age, 61.8 years). Baseline clinical characteristics, including systemic hypertension, diabetes mellitus, previous cerebrovascular accident, and smoking habits, were determined from medical records and routine laboratory data.
Cardiac CT scans were performed with a second-generation dual-source CT scanner (Somatom Definition Flash; Siemens Medical Solutions, Erlangen, Germany) in the craniocaudal direction during a single breathhold. Scanning was performed with the second injection of contrast agent, 180 seconds after injection of the first bolus of contrast agent. The double injection protocol was performed to differentiate between thrombus and circulatory stasis. Because it is difficult to differentiate LAA thrombus from circulatory stasis during the first contrast pass, we hypothesized that a double injection of contrast might be able to delineate these 2 phenomena with greater certainty because a thrombus and circulatory stasis would have a different attenuation density on delayed phase scanning due to the contrast enhancement of the first contrast bolus. No beta blockers were used for regulation of heart rate in any of the enrollees. The mean heart rate was 64 ± 16 beats/min (range 46 to 106 beats/min) during the CT examination. In each patient, a test bolus technique was used before image. For test bolus scans (first bolus), 50 ml of iodixanol, a nonionic contrast agent (320 iodine mg/ml, Visipaque; GE Healthcare, Cork, Ireland), was administered using a power injector (Envision CT, Medrad, Warrendale, Pennsylvania) at a rate of 5 ml/s via an 18-gauge needle placed into the right antecubital vein. Following contrast agent administration, 50 ml of saline was administered at a flow rate of 5 ml/sec through the same venous access. A region of interest was plotted inside the ascending aorta and a bolus geometry curve was acquired. Curve diagrams were analyzed immediately after acquisition, and the time to maximum enhancement was measured to determine the optimal scan delay. The scan began 180 seconds after the end of the test bolus scan using prospective electrocardiographic gating. The second bolus 70 ml iodixanol (320 iodine mg/ml, Visipaque; GE Healthcare) followed by a 50-ml saline solution, was administered intravenously at a rate of 5 ml/s using a power injector (Envision CT). The time to maximum enhancement determined using test bolus method was used for the optimal scan delay. The scan parameters were as follows: detector collimation, 2 × 64 × 0.6 mm; slice acquisition, 2 × 128 × 0.6 mm by means of a z-flying focal spot; gantry rotation time, 280 milliseconds; tube voltage, 100 to 120 kV; tube current, 280 to 380 mAs; and pitch, 0.2 to 0.43 adapted to the heart rate. Tube voltage and tube current were chosen depending on the patient’s body mass index. All prospectively electrocardiographic-triggered studies were centered at 70% of the R-R interval.
Images were reconstructed with a slice thickness of 0.6 mm and a reconstruction increment of 0.4 mm using a soft-tissue convolution kernel (B36f). Radiation exposure was estimated from the dose-length product. The calculated mean radiation dose was 4.11 mSv (dose-length product range, 118 to 479 mGy * cm) depending on the scan range and the patient’s body weight.
TEE was performed with a 5-MHz multiplane probe positioned at the appropriate level within the esophagus. For each patient, all images were recorded on digital video in real time for display and evaluation. Multiple standard tomographic planes were imaged, and the LAA emptying velocity, presence of LA or LAA thrombi, and severity of LA SEC were determined. SEC was characterized by dynamic clouds of echoes curling slowly in a circular or spiral shape within the LAA cavity. SEC severity was divided into 4 grades based on appearance and density using a 5-MHz transducer: none, mild, moderate, and severe.
The image quality of all of the cardiac CT and TEE examinations was considered acceptable for the evaluation of intracardiac abnormalities. Two experienced radiologists prospectively and independently reviewed the CT images of the 101 patients. Disagreement was resolved by a joint reading. Each reader was blinded to the results of other examinations and clinical data.
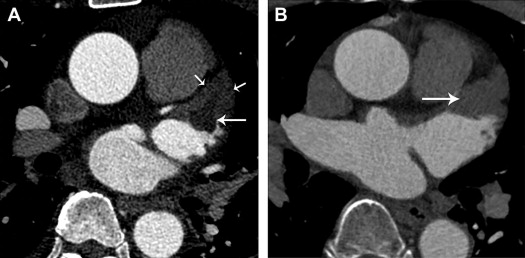
A thrombus was defined as a filling defect that appeared as an oval or round shape on CT images. Circulatory stasis was defined as a filling defect that appeared as a triangular shape in the LAA with homogeneous attenuation on CT images ( Figure 1 ).
For quantitative analysis, the LAA/ascending aorta (AA) Hounsfield unit (HU) ratio on CT images was calculated for thrombus and SEC. Regions of interest of approximately 10 mm 2 (range, 5 to 18 mm 2 ) were placed inside the filling defect in the LAA seen on CT images and the AA of the same slice to generate an LAA/AA HU ratio. CT density was independently measured at 2 selected points in HU by 2 radiologists, and the mean LAA/AA HU ratio was used for analysis.
Two experienced cardiologists prospectively and independently reviewed the TEE images of the 101 patients and graded the SEC severity. Disagreement was resolved by a joint reading.
Categorical baseline characteristics were expressed as numbers and percentages and were compared between patients with and without thrombus or SEC by means of the chi-square test. Continuous variables were expressed as mean and standard deviation and were compared with Student’s t test for independent samples. Using TEE as the reference standard, sensitivity, specificity, accuracy, positive predictive value (PPV), and negative predictive value (NPV) of CT for detecting LAA thrombi and SEC were calculated; 95% confidence intervals (CIs) were calculated using the method of exact binomial tail areas. Sensitivity, specificity, and accuracy of CT for detecting LAA thrombi were calculated and compared between the low/intermediate risk of stroke (patients with CHADS 2 [Congestive heart failure, Hypertension, Age >75 years, Diabetes, and prior Stroke] score of 0 or 1) and the high risk of stroke (patients with CHADS 2 score ≥2) groups using Fisher’s exact test. The agreement between the detection of thrombi and SEC with CT and TEE was assessed with κ statistics. The statistical significance of differences in mean LAA HU and LAA/AA HU between thrombus and SEC as measured by CT were assessed using the Student’s t test. The statistical significance of differences in the mean LAA/AA HU of thrombus and SEC according to different grades determined by TEE was assessed with the Scheffe method. The correlation between the LAA/AA HU ratio and the LAA emptying velocity determined by TEE was assessed. Pearson’s correlation was used to determine the correlation of the mean CT density ratio values between the 2 observers. Receiver operating characteristics curves were constructed using the HU ratios, and the best cut-off value was determined for the differentiation between thrombus and circulatory stasis. p values <0.05 were considered statistically significant. All statistical analyses were performed with SPSS software (Version 18.0; Statistical Package for the Social Sciences, Chicago, Illinois).
Results
The clinical characteristics of the 101 patients are summarized in Table 1 . Except for an incidence of persistent AF, patients with and without LAA filling defects did not have significantly different clinical characteristics. Fifty-six patients (55%) had AF during cardiac CT and TEE examinations. Of 101 patients, 34 patients had CHADS 2 score of 0, 41 patients had CHADS 2 score of 1, and 26 patients had CHADS 2 score ≥2.
| Characteristics | LAA Filling Defect (n = 27) | No Thrombus (n = 74) | p Value |
|---|---|---|---|
| Age, mean ± 1 SD, yrs | 65.1 ± 10.4 | 60.3 ± 11.6 | 0.061 |
| Male | 19 (70%) | 52 (70%) | 0.813 |
| Mean ejection fraction | 62.3 ± 7.6 | 59.7 ± 9.1 | 0.409 |
| Persistent AF | 26 (96%) | 50 (68%) | 0.006 |
| Paroxysmal AF | 1 (4%) | 24 (32%) | |
| Anticoagulation therapy | 21 (78%) | 63 (85%) | 0.891 |
| Antiplatelet therapy | 8 (30%) | 13 (18%) | 0.296 |
| Hypertension | 17 (63%) | 36 (49%) | 0.294 |
| Diabetes mellitus | 6 (22%) | 8 (11%) | 0.252 |
| Smoker | 14 (51%) | 36 (49%) | 0.871 |
| Previous CVA/TIA | 3 (11%) | 4 (5%) | 0.577 |
| LV dysfunction/CHF | 1 (4%) | 2 (3%) | 0.955 |
| Mean CHADS 2 score | 1.08 ± 1.11 | 0.72 ± 0.78 | 0.071 |
Of 101 patients, there were 9 thrombi and 18 SEC without thrombus on TEE. All thrombi were located in the LAA. CT detected 27 filling defects in the LAA. All thrombi and SEC were clearly detected by CT. Of the 27 lesions, 8 filling defects were diagnosed as thrombi combined with circulatory stasis, and 19 were diagnosed as circulatory stasis without thrombus ( Figures 2 and 3 ). One fresh thrombus diagnosed on TEE was misdiagnosed as circulatory stasis by CT. Using TEE as the reference standard, the overall sensitivity, specificity, accuracy, PPV, and NPV of CT for thrombi detection in the LAA were 89% (95% CI: 69% to 97%), 100% (95% CI: 94% to 100%), 99% (95% CI: 94% to 100%), 100% (95% CI: 60% to 99%) and 99% (95% CI: 92% to 100%), respectively. However, the overall sensitivity, specificity, accuracy, PPV, and NPV of CT for the detection of thrombi and circulatory stasis in the LAA were 100% (95% CI: 83% to 100%), 100% (95% CI: 93% to 100%), 100% (95% CI: 95% to 100%), 100% (95% CI: 83% to 100%) and 100% (95% CI: 93% to 100%), respectively.
Of 75 patients categorized as being of low to intermediate risk of stroke, there were 4 thrombi and 8 SEC on TEE. One fresh thrombus diagnosed on TEE was misdiagnosed as circulatory stasis by CT. In the 26 patients at high risk of stroke, 5 thrombi and 10 SEC were correctly diagnosed by CT. However, the sensitivity, specificity, and accuracy of CT for the detection of thrombi between the low/intermediate-risk and high-risk groups were not statistically significant (p = 0.444, p >0.05, and p >0.05, respectively; Table 2 ).


