The plasma level of the inflammatory biomarker soluble urokinase plasminogen activator receptor (suPAR) is an independent predictor of cardiovascular disease and all-cause mortality in healthy subjects. The prognostic capability of suPAR, its temporal course, and its relation to plasma C-reactive protein (CRP) in patients with ST-segment elevation myocardial infarction undergoing primary percutaneous intervention (PCI) is unknown. Therefore, the plasma suPAR and CRP levels were measured in 296 consecutive patients with ST-segment elevation myocardial infarction admitted for primary PCI at baseline and every 6 to 8 hours thereafter until the cardiac biomarker levels had peaked. The end points were all-cause mortality and fatal or nonfatal recurrent myocardial infarction (MI). During a median follow-up period of 5.75 years, 69 deaths and 48 nonfatal and 14 fatal recurrent MIs occurred. All-cause mortality increased significantly from 8.1% to 41.5% across increasing quartiles of suPAR levels at the end of follow-up (log-rank p <0.0001). After adjustment for other independent prognostic factors, a highly significant increase was seen in all-cause mortality (hazard ratio 1.45, 95% confidence interval, 1.19 to 1.76; p <0.001) and recurrent MI (hazard ratio 1.53, 95% confidence interval 1.16 to 2.01; p <0.01) for each standard deviation increment of suPAR levels). In contrast to plasma CRP, the suPAR levels remained stable after primary PCI. Furthermore, CRP did not predict mortality or reinfarction after adjustment for age and gender (p = 0.34). In conclusion, suPAR is a stable plasma biomarker after ST-segment elevation myocardial infarction treated with primary PCI that predicts all-cause mortality and recurrent MI.
Soluble urokinase plasminogen activator receptor (suPAR) is a newly discovered inflammatory biomarker that is an independent predictor of cardiovascular disease and mortality in the general population. In contrast to C-reactive protein (CRP), the plasma suPAR levels seem to remain relatively stable in response to acute inflammatory stimuli ; however, the temporal course and prognostic value of suPAR in patients with myocardial infarction (MI) is unknown. We, therefore, examined the prognostic value and temporal course of suPAR compared to CRP in patients with ST-segment elevation MI (STEMI) undergoing primary percutaneous intervention (PCI).
Methods
A total of 354 consecutive patients with suspected STEMI and a clinical indication for acute coronary angiography aimed at primary PCI were included in the present study from April 1, 2005 to December 31, 2005 at a single high PCI-volume tertiary invasive center in Copenhagen. The STEMI diagnosis was confirmed in 314 patients (88.7%), and from these subjects, plasma samples were available for determination of suPAR levels for 296 patients (83.6%). Information regarding clinical variables was obtained from the patient files. All patients gave written informed consent for their participation in the study. The study complied with the Declaration of Helsinki II and was approved by the local ethics committee.
The end points for the present study were all-cause mortality, recurrent MI, and a combined end point of fatal or nonfatal recurrent MI. Information about deaths was obtained from the Danish Central Civil Register, which records the vital status of all inhabitants in Denmark. Information on admissions with MI (“International Classification of Diseases” codes I21.0-I21.9) was obtained from the Danish National Hospital Register, a database of all somatic hospital admissions in Denmark.
Blood samples for analysis of biomarkers were taken at baseline and every 6 to 8 hours until the biomarkers of myocardial necrosis (troponin T and/or creatinine kinase-MB) consistently decreased (typically after 3 sequential blood samples). The samples for analysis of troponin T and creatinine kinase-MB (Roche Diagnostics, GmbH, Mannheim, Germany) were analyzed at the local clinical chemistry department. The samples for measurements of suPAR and CRP were centrifuged for 10 minutes at 3,000 rpm, and the plasma was stored at −20°C until analysis. The plasma levels of CRP and suPAR were measured from thawed samples using commercially available kits according to the manufacturer’s instructions (CRPus kit, Brahms AG, Henningsdorf, Germany; and suPARnostic kit, ViroGates, Copenhagen, Denmark). Both CRP and suPAR have previously been shown to be stable in frozen samples.
The baseline characteristics are presented as percentages for categorical variables and median values with the 5th and 95th percentiles (or range, as appropriate) for continuous variables. Differences in categorical and continuous baseline characteristics were analyzed using the chi-square test or Fisher’s exact test and general linear models, respectively. A comparison of admission levels of suPAR and CRP between those with and without the outcome events was done with the Kruskal-Wallis nonparametric test. The relation between suPAR and baseline characteristics was explored using Spearman correlation analysis. The contribution of selected variables (age, gender, diabetes, hypertension, and admission levels of plasma creatinine, CRP, total cholesterol, and troponin T) to variations in baseline suPAR levels (R 2 ) was examined using general linear models after appropriate model assessment.
The log-rank test was used to compare survival across baseline levels of suPAR divided in quartiles and presented as Kaplan-Meier survival plots. Cox proportional hazard models were used for the analysis of the relation between suPAR levels on admission and the outcome events during the follow-up period, after appropriate testing of model assumptions. If participants experienced multiple outcome events, only the first event was included. For each event, 3 models were applied to examine the role of suPAR: (1) a univariate model; (2) multivariate model 1 with adjustments for age and gender; and (3) multivariate model 2 with adjustments for any significantly contributory variable forward selected with a discriminatory p value <0.2 among the following variables: suPAR, age, gender, diabetes, hypertension, and admission levels of plasma creatinine, log-transformed CRP, total cholesterol, and troponin T. Forward selection was used to reduce the number of variables in the Cox model owing to the limited number of events during the follow-up period. Variables that were only available for a few patients (e.g., left ventricular ejection fraction) were not included in the models. The variables were selected in the following order for all-cause mortality: suPAR, age, diabetes, total cholesterol, and creatinine. For MI: suPAR, troponin T, diabetes, and creatinine. Finally, the variables were selected as follows for fatal or nonfatal MI: suPAR, diabetes, troponin T, age, and creatinine. The predictive performances of these models were summarized using the improvement in C-statistics according to Uno et al. Model fit was tested using the Grønnesby-Borgan statistic. Net reclassification improvement was assessed based on continuous net reclassification improvement. The expected number of events and nonevents was used in the estimation of net reclassification improvement to account for censored data and calculated by multiplying the total number of subjects by the Kaplan-Meier rates at the end of follow-up. This approach was found optimal for assessing calibration of the survival models. We estimated the bias-corrected confidence intervals for net reclassification improvement by bootstrap resampling (1,000 replicates). Finally, we estimated the integrated discrimination improvement, which is the difference in the proportion of variance explained by the expanded and traditional models.
All statistical tests were 2-sided, and significance was concluded for p <0.05. All analyses were performed with the Statistical Analysis System, version 9.1.3 (SAS Institute, Cary, North Carolina) or R, version 2.13.0 (R Foundation for Statistical Computing, Vienna, Austria).
Results
Baseline suPAR measurements were available from 296 patients with STEMI who underwent primary PCI. The characteristics of these patients are summarized in Table 1 . Greater levels of suPAR were significantly associated with increasing age, female gender, and high CRP and creatinine levels. On univariate analysis, the suPAR levels at baseline correlated significantly with age (r = 0.25; p <0.0001), baseline and peak CRP levels (r = 0.39 and r = 0.23; both p <0.0001), and creatinine (r = 0.22; p <0.001). Moreover, CRP correlated, among other variables, with troponin T (r = 0.33, p <0.0001).
| Variable | Total (n) | Value | suPAR Quartile | p Value | |||||||
|---|---|---|---|---|---|---|---|---|---|---|---|
| 1st (1.48–3.36 ng/mL) | 2nd (3.36–4.04 ng/mL) | 3rd (4.04–5.15 ng/mL) | 4th (5.15–16.52 ng/mL) | ||||||||
| n | Value | n | Value | n | Value | n | Value | ||||
| Age (years) | 296 | 64 (41–85) | 74 | 59 (40–83) | 73 | 62 (42–82) | 75 | 66 (43–86) | 73 | 66 (40–86) | <0.001 |
| Men | 188 | 63.7% | 51 | 68.9% | 55 | 75.3% | 39 | 52.0% | 43 | 58.9% | 0.02 |
| Systolic blood pressure (mm Hg) | 294 | 124 (86–175) | 74 | 124.5 (85–183) | 73 | 127 (89–178) | 75 | 123 (85–172) | 71 | 122 (86–170) | 0.60 |
| Diastolic blood pressure (mm Hg) | 294 | 75 (52–102) | 74 | 77 (53–106) | 73 | 75 (53–109) | 75 | 71 (50–108) | 71 | 73 (51–94) | 0.07 |
| Ejection fraction (%) | 167 | 45 (25–60) | 43 | 50 (25–60) | 31 | 47 (30–60) | 48 | 48.5 (17–60) | 45 | 45 (20–60) | 0.42 |
| Diabetes mellitus | 294 | 13.3% | 10 | 13.5% | 8 | 11.0% | 10 | 13.3% | 11 | 15.3% | 0.90 |
| Hypertension | 294 | 37.8% | 24 | 32.4% | 31 | 42.5% | 31 | 41.3% | 25 | 34.7% | 0.27 |
| Current smoker | 294 | 53.4% | 32 | 43.2% | 40 | 54.8% | 45 | 60.0% | 40 | 55.6% | 0.79 |
| Previous myocardial infarction | 294 | 11.6% | 6 | 8.1% | 7 | 9.6% | 10 | 13.3% | 11 | 15.3% | 0.52 |
| Previous congestive heart failure | 294 | 3.7% | 2 | 2.7% | 0 | 0% | 5 | 6.7% | 4 | 5.6% | 0.09 |
| Soluble urokinase plasminogen activator receptor (ng/mL) | |||||||||||
| Baseline | 295 | 4.04 (2.31–7.52) | 74 | 2.81 (1.82–3.33) | 73 | 3.69 (3.37–4.02) | 75 | 4.55 (4.09–5.11) | 73 | 5.91 (5.26–11.4) | <0.0001 |
| Peak | 296 | 4.65 (2.75–8.37) | 74 | 3.34 (2.22–5.37) | 73 | 4.00 (3.51–5.50) | 75 | 4.87 (4.23–6.77) | 73 | 6.33 (5.33–11.5) | <0.0001 |
| C-reactive protein (mg/L) | |||||||||||
| Baseline | 288 | 5.00 (0.60–68) | 74 | 2.10 (0.40–30) | 70 | 5.0 (0.50–60) | 75 | 5.5 (0.70–56) | 69 | 10.0 (1.20–160) | <0.0001 |
| Peak | 296 | 23.25 (1.6–160) | 74 | 15.2 (0.7–5.37) | 73 | 22.1 (2.5–132) | 75 | 22.6 (1.7–134) | 73 | 39.8 (2.8–184) | <0.001 |
| Total cholesterol (mM) | 285 | 4.90 (3.2–6.6) | 74 | 5.0 (3.4–6.7) | 69 | 5.0 (3.6–6.6) | 72 | 4.8 (3.2–6.6) | 69 | 4.9 (2.6–7.2) | 0.51 |
| Low-density lipoprotein cholesterol (mM) | 283 | 3.40 (1.50–5.20) | 74 | 3.5 (1.5–5.1) | 68 | 3.65 (2.1–5.1) | 71 | 3.3 (1.7–5.2) | 69 | 3.4 (1.4–5.6) | 0.45 |
| High-density lipoprotein cholesterol (mM) | 281 | 1.30 (0.80–2.10) | 73 | 1.4 (0.9–2.1) | 67 | 1.30 (0.8–2.0) | 71 | 1.3 (0.8–2.2) | 69 | 1.3 (0.7–2.0) | 0.27 |
| Triglycerides (mM) | 283 | 0.73 (0.33–2.43) | 74 | 0.73 (0.34–2.41) | 68 | 0.68 (0.29–2.14) | 71 | 0.62 (0.34–2.52) | 69 | 0.95 (0.34–2.73) | 0.41 |
| Creatinine (μM) | 296 | 73 (50–149) | 74 | 70 (50–97) | 73 | 70 (50–116) | 75 | 74 (49–179) | 73 | 81 (54–243) | <0.01 |
| Troponin T (μg/L) | |||||||||||
| Baseline | 286 | 0.45 (0.01–9.48) | 74 | 0.38 (0.01–7.04) | 68 | 0.67 (0.01–9.95) | 73 | 0.24 (0.01–6.98) | 70 | 0.69 (0.01–13.7) | 0.32 |
| Peak | 291 | 3.54 (0.11–16.0) | 74 | 3.87 (0.08–13.2) | 71 | 3.21 (0.15–15.6) | 74 | 3.28 (0.19–16.0) | 71 | 3.86 (0.03–21.5) | 0.27 |
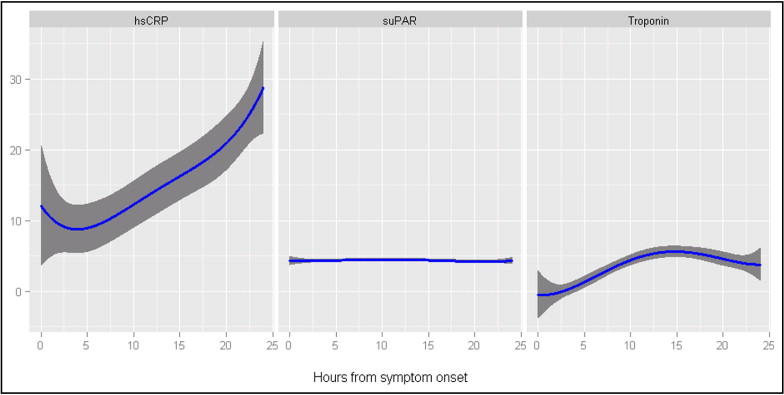
The median interval from the onset of symptoms to primary PCI was 4.0 hours (5th to 95th percentile, 1.0 to 30.5), the interval from symptom onset to baseline blood sampling was 7.4 hours (5th to 95th percentile, 2.0 to 48.4), and the interval from admission to baseline blood sampling was 0.9 hour (5th to 95th percentile, 0 to 25.4; the distribution of the mean time values was skew and therefore not reported). The number of consecutive blood samples taken during admission varied among the STEMI patients: 1 blood sample (14.4% of entire cohort), 2 samples (19.3% of entire cohort), 3 samples (24.7% of entire cohort), and ≥4 samples (41.6% of entire cohort). At baseline, the median suPAR level was 4.04 mg/L (range 1.48 to 16.52), and the median CRP level was 5.00 mg/L (range 0.30 to 272.5). The median peak suPAR level was 4.65 mg/L (range 1.48 to 16.52), and the median peak CRP level was 23.25 mg/L (range 0.30 to 279.6). The peak levels of both suPAR and CRP were significantly greater than the baseline levels (p <0.0001). The kinetics of plasma suPAR, CRP, and troponin T levels are shown in Figure 1 , clearly indicating that suPAR generally remained stable throughout the study period.
The median follow-up was 5.75 years (5th to 95th percentile, 0.1 to 6.2). During follow-up, 69 deaths occurred. Of these, 44 deaths were related to cardiovascular disease (“International Classification of Diseases” codes I00-I99), and 18 deaths occurred in patients with concomitant MI (“International Classification of Diseases” codes I21-I22). Of these, MI was stated as the primary cause of death in 14. Ten deaths were registered as related to a cancer diagnosis (“International Classification of Diseases” code C00-D48). There were 48 cases of MI, and the combined outcome of fatal or nonfatal MI occurred in 62 subjects.
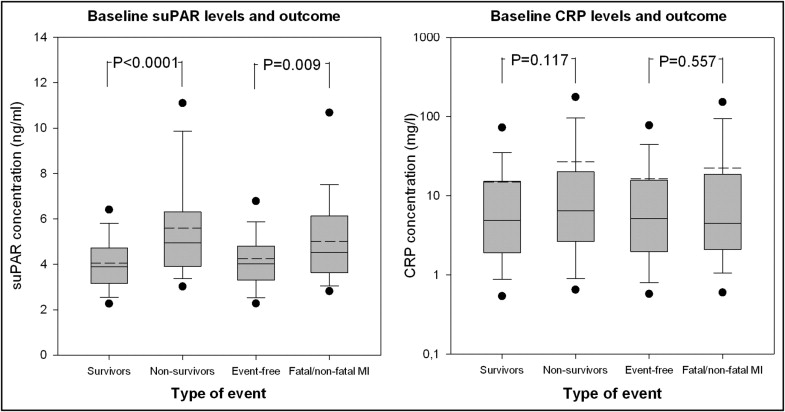
Patients who died during the follow-up period had significantly greater suPAR levels at baseline (median 4.94 mg/L, 5th to 95th percentile 3.07 to 10.84) than the surviving patients (median 3.88 mg/L, 5th to 95th percentile 2.28 to 6.36; p for difference <0.0001). No statistically significant differences were seen in the baseline CRP levels between the nonsurvivors and survivors (p for difference = 0.11; Figure 2 ). In a univariate model, the suPAR levels were significantly associated with all-cause mortality (hazard ratio [HR] 1.81, 95% confidence interval [CI] 1.54 to 2.12, per standard deviation increment in suPAR; p <0.0001), which was also the case for CRP (HR 1.28, 95% CI 1.001 to 1.63; p = 0.05). In a model adjusted for age and gender, suPAR remained strongly associated with all-cause mortality (HR 1.55, 95% CI 1.31 to 1.84; p <0.0001). Additional adjustments in a multivariate model with forward-selected variables did not considerably attenuate this relation (HR 1.45, 95% CI 1.19 to 1.76; p <0.001; Table 2 ). In addition, if the interval to PCI, previous MI, and a history of congestive heart failure were included in the variables used for forward selection, they fell short of the selected discriminatory p value and therefore were not selected for the final regression model (i.e., the prognostic strength of suPAR remained unchanged). Finally, in the subset of patients who had their left ventricular ejection fraction measured, the results were similar (data not shown). Also, a strong and graded risk of all-cause mortality was seen with increasing quartiles of suPAR (log-rank test, p <0.0001; Figure 3 and Table 3 ). This relation remained significant after adjustments for age and gender (p = 0.04; data not shown). With respect to CRP, no significant association with mortality was seen after adjustments for age and gender (p = 0.34).
| Outcome | Univariate Model | Multivariate Model 1 | Multivariate Model 2 | |||
|---|---|---|---|---|---|---|
| HR (95% CI) | p Value | HR (95% CI) | p Value | HR (95% CI) | p Value | |
| All-cause mortality | 1.81 (1.54–2.12) | <0.0001 | 1.55 (1.31–1.84) | <0.0001 | 1.45 (1.19–1.76) | <0.001 |
| Myocardial infarction | 1.59 (1.25–2.03) | <0.001 | 1.55 (1.20–2.01) | <0.001 | 1.53 (1.16–2.01) | <0.01 |
| Fatal or nonfatal myocardial infarction | 1.52 (1.24–1.86) | <0.0001 | 1.38 (1.11–1.71) | <0.01 | 1.34 (1.05–1.70) | 0.02 |
Stay updated, free articles. Join our Telegram channel

Full access? Get Clinical Tree


