Progressive left ventricular (LV) dysfunction induces expression of the cytokine transforming growth factor-β1. Endoglin (CD105) is a transforming growth factor-β1 co-receptor that is released into the circulation as soluble endoglin (sEng). The objective of the present study was to assess the serum levels of sEng in patients with heart failure and to identify the predictive value of sEng for detecting elevated left ventricular end-diastolic pressures (LVEDPs). We measured the sEng levels in 82 consecutive patients with suspected LV dysfunction referred for determination of left heart filling pressures using cardiac catheterization. Among these subjects, the sEng levels correlated with the LVEDP (R = 0.689; p <0.0001), irrespective of the LV ejection fraction. Using a receiving operating characteristic curve, the sEng levels predicted an LVEDP of ≥16 mm Hg with an area under the curve of 0.85, exceeding the measured area under the curves for both atrial and brain natriuretic peptide, currently used biomarkers for heart failure diagnosis (atrial natriuretic peptide 0.68 and brain natriuretic peptide 0.65; p <0.01 vs sEng). In 10 subjects receiving medical therapy guided by invasive hemodynamic monitoring for heart failure, decreased a pulmonary capillary wedge pressure was associated with a reduced sEng level (R = 0.75, p = 0.008). Finally, compared to 25 healthy controls, the sEng levels were elevated in subjects with suspected LV dysfunction (3,589 ± 588 vs 4,257 ± 966 pg/ml, respectively, p <0.005) and correlated directly with the New York Heart Association class (R = 0.501, p<0.001). In conclusion, circulating levels of sEng are elevated in patients with increased LVEDP and New York Heart Association class, irrespective of the LV ejection fraction. sEng levels also decreased in association with a reduced cardiac filling pressure after diuresis. These findings have identified circulating sEng as a sensitive measure of elevated left heart filling pressures.
Endoglin (CD105) is a 180-kDA type III transforming growth factor-β1 co-receptor that promotes binding of transforming growth factor-β1 and transforming growth factor-β3 to a type II transforming growth factor-β receptor. In vascular tissue, endoglin modulates downstream transforming growth factor-β1 signaling and regulates vascular tone. In cardiac tissue, endoglin is expressed by endothelial cells, fibroblasts in the connective tissue surrounding the muscular fibers, and in fibroblast-like stromal cells of valve leaflets; cardiac myocytes fail to demonstrate significant endoglin expression. Endoglin expression in patients with heart failure has not been explored. The extracellular domain of endoglin can be released into the circulation as soluble endoglin (sEng) and has been associated with the increased systemic vascular resistance observed in pre-eclampsia and fibroproliferative disorders. Because progressive heart failure has been associated with increased systemic vascular resistance, increased transforming growth factor-β1 activity, and cardiac fibrosis, we postulated that sEng levels might be increased in association with elevated left ventricular (LV) filling pressure and might provide a sensitive, noninvasive measure of cardiac pressure overload. To explore this hypothesis, we prospectively measured the sEng serum levels in patients referred for cardiac catheterization because of suspected LV dysfunction. The sEng level correlated significantly with the LV filling pressure and was a more sensitive and specific predictor of cardiac pressure overload than were biomarkers such as atrial natriuretic peptide (ANP) or brain natriuretic peptide (BNP). These findings suggest that elevated levels of sEng might serve as a marker of increased LV filling pressures.
Methods
In a prospective, observational study, we enrolled 82 consecutive patients who had been referred for evaluation of suspected LV dysfunction using right- and left-sided heart catheterization, regardless of the LV ejection fraction, at Tufts Medical Center (Boston, Massachusetts). Those patients <18 years old and those presenting with acute coronary syndrome, pregnancy, active or remote cancer, renal failure (estimated glomerular filtration rate ≤30 ml/min/1.73 m 2 ), liver transaminases ≥2 times the upper limit of normal, nonsinus rhythm, or perceived interference with standard clinical care were excluded. All eligible patients who agreed to enroll had their blood sampled at arterial sheath insertion for diagnostic catheterization. The LV ejection fraction (LVEF) was assessed using echocardiography or ventriculography at catheterization. Data from the medical records and the results from other blood tests were collected for subsequent analysis using SigmaStat, version 3.1, software (Jandel Corporation, Erhrath, Germany). To study whether the sEng levels reflected diuresis-induced reductions in the cardiac filling pressure during medical therapy for heart failure, we enrolled 10 patients with systolic heart failure, as defined by a pulmonary capillary wedge pressure of ≥16 mm Hg and LVEF of <50%. These patients had had follow-up pulmonary artery catheter measurements deemed clinically necessary for hemodynamic monitoring after in-patient diuretic therapy. The same listed exclusion criteria were applied to patients referred for follow-up right heart catheterization. Blood sampling was performed at the initial pulmonary artery catheter placement and 48 hours after in-patient therapy. At each point, the sEng, BNP, and ANP levels were measured. The control subjects consisted of 25 healthy volunteers with no significant medical history, no active medical problems, and no current medication use, as recorded by a screening questionnaire. The subjects were required to be 21 to 80 years old. Serum samples were obtained as a one-time laboratory draw at our clinical research center. All physicians were unaware of the results of the serum analysis. The institutional review board of Tufts Medical Center approved the present study, and all patients provided written informed consent. The blood samples were collected using serum separator tubes and allowed to clot for 30 minutes before centrifugation at 2,000 g for 15 minutes. The serum samples were immediately stored at −20°C. The human sEng, ANP, and BNP levels were measured in each serum sample in duplicate using commercially available quantitative sandwich enzyme immunoassay kits (sEng, R&D Systems, Minneapolis, Minneosta; ANP and BNP: Phoenix Pharmaceuticals, Belmont, California) according to the manufacturers’ instructions. The intra-assay and interassay coefficient of variation for each protein assay was 3% and 6% for sEng, 8% and 4% for BNP, and 11% and 5% for ANP, respectively.
All values are expressed as the mean ± SD. Differences between the mean values were detected using the Wilcoxon rank-sum test, with 2-tailed p <0.05. sEng data were normally distributed; however, because the natriuretic peptide data were not normally distributed, log BNP and log ANP were used in the correlations and regression models. Stepwise multiple regression analysis was performed to examine the predictors of LV end-diastolic pressure (LVEDP) in LV dysfunction. The variables entered into the model included age, gender, body surface area, hypertension, diabetes, hypercholesterolemia, active tobacco use, and history of myocardial infarction. Stepwise multiple regression analysis was also performed to examine biomarkers as predictors of LVEDP in all patients. The variables entered into the model included sEng, ANP, and BNP. Blockwise multiple regression analysis, using the enter method, was also done to examine sEng as a predictor of LVEDP after entering BNP, ANP, New York Heart Association class, and LVEF into a single block. Stepwise multiple regression analysis was also performed to examine the predictors of sEng. The variables entered into the model included age, gender, body surface area, hypertension, diabetes, hypercholesterolemia, active tobacco use, and history of myocardial infarction. In a separate model, medication history was examined for the prediction of sEng levels. Medications entered into the model included aspirin therapy, β blockers, angiotensin-converting enzyme inhibitors, calcium channel blockers, angiotensin receptor blockers, aldosterone antagonist, antilipidemics, and diuretics. To evaluate the value of sEng, BNP, and ANP measurements in the diagnosis of heart failure, we compared the sensitivity, specificity, and accuracy of each biomarker with the LVEDP measurements. Finally, we constructed receiver operating characteristic curves to illustrate the various cutoff values of sEng, ANP, and BNP. p Values <0.05 were considered significant. Statistical analyses were performed using SigmaStat software.
Results
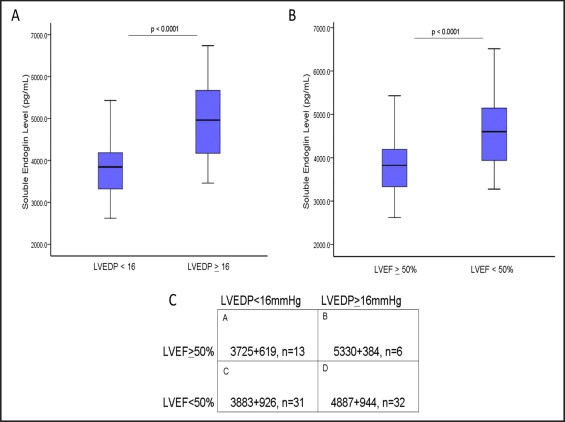
To determine whether the sEng levels correlated with LVEDP, the serum levels were measured using enzyme-linked immunosorbent assay in 82 consecutive patients referred for cardiac catheterization to evaluate the LV filling pressures, regardless of the LVEF. The clinical characteristics of the study subjects were categorized according to the LVEDP ( Table 1 ). Significant group differences were present in age, gender, prevalence of hypertension, smoking, diuretic use, creatinine, and blood urea nitrogen (p <0.05). Among the catheterization subjects, LVEDP correlated directly with LVEF (R = 0.588; r = 0.346; p <0.005). When categorized according to the LV filling pressure, patients with a LVEDP of ≥16 mm Hg had significantly greater sEng levels compared to those with a LVEDP of <16 mm Hg (p <0.001; Figure 1 ). After adjusting for these group differences in age, gender, prevalence of hypertension, smoking, diuretic use, creatinine, and blood urea nitrogen using analysis of covariance, sEng remained greater in patients with a LVEDP of ≥16 mm Hg compared to those with a LVEDP of <16 mm Hg (adjusted mean for LVEDP <16 mm Hg, 3,848 pg/ml vs 4,786 pg/ml for LVEDP of ≥16 mm Hg; p <0.001). When grouped according to LVEF, the study subjects with a low LVEF (<50%) had significantly greater sEng levels than patients with a LVEF of ≥50% (p <0.0001; Figure 1 ). The sEng levels correlated directly with elevated LVEDPs in patients with either LVEF >50% (R = 0.51, p <0.01) or LVEF <50% (R = 0.50, p <0.01). When grouped by both variables (i.e., LVEF and LVEDP), the sEng levels were significantly increased in those with elevated LVEDP >16 mm Hg, irrespective of the LVEF ( Figure 1 ), suggesting that sEng levels are also elevated in patients with cardiac pressure overload and preserved LV function.
| Variable | LVEDP (mm Hg) | |
|---|---|---|
| <16 (n = 47) | ≥16 (n = 35) | |
| Age (years) | 55 ± 15 | 61 ± 12 ⁎ |
| Men | 26 (55%) | 27 (77%) ⁎ |
| Body surface area (kg/m 2 ) | 1.97 ± 0.26 | 2.05 ± 0.20 |
| Hypertension | 37 (79%) | 18 (53%) ⁎ |
| Diabetes mellitus | 9 (19%) | 10 (29%) |
| Active smoking | 11 (23%) | 2 (6%) ⁎ |
| Peripheral vascular disease | 2 (4%) | 4 (12%) |
| Coronary disease | 13 (28%) | 15 (44%) |
| Previous myocardial infarction | 8 (17%) | 11 (32%) |
| Cerebrovascular disease | 3 (6%) | 1 (3%) |
| New York Heart Association class (scale 0–4) | 1 | 3 ⁎ |
| Left ventricular end-diastolic pressure (mm Hg) | 10 ± 2.7 | 21.6 ± 4.4 ⁎ |
| Left ventricular ejection fraction (%) | 48 ± 16 | 25 ± 16 ⁎ |
| Medications | ||
| Aspirin | 33 (70%) | 17 (50%) |
| Clopidogrel | 9 (19%) | 3 (9%) |
| β Blocker | 28 (60%) | 18 (53%) |
| Angiotensin-converting enzyme inhibitor | 18 (38%) | 13 (38%) |
| Calcium channel blocker | 5 (11%) | 3 (9%) |
| Angiotensin receptor blocker | 1 (2%) | 1 (3%) |
| Aldosterone antagonist | 3 (6%) | 7 (21%) |
| Diuretic | 14 (30%) | 20 (59%) ⁎ |
| Antidyslipidemic agent | 19 (68%) | 14 (40%) |
| Admission laboratory values | ||
| Sodium (mEq/L) | 139 ± 3 | 137 ± 3 |
| Creatinine (mg/dl) | 1.0 ± 0.8 | 1.5 ± 0.9 ⁎ |
| Blood urea nitrogen (mg/dl) | 17 ± 6 | 31 ± 18 ⁎ |
| Glucose (mg/dl) | 118 ± 30 | 131 ± 42 |
| White blood cell count (×10 cells/L) | 8.4 ± 3.3 | 8.1 ± 3.7 |
| Hemoglobin (g/dl) | 13.1 ± 1.5 | 12.6 ± 1.8 |
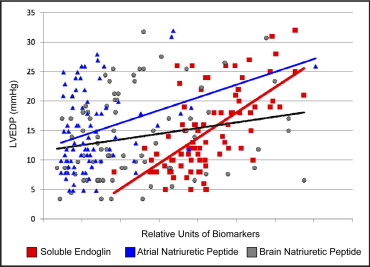
We next compared the sensitivity of the sEng levels for predicting elevated LVEDPs to that of the currently available biomarkers of heart failure, including ANP and BNP. The study subjects with an elevated LVEDP of ≥16 mm Hg exhibited increased ANP and BNP levels compared to those with a low LVEDP (ANP 48 ± 35 vs 26 ± 14 ng/mL, respectively; p = 0.01; BNP 14 ± 8 vs 10 ± 7 ng/mL, respectively, p = 0.03). Both ANP and BNP correlated directly with the New York Heart Association class (ANP, R = 0.298, p <0.01; BNP, R = 0.309, p <0.01). Among the study subjects, the ANP levels correlated significantly with both LVEDP (p <0.01) and LVEF (p <0.01), and the BNP levels correlated significantly with LVEDP (p = 0.05) but demonstrated a weaker correlation with LVEF (p = 0.09). In contrast, the sEng levels exhibited a significant correlation with increased LVEDP (p <0.001) and inverse correlation with LVEF (p <0.001; Table 2 ). Univariate regression plots for sEng, ANP, and BNP versus LVEDP are shown in Figure 2 . The sEng levels also demonstrated a significant correlation with ANP levels (R = 0.234, p = 0.03) but did not, however, correlate significantly with the BNP levels (p >0.05) among the study subjects.
| Variable | LVEDP | LVEF | ||
|---|---|---|---|---|
| R | p Value | R | p Value | |
| Atrial natriuretic peptide | 0.322 | 0.003 | −0.309 | 0.005 |
| Brain natriuretic peptide | 0.219 | 0.05 | −0.183 | 0.09 |
| Soluble endoglin | 0.628 | <0.001 | −0.399 | <0.001 |
According to the stepwise multiple regression analysis, significant demographic predictors of LVEDP included a history of diabetes, hypertension, and myocardial infarction. Overall, the model accounted for 17.7% of the variance in the LVEDP. In a separate analysis, the significant biomarker predictors of LVEDP included sEng (accounting for 39% of the variance) and ANP (accounting for an additional 3.2% of the variance; Table 3 ). Overall, the model accounted for 43% of the variance in the LVEDP. According to blockwise multiple regression analysis, a block consisting of BNP, ANP, New York Heart Association class, and LVEF accounted for 51% of the variance in the LVEDP (p <0.001). sEng accounted for a significant incremental 10% of the variance in LVEDP greater than that accounted for by these traditional predictors (p <0.001). We next examined the predictors of serum sEng levels among the study subjects. Demographic predictors of sEng included a history of hypertension (accounting for 6.4% of the variance; β = −0.646, standard error = 0.231, 95% confidence interval −1.107 to −0.185, p = 0.007) and diabetes (accounting for 5.7% of the variance; β = 0.556, standard error 0.253, 95% confidence interval 0.052 to 1.061, p = 0.031). No other co-morbidity was identified as a significant predictor of sEng levels. With respect to medication history, diuretic use was a significant predictor of sEng (accounting for 19% of the variance; β = 0.836, standard error 0.262%, 95% confidence interval 0.308 to 1.363, p = 0.003). No other medication was identified as a significant predictor of sEng. Using a receiving operating characteristic curve, the sEng levels predicted a LVEDP of ≥16 mm Hg with an area under the curve of 0.851, exceeding the predictive value of either ANP (area under the curve 0.68, p <0.01 vs sEng) or BNP (area under the curve 0.65, p <0.01 vs sEng). sEng also exhibited greater sensitivity, a greater negative predictive value, and superior accuracy compared to BNP or ANP for predicting elevated LVEDPs ( Figure 3 ).


