The value of electrocardiographic findings predicting adverse outcome in patients with arrhythmogenic right ventricular dysplasia (ARVD) is not well known. We hypothesized that ventricular depolarization and repolarization abnormalities on the 12-lead surface electrocardiogram (ECG) predict adverse outcome in patients with ARVD. ECGs of 111 patients screened for the 2010 ARVD Task Force Criteria from 3 Swiss tertiary care centers were digitized and analyzed with a digital caliper by 2 independent observers blinded to the outcome. ECGs were compared in 2 patient groups: (1) patients with major adverse cardiovascular events (MACE: a composite of cardiac death, heart transplantation, survived sudden cardiac death, ventricular fibrillation, sustained ventricular tachycardia, or arrhythmic syncope) and (2) all remaining patients. A total of 51 patients (46%) experienced MACE during a follow-up period with median of 4.6 years (interquartile range 1.8 to 10.0). Kaplan-Meier analysis revealed reduced times to MACE for patients with repolarization abnormalities according to Task Force Criteria (p = 0.009), a precordial QRS amplitude ratio (∑QRS mV V 1 to V 3 /∑QRS mV V 1 to V 6 ) of ≤0.48 (p = 0.019), and QRS fragmentation (p = 0.045). In multivariable Cox regression, a precordial QRS amplitude ratio of ≤0.48 (hazard ratio [HR] 2.92, 95% confidence interval [CI] 1.39 to 6.15, p = 0.005), inferior leads T-wave inversions (HR 2.44, 95% CI 1.15 to 5.18, p = 0.020), and QRS fragmentation (HR 2.65, 95% CI 1.1 to 6.34, p = 0.029) remained as independent predictors of MACE. In conclusion, in this multicenter, observational, long-term study, electrocardiographic findings were useful for risk stratification in patients with ARVD, with repolarization criteria, inferior leads TWI, a precordial QRS amplitude ratio of ≤0.48, and QRS fragmentation constituting valuable variables to predict adverse outcome.
Arrhythmogenic right ventricular dysplasia (ARVD) is a genetically determined cardiomyopathy characterized by fibrofatty replacement of the right ventricle (RV), which may eventually lead to ventricular arrhythmias, heart failure, and sudden cardiac death (SCD). Risk stratification in ARVD still has the potential for improvement. Particularly, noninvasive and easily obtainable tools for risk stratification are needed. Twelve-lead electrocardiography constitutes such a readily available clinical tool and plays an important role in ARVD diagnosis. However, its role for risk stratification and therapeutic decision making in ARVD remains controversial. The purpose of the present study was to identify electrocardiographic depolarization or repolarization abnormalities that predict an adverse outcome in our large cohort of patients with ARVD.
Methods
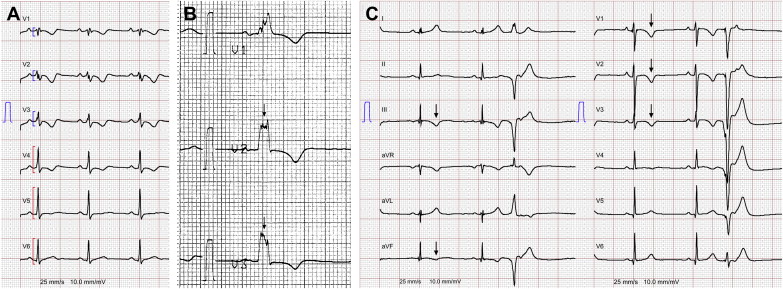
The study population included 111 patients from 3 tertiary care centers in Switzerland with a possible, borderline, or definite diagnosis of ARVD (possible diagnosis: 2 minor or 1 major criterion; borderline: 1 major and 1 minor or 3 minor criteria; and definite: 2 major, 1 major plus 2 minor, or 4 minor criteria according to the 2010 revised Task Force Criteria [TFC]), who had a 12-lead surface electrocardiogram (ECG) recorded from February 1987 to March 2013. Ninety-eight patients were index patients (probands) and 13 were family members. Clinical information regarding demographics and symptoms were obtained from hospital records at the time of the electrocardiography. This observational study was approved by the local institutional ethical committees of the participating centers. Electrocardiographic definitions used in this study are listed in Table 1 . ECGs were recorded at rest (25 mm/s, 10 mm/mV) with standard lead positions, digitized with a high-resolution scanner, and analyzed with a digital caliper (Screen Caliper, version 4.0; Iconico, www.iconico.com , New York, New York). ECGs were enlarged 4 times. Electrocardiographic intervals were measured in 2 consecutive beats in each lead, and the mean value was used. When the difference between the 2 beats was >10 ms, then the mean of 3 beats was taken. ECGs were independently analyzed by 2 experienced blinded readers. Differences in electrocardiographic interpretation were adjudicated by a third experienced reader, and a final conclusion was made by consensus. Heart rate, PR interval, QRS duration, QRS dispersion, QT interval, QT dispersion, T peak to T end duration, parietal block, and terminal activation duration (TAD) were measured according to current practice. The Bazett formula was used to correct the QT interval for heart rate. QRS fragmentation ( Figure 1 ) and peripheral low voltage were defined as previously described. We also included a recently proposed parameter termed “precordial QRS amplitude ratio” in our analysis ( Figure 1 ), which is the ratio of the sum of QRS amplitudes in V 1 to V 3 divided by the sum in V 1 to V 6 (∑QRS mV V 1 to V 3 /∑QRS mV V 1 to V 6 ), with low values reflecting lower voltages in the right precordial leads compared with the lateral precordial leads. We also evaluated the impact of inferior leads T-wave inversions (TWIs; Figure 1 ). Repolarization abnormalities according to the 2010 TFC were defined as precordial TWI in at least V 1 and V 2 (minor criterion). Follow-up for outcome data was performed by chart review, including implantable cardioverter-defibrillator interrogations, Holter ECGs, clinical visits, and from telephone interviews of patients or treating physicians. No patient was lost to follow-up. The role of electrocardiographic parameters on outcome was compared in 2 patient groups: (1) patients with major adverse cardiovascular events (MACE; “adverse outcome”); composite of cardiac death (defined as any death that occurred because of SCD or terminal congestive heart failure), heart transplantation, survived SCD, ventricular fibrillation (VF), sustained ventricular tachycardia (VT), and arrhythmogenic syncope and (2) all remaining patients (“favorable outcome”). For Kaplan-Meier estimates and Cox regression analyses, time from electrocardiography to MACE was the event of interest. Survived SCD, VF, sustained VT, and arrhythmogenic syncope were defined as previously reported. Continuous variables are presented as mean ± SD or median (with interquartile range) and were compared using a 2-sided unpaired Student t test. Categorical variables are reported as frequency (percentage) and were compared between groups by Fisher’s exact test. Cut-off points for continuous electrocardiographic variables that maximized the difference in times to MACE for patients with values lower and for those greater than the cut-off were determined by minimizing the p value (log-rank). The final p value was corrected for multiple testing. Cumulative probabilities of survival free of MACE were determined by the Kaplan-Meier method and differences in survival with the log-rank test. Baseline variables associated with MACE were identified by univariable Cox regression. Variables with a p value of <0.1 in univariable analysis were considered for the multivariable model. Patients with ARVD with a previous episode of sustained VT, VF, and/or sudden cardiac arrest have a high probability of MACE. Thus, we adjusted for this variable by performing a stratified analysis. For continuous variables, the intraclass correlation was used to quantify interobserver variability with values >0.75 representing good reliability of measurements. For nominal variables, we calculated the agreement coefficient κ, with a value of 1 indicating perfect agreement. A 2-sided p value of <0.05 was considered significant. Statistical analysis was performed using R programing language (R Development Core Team, 2009) and GraphPad Prism 5 (GraphPad Software Inc., La Jolla, California).
| Variable | Definition |
|---|---|
| Epsilon (ε) wave | Distinct waves of small amplitude that occupy the ST segment in the right precordial leads and are distinct from the QRS complex |
| TAD | Longest value in V 1 through V 3 from the nadir of the S wave to the end of all depolarization |
| TWI | Any T-wave negativity |
| Inferior leads TWI | Inverted T waves in 2 of 3 inferior leads |
| Major repolarization criteria | Definition according to 2010 TFC |
| Minor repolarization criteria | Definition according to 2010 TFC |
| Precordial QRS amplitude ratio | ∑QRS mV V 1 −V 3 /∑QRS mV V 1 –V 6 |
| Parietal block | QRSd in lead V 1 through V 3 that exceeds the QRSd in lead V 6 by >25 ms |
| Fragmented QRS | Additional deflections/notches at the beginning of the QRS, on top of the R wave, or in the nadir of the S wave in either ≥1 right precordial lead or in >1 lead including all remaining leads |
| Peripheral low voltage | QRS amplitude ≤5 mm (0.5 mV) in each peripheral lead |
| QRS dispersion | Difference between the longest and shortest QRS durations in all leads |
| QT dispersion | Difference between the longest and shortest uncorrected QT intervals in all leads |
| Precordial T peak –T end interval | Difference of the interval of the Q wave to the end of the T wave (QT end ) and the interval of the Q wave to the peak of the T wave (QT peak ) measured in the precordial leads, representing a surrogate marker of the transmural dispersion of repolarization |
| Precordial T peak –T end dispersion | Difference between the longest and shortest precordial T peak –T end interval |
| Complete right bundle branch block | QRSd ≥120 ms and |
| A1: R′ or r′ in V 1 or V 2 | |
| A2: S duration > R duration in I and V 6 | |
| A3: S duration >40 ms in I and V 6 | |
| A4: R peak time >50 ms in V 1 or V 2 | |
| a: A1 + A2 | |
| b: A1 + A3 | |
| c: A4 + (A2 or A3) | |
| Incomplete right bundle branch block | QRS <120 ms and R peak time in V 1 or V 2 >50 ms |
| R or r′ in V 1 /V 2 | A positive deflection in V 1 /V 2 after an S wave |
Results
ECGs were available for all patients. Patient demographic data, baseline characteristics, and ECG variables are summarized in Tables 2 and 3 . ARVD was classified as definite in 80 patients (72%), borderline in 15 patients (14%), and possible in 16 patients (14%). Eleven of 16 patients (69%) with a possible diagnosis were family members. Index cases with possible ARVD fulfilled 1 major (n = 1) or 2 minor criteria (n = 4). Two of those patients had suspected family disease, and 1 patient had RV scar identified by electroanatomic voltage mapping. After study inclusion, during a follow-up with median of 4.6 years (interquartile range 1.8 to 10), 51 patients (46%) experienced MACE ( Table 4 ). Median time from study inclusion to MACE was 12 months (interquartile range 4.1 to 36). At last follow-up, 108 patients (97%) were alive. Three patients died from cardiac causes (2 because of terminal congestive heart failure and 1 because of incessant VT), and cardiac transplantation was performed in 4 patients (3 because of terminal congestive heart failure and 1 because of repetitive uncontrollable implantable cardioverter-defibrillator shocks). Histology of all 4 explanted hearts showed extensive fibrofatty infiltration within the RV myocardium and the posterolateral aspect of the left ventricle (LV). There was no evidence of myocarditis or superimposed inflammatory phenomena in any of those cases. Analysis of times to MACE showed that the presence of precordial repolarization abnormalities according to the 2010 TFC, a precordial QRS amplitude ratio of ≤0.48, and QRS fragmentation were associated with significantly reduced times to MACE ( Figure 2 ). Detailed data for the 2 subgroups with (n = 52) and without (n = 59) SCD, VF, and/or sustained VT before study inclusion are visualized by the stratified Kaplan-Meier plots. In general, times to MACE were longer in patients without previous SCD, VF, and/or sustained VT. After stratification for this observation, TWI in ≥2 precordial leads and QRS fragmentation were significantly associated with shorter survival, also in the subgroup of patients considered for primary prophylactic implantable cardioverter-defibrillator implantation ( Figure 2 ). The number of precordial leads with TWI was significantly associated with MACE (≤3 leads vs >3, p = 0.017). On the contrary, presence of depolarization abnormalities, parietal block, peripheral low voltage, QT prolongation, prolonged QRS, QT and/or T peak to T end dispersion, and T peak to T end interval prolongation did not significantly alter times to MACE. Precordial repolarization criteria, a precordial QRS amplitude ratio of ≤0.48, TWI in >3 precordial leads, QRS fragmentation, and inferior leads TWI were identified as univariable predictors of MACE also in the Cox model ( Table 5 ). In multivariable analysis starting with these univariable predictors, a precordial QRS amplitude ratio of ≤0.48 (hazard ratio [HR] 2.92, 95% confidence interval [CI] 1.39 to 6.15, p = 0.005), inferior leads TWI (HR 2.44, 95% CI 1.15 to 5.18, p = 0.02), and QRS fragmentation (HR 2.65, 95% CI 1.1 to 6.34, p = 0.029) remained as the only independent predictors of MACE. Separate analyses excluding 5 index patients with possible ARVD yielded similar results ( Table 5 ). In this subpopulation of 106 patients, multivariable analysis showed the following results: HR 3.45 (95% CI 1.54 to 7.74, p = 0.003) for precordial QRS amplitude ratio ≤0.48; HR 2.65 (95% CI 1.22 to 5.74, p = 0.014) for inferior leads TWI; and HR 2.31 (95% CI 0.94 to 5.67, p = 0.067) for QRS fragmentation. Kaplan-Meier subanalyses for patients with definite and borderline ARVD without previous SCD, VF, and/or sustained VT also demonstrated significantly lower survival in the presence of precordial repolarization criteria and QRS fragmentation ( Figure 2 ). In this same subpopulation, Cox regression identified the presence of QRS fragmentation (HR 4.44, 95% CI 1.52 to 12.95, p = 0.006) and precordial repolarization criteria (HR 4.4, 95% CI 1.17 to 16.56, p = 0.029) as univariable predictors of MACE. The low number of MACE (n = 15) in this subpopulation did not allow for multivariable analysis. The estimated intraclass correlation was 0.9 (95% CI 0.74 to 0.94) for precordial QRS amplitude ratio (κ of 0.94 [95% CI 0.85 to 1.0]) for the cutoff ≤0.48. Interobserver correlations were higher for repolarization than for depolarization abnormalities (κ = 0.89 [95% CI 0.8 to 0.97] for repolarization criteria and κ = 0.95 [95% CI 0.9 to 1.0] for inferior leads TWI, compared with κ = 0.5 [95% CI 0.33 to 0.66] for QRS fragmentation, κ = 0.49 [95% CI 0.25 to 0.69] for ε waves in leads V 1 to V 3 , κ = 0.38 [95% CI 0.07 to 0.6] for ε waves in lead V 1 , κ = 0.36 [95% CI 0.03 to 0.7] for ε waves in lead V 2 , κ = 0.24 [95% CI −0.06 to 0.6] for ε waves in lead V 3 , and κ = 0.57 [95% CI 0.42 to 0.69] for the presence of TAD ≥55 ms).
| Characteristic | All Patients (n = 111) | MACE (n = 51) | Favorable (n = 60) | p Value |
|---|---|---|---|---|
| Age (yrs) | 43 ± 15.4 | 46 ± 14.9 | 40 ± 15.3 | 0.03 |
| Men | 71 (64) | 33 (65) | 38 (63) | 1.00 |
| Systolic blood pressure (mm Hg) | 120 (110–129) | 120 (110–126) | 120 (110–131) | 0.12 |
| Diastolic blood pressure (mm Hg) | 76 ± 9 | 77 ± 9 | 76 ± 10 | 0.4 |
| Heart rate (beats/min) | 65 (57–75) | 63 (55–79) | 65 (57–73) | 0.39 |
| Body surface area (m 2 ) | 1.9 (1.7–2.0) | 1.9 (1.7–2.0) | 1.9 (1.7–2.0) | 0.3 |
| Body mass index (kg/m 2 ) | 24.5 (21.8–26.1) | 24.5 (21.4–26.2) | 24.3 (22.1–26.1) | 0.76 |
| LV ejection fraction <50% | 15 (14) | 12 (24) | 3 (5) | 0.005 |
| LV ejection fraction <40% | 8 (7) | 7 (14) | 1 (2) | 0.023 |
| Previous sustained VT/VF/sudden cardiac arrest | 52 (47) | 35 (69) | 17 (28) | <0.001 |
| Fractional area change <33% | 48 (43) | 35 (69) | 16 (27) | <0.001 |
| Previous syncope | 35 (32) | 24 (47) | 11 (18) | 0.016 |
| “Definite” ARVD | 80 (72) | 44 (86) | 36 (60) | 0.003 |
| Premature SCD in a first- or second-degree family member | 11 (10) | 5 (10) | 6 (10) | 1.00 |
| Amiodarone | 18 (16) | 11 (22) | 6 (10) | 0.11 |
| β Blocker | 48 (43) | 29 (57) | 18 (30) | 0.007 |
| Sotalol | 13 (12) | 7 (14) | 6 (10) | 0.57 |
| Other antiarrhythmic therapy | 9 (8) | 6 (12) | 3 (5) | 0.3 |
| Variable | All (n = 111) |
|---|---|
| Heart rate (beats/min) | 65 (57–75) |
| RR interval (seconds) | 0.92 (0.8–1.1) |
| PQ interval (ms) | 160 (144–184) |
| QRS duration (ms) | 111 (100–127) |
| QRS dispersion (ms) | 39 (28–51) |
| QT interval (ms) | 420 (392–465) |
| QT interval corrected (ms) | 443 (425–480) |
| QT dispersion (ms) | 57 (46–82) |
| Precordial QRS ratio | 0.475 ± 0.091 |
| Precordial T peak –T end interval (ms) | 96.8 (80–107.4) |
| Precordial T peak –T end dispersion (ms) | 30.8 (21–46.8) |
| TAD (ms) | 52 (43–64) |
| TAD ≥55 ms | 36 (32) |
| Minor depolarization criteria | 21 (19) |
| Major depolarization criteria (epsilon waves) | 22 (20) |
| Fragmented QRS | 42 (38) |
| Isolated late potentials in inferior leads | 4 (4) |
| Major repolarization criteria | 37 (33) |
| Minor repolarization criteria | 21 (19) |
| TWIs in ≥3 precordial leads | 32 (29) |
| Inferior leads TWI | 48 (43) |
| TWIs in ≥3 precordial leads combined with inferior leads TWI | 12 (11) |
| Complete left bundle branch block | 2 (2) |
| Complete right bundle branch block | 13 (12) |
| Left anterior fascicular block | 8 (7) |
| Incomplete right bundle branch block | 3 (3) |
| Parietal block | 13 (12) |
| Premature ventricular complexes present on 12-lead ECG | 19 (17) |
Stay updated, free articles. Join our Telegram channel

Full access? Get Clinical Tree


