The aim of this study was to evaluate the incremental value of combined assessment with computed tomographic (CT) signs of right ventricular (RV) dysfunction and cardiac troponin T level for predicting early death or adverse outcomes due to acute pulmonary embolism (PE). One hundred seventy-three non-high-risk patients with acute PE, confirmed by CT pulmonary angiography, were retrospectively evaluated. The area under the curve and hazard ratio of CT signs and troponin T levels were compared for predicting early death or adverse outcomes. Patients were classified into intermediate- and low-risk groups on the basis of CT signs and troponin T levels, and mortality was compared. Seventeen patients (9.8%) died within 3 months. Early mortality of intermediate-risk patients (14% to 19%) was higher than that of low-risk patents (2% to 6%). A ratio of RV volume to left ventricular volume > 1.5 had the highest area under the curve (0.709) and hazard ratio (5.402) for predicting early death. The combination of CT signs and elevated troponin T level had an increased area under the curve and hazard ratio for predicting early death and adverse outcomes compared to those of CT signs or elevated troponin T level alone. In conclusion, the combined assessment of the ratio of RV volume to left ventricular volume and an elevated troponin T level provided incrementally more prognostic information in non-high-risk patients with acute PE compared to the single predictor of CT signs or troponin T level.
In the risk stratification of acute pulmonary embolism (PE), echocardiography is the reference standard for the diagnosis of right ventricular (RV) dysfunction. However, computed tomographic (CT) pulmonary angiography has the benefit of directly diagnosing PE as well as simultaneously providing indirect signs of RV dysfunction. The ventricles have a complex 3-dimensional shape; thus, volumetric measurements of the right and left ventricles using CT pulmonary angiography are expected to provide a more accurate method for examining RV dysfunction. As an alternative approach, combined assessment of echocardiographic findings and cardiac biomarkers has been reported to offer incremental prognostic value for identifying high-risk patients. Thus, we evaluated whether volumetric measurement of RV dysfunction was superior to other CT signs of RV dysfunction as well as the incremental value of combined assessment with CT signs of RV dysfunction and cardiac troponin T level for predicting early death or adverse outcomes due to acute PE.
Methods
We retrospectively identified 223 consecutive patients hospitalized at our hospital from March 2005 through March 2010 with acute PE confirmed by CT pulmonary angiography. The medical records department of our institution searched 1,087 patients who underwent CT pulmonary angiography in this period; 266 of these had been registered as having acute PE. In total, 223 patients were positive for PE on CT pulmonary angiography, and 43 had negative PE findings on CT pulmonary angiography. One hundred seventy-three patients were finally eligible for the present study, after the exclusion of 18 patients with incomplete follow-up data for the end point, 15 patients without laboratory data for cardiac troponin, 12 patients with high-risk PE, and 5 patients with insufficient contrast enhancement of the ventricular chambers for reliable delineation of the endocardial borders. High-risk PE was defined as the presence of shock or persistent systemic hypotension (defined as systolic blood pressure <90 mm Hg or a pressure decrease of >40 mm Hg for 15 minutes) and represented an immediately life-threatening emergency requiring specific management. For clinical assessment of the probability of PE, we used the Wells score, which classifies patients as “PE unlikely” or “PE likely.” Co-morbidities that increased the risk for adverse outcome included advanced age, cancer, chronic lung disease, and heart failure, in accordance with the International Cooperative Pulmonary Embolism Registry (ICOPER). The Human Research Committee at Ajou University Hospital approved the study design and waived the need for informed patient consent for this retrospective analysis.
All patients had undergone CT imaging, without electrocardiographic gating, using a 16-slice multidetector CT system (Somatom Sensation; Siemens Medical Systems, Forchheim, Germany) or a 64-slice scanner (Brilliance; Phillips Medical Systems, Eindhoven, The Netherlands). The image acquisition parameters for 16-sclice CT imaging were as follows: gantry rotation time 500 ms; collimation 16 × 0.75 mm; pitch 1.0; tube voltage 120 kV; and effective tube current of 200 mA. The image acquisition parameters for 64-slice CT imaging were as follows: gantry rotation time 500 ms, detector collimation 64 × 0.625 mm, pitch 0.924, tube voltage 120 kV, and effective tube current 200 mA. Precontrast CT imaging was performed with 3-mm section thickness to evaluate calcification or degree of enhancement, because up to 2/3 of the patients for whom there was initial suspicion of PE received other diagnoses. In the next step, postcontrast CT pulmonary angiography was performed with 1-mm reconstruction section thickness. Contrast media (80 ml of Omnipaque 350; GE Healthcare, Dublin, Ireland) was injected intravenously at a rate of 3.2 ml/s, followed by a saline flush (30 ml). Automated bolus triggering was used with a region of interest in the main pulmonary artery and a threshold of 120 Hounsfield units for triggering data acquisition. Data were acquired in a craniocaudal direction in the supine position with full inspiration. The scanning range extended from the level of the sternal notch to the level of the adrenal gland.
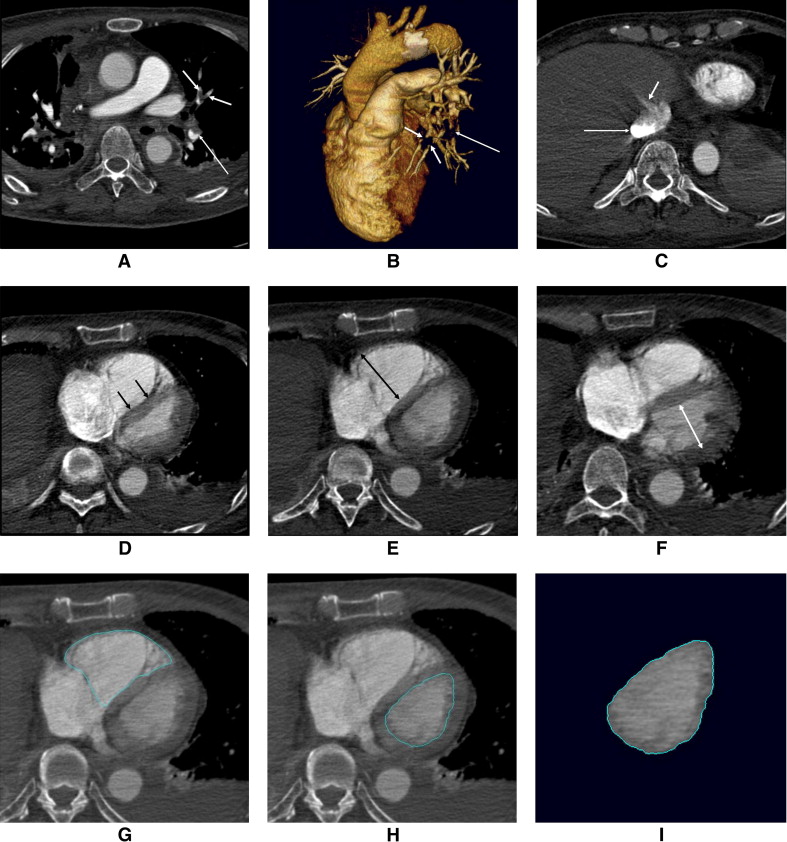
All CT studies were independently reviewed by 2 experienced observers (D.K.K., J.S.S.), with 7 and 5 years of experience, respectively. Because of the retrospective nature of the study, the observers were aware that patients had been diagnosed with acute PE, but they were blinded to patients’ other clinical characteristics and outcomes. The initial clinical diagnosis of PE was confirmed in the presence of ≥1 filling defect in the pulmonary artery tree ( Figure 1 ), including the subsegmental level. The severity of reflux of contrast medium into the inferior vena cava or hepatic veins was graded according to a previously published scale : 1 = no reflux; 2 = trace of reflux into the inferior vena cava only; 3 = reflux into the inferior vena cava, but not the hepatic veins; 4 = reflux into the inferior vena cava and proximal hepatic veins; 5 = reflux into the inferior vena cava and hepatic veins down to the midportion of the liver; and 6 = reflux into the inferior vena cava with opacification of distal hepatic veins ( Figure 1 ). The degree of contrast medium reflux was grouped into nonsubstantial (grades 1 to 3) and substantial (grades 4 to 6) reflux. Deviation of the interventricular septum was evaluated as follows: normal (convex toward the right ventricle), flattened, and septal bowing (convex toward the left ventricle). Flattened septum and septal bowing were considered abnormal septal shapes, indicating RV strain ( Figure 1 ). RV and left ventricular (LV) diameter were measured with calipers on transverse section by identifying the maximum distance between the ventricular endocardium and the interventricular septum, perpendicular to the long axis of the heart. The ratio of RV diameter (RVD) to LV diameter (LVD) was also calculated from these images ( Figure 1 ). The volumetric analysis of the 2 ventricles was performed using a commercially available workstation (Vitrea 2 version 3.8.1; Vital Image, Minnetonka, Minnesota). On every 4 transverse sections (i.e., 4-mm intervals), the endocardial contours for the left and right ventricles were manually traced, and the outlining was then automatically propagated to the neighboring sections. Papillary muscles, moderator bands, and trabeculations were assigned to the intracavitary lumen of the ventricles. For RV volume (RVV), the areas containing a recognizable RV outflow tract below the pulmonary valve were included in the ventricular portion. The ventricles were semiautomatically segmented from the valvular plane down to the apex of each ventricle. The volume of each ventricle was automatically estimated, and the ratio of RVV to LV volume (LVV) was subsequently calculated ( Figure 1 ).
Laboratory tests for the evaluation of acute PE included measurements of d -dimer and troponin T. The upper limits of d -dimer using latex immunoassay were 300 ng/ml for women and 200 ng/ml for men. Troponin T levels were obtained on admission as well as 12 and 24 hours thereafter. Samples for cardiac markers were centrifuged, and the serum was frozen until used in a quantitative assay (electrochemiluminescence; Roche Diagnostics GmbH, Mannheim, Germany). The reference level of troponin T in our hospital ranged from 0.0 to 0.1 ng/ml.
According to the guidelines of the European Heart Association, we performed further risk stratification of our non-high-risk PE patients using a combination of CT signs of RV dysfunction and cardiac troponin T levels. If the markers of RV dysfunction and/or myocardial injury were present, the patients were classified as intermediate risk. Hemodynamically stable patients without evidence of RV dysfunction or myocardial injury were classified as low risk.
A fatal clinical outcome was defined as early death within 3 months with reference to previous reports. Nonfatal adverse clinical outcomes were defined as escalation of therapy, according to the Management Strategies and Prognosis in Pulmonary Embolism Trial 3 (MAPPET-3) criteria, including cardiopulmonary resuscitation, required ventilator support, and vasopressor therapy.
We used MedCalc version 10.4.8 (MedCalc Software, Mariakerke, Belgium) for all statistical analyses. We used chi-square tests or Fisher’s exact tests for comparisons of categorical variables and independent-samples Student’s t tests or Mann-Whitney U tests for comparisons in the distributions of continuous variables. Using receiver-operating characteristic curve analysis, the area under the curve of the RVV/LVV ratio for predicting 3-month mortality was evaluated, and the optimal cut-off value was determined. The Kaplan-Meier method with a log-rank test was used to estimate cumulative mortality according to risk stratification. Multivariate analysis with adjusting co-morbidities was used with Cox proportional-hazards regression. A p value <0.05 was considered to indicate statistical significance.
Results
The clinical characteristics of the study population are listed in Table 1 . Our study population included 109 patients (63%) classified as PE likely (score >4) according to the Wells score and 64 patients (37%) with abnormal d -dimer results. Overall, 17 patients (9.8%) died within 3 months. Of these 17 deaths, 8 were judged to be directly related to PE; the remaining 9 were due to cancer (n = 6), heart failure (n = 2) due to myocardial infarction, and respiratory failure (n = 1) due to chronic obstructive lung disease. Of the remaining 156 patients who survived, 17 had nonfatal adverse outcomes: 12 who required ventilator support, 3 who required the use of vasopressors, and 2 who required cardiopulmonary resuscitation. Sixty-one patients (35%) had relevant co-morbidities, and cancer was more common (p = 0.031) in patients who died within 3 months.
| Variable | Total (n = 173) | Survival (n = 156) | Early Death (n = 17) | p Value |
|---|---|---|---|---|
| Uncomplicated Clinical Course (n = 139) | Adverse Outcome (n = 34) | |||
| Age (years) | 61 ± 14 | 60 ± 15 | 64 ± 12 | 0.296 |
| 60 ± 14 | 61 ± 14 | 0.706 | ||
| Men | 76 (44%) | 68 (44%) | 8 (47%) | 0.987 |
| 65 (47%) | 11 (32%) | 0.185 | ||
| Co-morbidities | 61 (35%) | 51 (33%) | 10 (58%) | 0.061 |
| 46 (33%) | 15 (44%) | 0.236 | ||
| Cancer | 41 (24%) | 33 (21%) | 8 (47%) | 0.031 ⁎ |
| 29 (21%) | 12 (35%) | 0.113 | ||
| Chronic lung disease | 15 (9%) | 14 (9%) | 1 (6%) | 0.999 |
| 12 (9%) | 3 (9%) | 0.999 | ||
| Heart failure | 8 (5%) | 7 (4%) | 1 (6%) | 0.570 |
| 7 (5%) | 1 (3%) | 0.999 |
The correlation coefficients of the RVD/LVD and RVV/LVV ratios between the 2 observers were 0.891 (p <0.001) and 0.928 (p <0.001), respectively. Interobserver agreement was good for inferior vena cava contrast reflux (κ = 0.723) and abnormal septal shape (κ = 0.651) and excellent for RVD/LVD >1.1 (κ = 0.808) and RVV/LVV >1.5 (κ = 0.826).
Using receiver-operating characteristic curve analysis, the optimal cut-off values for predicting early deaths or adverse outcomes were 1.1 and 1.5 for RVD/LVD and RVV/LVV, respectively, and 0.20 ng/ml for cardiac troponin T level. An RVD/LVD ratio >1.1 and an RVV/LVV ratio >1.5 and an elevated troponin T level were more common in patients with early death or adverse outcomes than in patients who survived or had uncomplicated clinical courses ( Table 2 ). However, there was no statistical difference in the prevalence of inferior vena cava contrast reflux and abnormal septal shape between patients who died and those who survived or between patients with adverse outcomes and uncomplicated clinical courses.
| Sign of RV Dysfunction | Survival (n = 156) | Early Death (n = 17) | p Value |
|---|---|---|---|
| Uncomplicated Clinical Course (n = 139) | Adverse Outcome (n = 34) | ||
| IVC contrast reflux | 54 (35%) | 8 (47%) | 0.453 |
| 44 (32%) | 15 (44%) | 0.241 | |
| Abnormal septal shape | 49 (31%) | 9 (53%) | 0.130 |
| 42 (30%) | 16 (47%) | 0.097 | |
| RVD/LVD ratio | 58 (37%) | 12 (71%) | 0.016 ⁎ |
| 50 (36%) | 20 (59%) | 0.025 ⁎ | |
| RVV/LVV ratio | 45 (29%) | 12 (71%) | 0.001 ⁎ |
| 37 (27%) | 20 (59%) | <0.001 ⁎ | |
| Elevated troponin T level | 38 (24%) | 11 (65%) | 0.001 ⁎ |
| 30 (22%) | 19 (56%) | <0.001 ⁎ |
The RVD/LVD ratio or RVV/LVV ratio alone could predict early death or adverse outcome, whereas inferior vena cava contrast reflux or abnormal septal shape alone did not ( Table 3 ). RVV/LVV >1.5 had the highest area under the curve (0.709, p <0.001) for predicting early death compared to other CT signs. When troponin T level was combined as a risk stratification criterion, there were increases in the area under the curve for predicting early death or adverse outcome. The combination of an RVV/LVV ratio >1.5 and an elevated troponin T level revealed the highest areas under the curve (0.733 and 0.706, respectively) for predicting early death or adverse outcome.
| Diagnostic Criterion | For Predicting Early Death | For Predicting Adverse Outcome | ||||
|---|---|---|---|---|---|---|
| AUC | 95% CI | p Value | AUC | 95% CI | p Value | |
| IVC contrast reflux | 0.562 | 0.485–0.637 | 0.340 | 0.562 | 0.485–0.637 | 0.190 |
| IVC contrast reflux and troponin T | 0.606 | 0.529–0.679 | 0.094 | 0.637 | 0.560–0.708 | 0.003 ⁎ |
| Abnormal septal shape | 0.608 | 0.531–0.681 | 0.098 | 0.584 | 0.507–0.659 | 0.077 |
| Abnormal septal shape and troponin T | 0.661 | 0.585–0.731 | 0.004 ⁎ | 0.644 | 0.568–0.715 | 0.001 ⁎ |
| RVD/LVD ratio | 0.667 | 0.592–0.737 | 0.006 ⁎ | 0.614 | 0.537–0.687 | 0.016 ⁎ |
| RVD/LVD ratio and troponin T | 0.675 | 0.599–0.744 | <0.001 ⁎ | 0.659 | 0.584–0.730 | <0.001 ⁎ |
| RVV/LVV ratio | 0.709 | 0.635–0.775 | <0.001 ⁎ | 0.661 | 0.585–0.731 | <0.001 ⁎ |
| RVV/LVV ratio and troponin T | 0.733 | 0.660–0.797 | <0.001 ⁎ | 0.706 | 0.633–0.773 | <0.001 ⁎ |
| Elevated troponin T level | 0.702 | 0.628–0.769 | 0.006 ⁎ | 0.671 | 0.596–0.741 | <0.001 ⁎ |
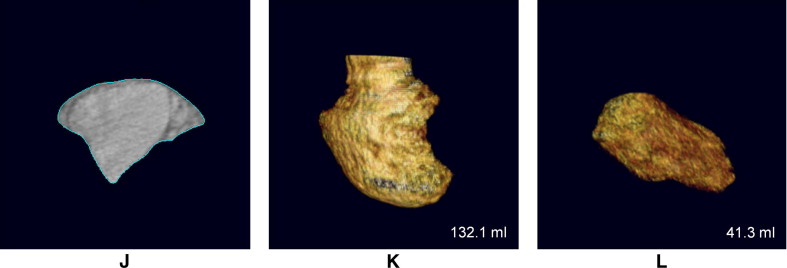
Early death within 3 months was higher (13% to 22%) in patients with CT signs of RV dysfunction or elevated troponin T levels than in patients with negative findings (4% to 8%; Figure 2 ). According to risk stratification, using a combination of CT signs of RV dysfunction and elevated troponin T level, early mortality in the intermediate-risk group was higher (14% to 19%) than in the low-risk group (2% to 6%) ( Figure 2 ).
Stay updated, free articles. Join our Telegram channel

Full access? Get Clinical Tree


