Red cell distribution width (RDW) is strongly associated with prognosis in cardiopulmonary disorders such as coronary artery disease, acute myocardial infarction, acute and chronic heart failure, and pulmonary hypertension. However, its prognostic significance in acute pulmonary embolism (PE) is unknown. The aim of this study was to investigate the relation between admission RDW and early mortality in patients with acute PE. One hundred sixty-five patients with confirmed acute PE were included. Patients with previous treatment for anemia, malignancy, or chronic liver disease, those with dialysis treatment for chronic renal failure, and those who received erythrocyte suspension for any reason were excluded. A total of 136 consecutive patients with acute PE were evaluated prospectively. According to receiver-operating characteristic curve analysis, the optimal cut-off value of RDW to predict early mortality was >14.6%, with 95.2% sensitivity and 53% specificity. Patients were categorized prospectively as having unchanged (group 1) or increased (group 2) RDW on the basis of a cut-off value of 14.6%. The mean age of patients was 63 ± 15 years. The mean follow-up duration was 11 ± 7 days, and 21 patients died. Among these 21 patients, 1 (1.6%) was in group 1 and 20 (27%) were in group 2 (p <0.001). Increased RDW >14.6% on admission, age, presence of shock, heart rate, oxygen saturation, and creatinine level were found to have prognostic significance in univariate Cox proportional-hazards analysis. Only increased RDW >14.6% on admission (hazard ratio 15.465, p = 0.012) and the presence of shock (hazard ratio 9.354, p <0.001) remained associated with increased risk for acute PE-related early mortality in a multivariate Cox proportional-hazards model. In conclusion, high RDW was associated with worse hemodynamic parameters, and RDW seems to aid in the risk stratification of patients with acute PE.
The potential use of admission red cell distribution width (RDW) in the risk stratification of patients with acute pulmonary embolism (PE) to identify PE-related early mortality has not been previously studied. We aimed to investigate the relation between admission RDW and early mortality in patients with acute PE along with other admission parameters in a prospective observational study.
Methods
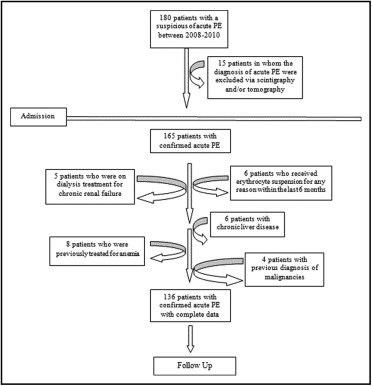
A total of 180 consecutive patients admitted to the emergency unit and then hospitalized for suspicion of acute PE were prospectively considered for enrollment at 3 participating centers from January 2008 to January 2010 ( Figure 1 ) . Six patients with chronic liver disease, 5 patients who were receiving dialysis treatment for chronic renal failure, 4 patients with previous diagnoses of malignancies, 8 patients who were previously treated for anemia, 6 patients who received erythrocyte suspension for any reason within the past 6 months, and 15 patients in whom the diagnosis of acute PE was excluded on scintigraphy and/or tomography (and alternative diagnoses were confirmed) were not considered for the study. A total of 136 patients, whose diagnoses were confirmed as acute PE by ventilation-perfusion scintigraphy and/or multislice spiral computed tomography, according to guideline recommendations, were enrolled in the study after obtaining informed consent.
The optimal cut-off point of RDW (at which sensitivity and specificity would be maximal) for the prediction of early mortality was defined using receiver-operator characteristic curve analysis. Patients with acute PE were classified according to this RDW cut-off value. Group 1 consisted of patients with RDW ≤14.6% (n = 62), and group 2 consisted of patients with RDW >14.6% (n = 74). Data collection, per protocol, included symptoms of admission to the emergency unit and their duration, predisposing conditions, history of coronary artery disease, diabetes mellitus, hypertension, and chronic obstructive pulmonary disease (COPD), vital signs at the time of admission to emergency unit, as well as results of several diagnostic procedures, including blood gas analysis, admission RDW and other blood parameters, electrocardiography, transthoracic echocardiography, lower extremity Doppler ultrasound, contrast-enhanced spiral computed tomography, ventilation-perfusion scintigraphy, and duration of hospitalization. Of note, in this study, only admission parameters were considered (first ever obtained parameter within 30 minutes of admission). PE-related early mortality was identified as PE-related in-hospital mortality. RDW was measured using a Beckman Coulter Automated CBC Analyzer (Beckman Coulter, Inc., Fullerton, California). The normal reference range for RDW in our laboratory is 11.5% to 14.5%. Anemia was defined as hemoglobin <13 g/dl in men and <12 g/dl in women, in accordance with World Health Organization criteria. Hypertension was defined as blood pressure >140/90 mm Hg on >2 occasions during office measurements or receiving antihypertensive treatment. Diabetes mellitus was defined as fasting blood glucose ≥126 mg/dl or receiving antidiabetic treatment. Coronary artery disease was recorded as present if there was a clinical history of coronary artery disease, abnormal stress test results with evidence of ischemia, or documented coronary stenosis >50%. Rhythm and electrocardiographic findings of right ventricular (RV) loading, including S1Q3T3, right bundle branch block pattern, and T-wave changes on right precordial derivations, were evaluated.
Per protocol, all participating centers were advised to perform transthoracic echocardiography <24 hours after admission. Echocardiographic examinations were performed using the Vivid 7 system (GE Healthcare, Wauwatosa, Wisconsin) with 2.5- to 5-MHz probes at all participating centers. The ejection fraction was calculated using the modified Simpson method. Chamber sizes were defined according to recent guidelines. To evaluate RV dysfunction, the presence of RV dilatation, an increase in tricuspid regurgitation jet flow rate, and systolic pulmonary artery pressure were evaluated on echocardiography. RV dimensions were evaluated according to the most recent guideline ; RV dimension >3.4 cm at the basal plane or >3.8 cm at the midplane was used to designate RV dilation, per guidelines. Right atrial size was measured in the minor-axis dimension extending from the lateral border of the right atrium to the interatrial septum. Valvular regurgitations were graded into 2 categories (severe vs nonsevere) using a combination of color flow jet Doppler signal intensity and vena contracta width according to guideline recommendations. Systolic pulmonary artery pressure was calculated as shown previously. Digital records of transthoracic echocardiographic examinations without recorded identities were sent to the main center and evaluated offline by an expert sonographer, blinded to the study objective. The study was performed in accordance with the Declaration of Helsinki and was approved by the institutional review board.
Continuous variables are expressed as mean ± SD or as median (interquartile range) in the presence of an abnormal distribution and categorical variables as percentages. Receiver-operating characteristic curve analysis was performed to identify the optimal cut-off point of RDW (at which sensitivity and specificity would be maximal) for the prediction of early mortality. Areas under the curve were calculated as measures of the accuracy of the tests. We compared the area under the curve using the Z test. Patients with acute PE were categorized prospectively as having unchanged (group 1) or increased (group 2) RDW on the basis of the cut-off value. Comparisons between groups of patients were made using chi-square tests for categorical variables, independent-samples Student’s t tests for normally distributed continuous variables, and Mann-Whitney U tests when the distribution was skewed. Correlations were evaluated either via Pearson’s or Spearman’s correlation tests. Kaplan-Meier cumulative survival curves were used to display survival in 2 patient subgroups, defined as having unchanged (group 1) or increased (group 2) RDW on the basis of the cut-off value. We used univariate Cox proportional-hazards analysis to quantify the associations of variables with PE-related early mortality. Variables found to be statistically significant on univariate analysis and potential other confounders, RV dilatation or hypokinesia, and the presence of anemia were used in a multivariate Cox proportional-hazards model with the forward stepwise method to determine the independent prognostic factors of early mortality. All statistical procedures were performed using SPSS version 15.0 (SPSS, Inc., Chicago, Illinois). A p value <0.05 was considered statistically significant.
Results
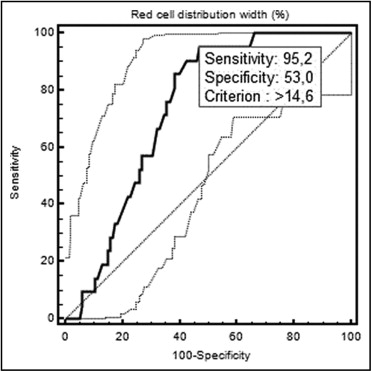
The mean age of the patients was 63 ± 15 years (52% women, 48% men). Receiver-operating characteristic curve analysis of RDW is shown in Figure 2 . According to the receiver-operating characteristic curve analysis, the optimal cut-off value of RDW to predict early mortality was >14.6%, with 95.2% sensitivity and 53% specificity (area under the curve 0.734, 95% confidence interval 0.646 to 0.822).
Baseline characteristics of patients with acute PE classified into 2 categories according to threshold RDW levels are listed in Table 1 . There was no statistically significant difference between the 2 groups regarding many of the parameters, although histories of COPD were more frequent in those with high RDW levels ( Table 1 ).
| Variable | All Patients (n = 136) | RDW | p Value | |
|---|---|---|---|---|
| 14.6% (n = 62) | >14.6% (n = 74) | |||
| Age (years) | 63 ± 15 | 61 ± 16 | 65 ± 15 | 0.112 |
| Women | 71 (52%) | 33 (53%) | 38 (51%) | 0.827 |
| Admission symptoms | 0.587 | |||
| Dyspnea | 92 (69%) | 40 (67%) | 52 (70%) | 0.795 |
| Chest pain | 38 (28%) | 20 (33%) | 18 (24%) | 0.338 |
| Hemoptysis | 9 (7%) | 2 (3%) | 7 (9%) | 0.187 |
| Syncope | 12 (9%) | 5 (8%) | 7 (9%) | 0.820 |
| Symptom duration (hours) | 0.677 | |||
| <6 | 7 (5%) | 3 (5%) | 4 (5%) | 0.934 |
| 6–12 | 11 (8%) | 3 (5%) | 8 (11%) | 0.345 |
| 12–24 | 29 (22%) | 14 (24%) | 15 (20%) | 0.788 |
| >24 | 86 (65%) | 39 (66%) | 47 (63%) | 0.898 |
| Hypertension | 56 (41%) | 22 (35%) | 34 (46%) | 0.217 |
| Diabetes mellitus | 30 (22%) | 13 (21%) | 17 (23%) | 0.942 |
| Coronary artery disease | 31 (24%) | 14 (24%) | 17 (24%) | 0.987 |
| COPD | 22 (16%) | 3 (5%) | 19 (26%) | 0.003 |
| Immobilization | 27 (21%) | 15 (25%) | 12 (16%) | 0.274 |
| History of PE | 8 (6%) | 4 (7%) | 4 (5%) | 1.000 |
| History of deep venous thrombosis | 8 (6%) | 4 (7%) | 4 (5%) | 1.000 |
| History of surgery | 28 (21%) | 14 (24%) | 14 (19) | 0.644 |
Comparison of 2 subgroups of patients with acute PE along with hemodynamic, electrocardiographic, echocardiographic, and laboratory findings is listed in Table 2 . Most transthoracic echocardiographic studies were performed within the first 24 hours of emergency unit admission (at admission in most patients). Findings of echocardiographic examinations beyond the deadline (n = 15) were not considered in the study, because findings could have been changed.
| Variable | All Patients (n = 136) | RDW | p Value | |
|---|---|---|---|---|
| ≤14.6% (n = 62) | >14.6% (n = 74) | |||
| Hemodynamic findings | ||||
| Heart rate (beats/min) | 111 ± 22 | 102 ± 18 | 117 ± 23 | 0.001 |
| Systolic blood pressure (mm Hg) | 105 ± 18 | 111 ± 19 | 100 ± 15 | 0.002 |
| Diastolic blood pressure (mm Hg) | 65 ± 15 | 70 ± 15 | 61 ± 13 | 0.002 |
| Presence of shock | 22 (16%) | 4 (6.5%) | 18 (24%) | 0.010 |
| Oxygen saturation (%) | 85 ± 9 | 88 ± 7 | 82 ± 10 | 0.001 |
| Electrocardiography parameters | ||||
| Atrial fibrillation | 30 (23%) | 5 (8%) | 25 (36%) | 0.001 |
| Right bundle branch block | 34 (27%) | 10 (17%) | 24 (35%) | 0.043 |
| S1Q3T3 | 24 (19%) | 11 (19%) | 13 (19%) | 1.000 |
| T-wave changes | 46 (36%) | 22 (38%) | 24 (35%) | 0.855 |
| Echocardiographic parameters | ||||
| Left ventricular ejection fraction (%) | 54 ± 10 | 57 ± 7 | 52 ± 11 | 0.011 |
| RV dilatation/hypokinesia | 79 (78%) | 25 (64%) | 54 (86%) | 0.015 |
| Severe tricuspid regurgitation | 64 (61%) | 21 (48%) | 43 (70%) | 0.031 |
| Systolic pulmonary artery pressure (mm Hg) | 48 ± 19 | 41 ± 15 | 53 ± 20 | 0.001 |
| Laboratory findings | ||||
| RDW (%) (interquartile range) | 15.7 ± 2.7 (13.7–17.2) | 13.5 ± 0.7 (13.1–14.1) | 17.4 ± 2.4 (15.8–18.5) | <0.001 |
| Hemoglobin (g/dl) | 12.9 ± 2.0 | 13.4 ± 1.5 | 12.5 ± 2.2 | 0.005 |
| Presence of anemia | 53 (39%) | 14 (23%) | 39 (53%) | 0.001 |
| Troponin I (ng/ml) | 0.15 ± 0.3 | 0.19 ± 0.4 | 0.12 ± 0.2 | 0.325 |
| Creatinine (mg/dl) | 1.20 ± 0.8 | 1.05 ± 0.5 | 1.33 ± 1.0 | 0.295 |
| Spiral computed tomographic findings | 0.062 | |||
| Main pulmonary artery involvement | 9 (7%) | 1 (2%) | 8 (12%) | 0.033 |
| Main pulmonary artery branch involvement | 77 (61%) | 37 (60%) | 40 (61%) | 0.974 |
| Main pulmonary artery segmental involvement | 51 (40%) | 28 (45%) | 23 (35%) | 0.346 |
| Main pulmonary artery subsegmental involvement | 17 (13%) | 11 (18%) | 8 (9%) | 0.197 |
| Deep venous thrombosis | 49 (37%) | 27 (43%) | 22 (31%) | 0.168 |
| Primary end point | ||||
| Early mortality | 21 (15%) | 1 (1.6%) | 20 (27) | <0.001 |
In patients with acute PE, RDW levels were correlated with admission (first ever obtained) heart rate (r = 0.364, p <0.001), systolic (r = −0.313, p = 0.002) and diastolic (r = −0.336, p = 0.001) blood pressures, oxygen saturation (r = −0.269, p = 0.005), the left ventricular ejection fraction (r = −0.380, p <0.001), systolic pulmonary artery pressure (r = 0.361, p <0.001), and hemoglobin level (r = −0.287, p = 0.001). There were no significant correlations between RDW level and the other laboratory findings (p >0.05).
Patients were followed up for a mean period of 11 ± 7 days (range 1 to 40) after hospitalization, and 21 patients (15.4%) succumbed to death. Of these 21 patients, 1 (1.6%) was in group 1 and 20 (27%) were in group 2 (p <0.001, Table 2 ). According to Kaplan-Meier survival analysis, a significant difference was found between the 2 groups (having increased or no increased RDW on the basis of the cut-off value of 14.6%) in terms of survival rate (p <0.001, Figure 3 ) .

Results of the univariate and multivariate Cox proportional-hazards analyses for early mortality are listed in Table 3 . Increased RDW >14.6% on admission, age, presence of shock, heart rate, oxygen saturation, and creatinine level were found to have prognostic significance. In the multivariate Cox proportional-hazards model, only increased RDW >14.6% on admission and the presence of shock remained associated with increased risk for acute PE–related early mortality.
Stay updated, free articles. Join our Telegram channel

Full access? Get Clinical Tree


