In recent years, there has been an increased emphasis on the diagnosis and treatment of valvular heart disease and, in particular, aortic stenosis. This has been driven in part by the development of innovative therapeutic options and by an aging patient population. We hypothesized an increase in the number of hospitalizations and the economic burden associated with aortic valve disease (AVD). Using Nationwide Inpatient Sample from 2000 to 2012, AVD-related hospitalizations were identified using International Classification of Diseases, Ninth Revision, Clinical Modification , code 424.1, as the principal discharge diagnosis. Overall AVD hospitalizations increased by 59% from 2000 to 2012. This increase was most significant in patients >80 years and those with higher burden of co-morbidities. The most frequent coexisting conditions were hypertension, heart failure, renal failure, anemia, and diabetes. Overall inhospital mortality of patients hospitalized for AVD was 3.8%, which significantly decreased from 4.5% in 2000 to 3.5% in 2012 (p <0.001). The largest decrease in mortality was seen in the subgroup of patients who had heart failure (62% reduction), higher burden of co-morbidities (58% reduction), and who were >80 years (53% reduction). There was a substantial increase in the cost of hospitalization in the last decade from $31,909 to $38,172 (p <0.001). The total annual cost for AVD hospitalization in the United States increased from $1.3 billion in 2001 to $2.1 billion in 2011 and is expected to increase to nearly 3 billion by 2020. The last decade has witnessed a significant increase in hospitalizations for AVD in the United States. The associated decrease in inhospital mortality and increase in the cost of hospitalization have considerably increased the economic burden on the public health system.
Valvular heart disease is a major public health burden that increases with advancing age. Aortic valvular heart disease (AVD) in particular coexists with other more prevalent cardiovascular conditions, such as coronary artery disease, heart failure, and hypertension, and patients often require intervention. AVD consists of primarily aortic stenosis and to a lesser extent aortic insufficiency and mixed aortic valve diseases. Until recently, surgical aortic valve replacement was the only proved therapy for the treatment of severe symptomatic aortic stenosis. For the past decade, innovations in transcatheter valve technology have revolutionized the management of valvular heart disease in high- and extreme-risk patient populations. With the availability of more treatment options, an aging population, and the incremental cost of hospitalizations, the economic burden associated with AVD is of growing significance. Currently, there is paucity of data on AVD hospitalization trends on a national scale. The present study was designed to perform an evaluation of the temporal trends in AVD-related hospitalizations in the United States. We also assessed the overall burden of AVD in terms of inhospital mortality, co-morbid conditions, length of hospital stay, and cost of care during the hospitalization.
Methods
Data from the year 2000 to 2012 were obtained from the Nationwide Inpatient Sample (NIS). NIS is a part of a family of databases developed for the Healthcare Cost and Utilization Project and is sponsored by the Agency for Healthcare Research and Quality. It is the largest available database of hospital inpatient stays in the United States that includes data on approximately 7 to 8 million discharges each year. Data from the NIS have previously been used to identify, track, and analyze national trends in health care use, patterns of major procedures, access, disparity of care, trends in hospitalizations, charges, quality, and outcomes. Each individual hospitalization in this database is de-identified and maintained as a unique entry with 1 primary discharge diagnosis and <24 secondary diagnoses along with <15 procedural codes during that hospitalization. To maintain the external validity, database is compared with the following data sources: the American Hospital Association Annual Survey Database, the National Hospital Discharge Survey from the National Center for Health Statistics, and the MedPAR inpatient data from the Centers for Medicare and Medicaid Services.
We analyzed data from NIS from 2000 to 2012 using the International Classification of Diseases, Ninth Revision, Clinical Modification ( ICD-9-CM ) codes 424.1 for Non-Rheumatic Aortic Valve Disorders in the primary discharge diagnosis. Only subjects >60 years were included. The observations with missing information, such as age, gender, admission or discharge date, and mortality were excluded. Admissions related to trauma were also excluded. Both patient- and hospital-level variables were included in the baseline characteristics of the study population for assessment of potential confounders. We defined severity of co-morbid conditions using Deyo modification of Charlson co-morbidity index (CCI). This index contains 17 co-morbid conditions with differential weights. The score ranges from 0 to 33, with higher scores corresponding to greater burden of co-morbid diseases ( Supplementary Table 1 ). Facilities were considered to be teaching hospitals if they had an American Medical Association–approved residency program, were a member of the Council of Teaching Hospitals, or had a full-time equivalent intern and resident-to-patient ratio of ≥0.25. To calculate the estimated cost of hospitalizations, the NIS data were merged with cost-to-charge ratios available from the Healthcare Cost and Utilization Project. We estimated the cost of each inpatient stay by multiplying the total hospital charge with the cost-to-charge ratio. Adjusted cost for each year was calculated in terms of the 2011 cost after adjusting for inflation according to the latest consumer price index data released by the US government on January16, 2013. This enabled us to standardize the costs over the study period. Similar methodology has been used in previous studies. Total annual cost was calculated by multiplying mean cost of care per year with total number of cases for that year. Exponential trend line was used to illustrate the trend in total cost from 2001 to 2011 (R 2 = 0.87). Cost projection for 2020 was made assuming a similar increase in cost for AVD hospitalization over the next decade.
Stata IC 11.0 (Stata-Corp., College Station, Texas) and SAS 9.4 (SAS Institute Inc., Cary, North Carolina) were used for analyses, which accounted for the complex survey design and clustering. Because NIS represents a 20% stratified random sample of US hospitals, analyses were performed using hospital-level discharge weights provided by the NIS to obtain national estimates of AVD hospitalizations. For categorical variables like annual change in AVD hospitalization rate and inhospital mortality, the chi-square test of trend for proportions was used using the Cochrane Armitage test through the “ptrend” command in Stata. For continuous variables like cost of hospitalization, nonparametric test for trend by Cuzick (which is similar to the Wilcoxon rank-sum test) using the “nptrend” command in Stata was used. Differences between categorical variables were tested using the chi-square test, and differences between continuous variables were tested using the student’s t test. p Value <0.05 was considered significant.
Results
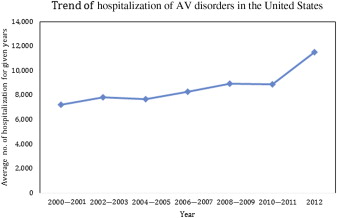
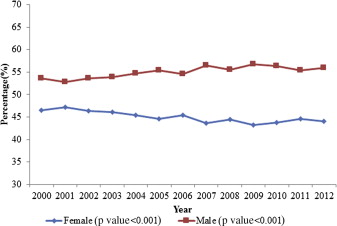
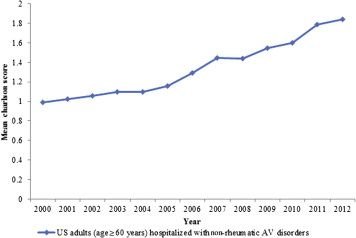
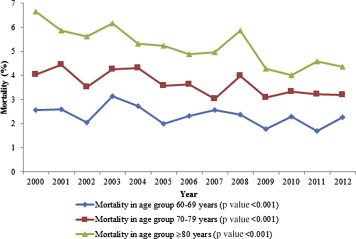
A total of 113,847 hospitalizations with AVD as the primary discharge diagnosis (weighted n = 561,880) were reported in the United States from 2000 to 2012 in patients >60 years. The number of hospitalizations progressively increased from 7,213 in 2000 to 11,531 in 2012 (p <0.001; Figure 1 ). The mean age of hospitalized patients increased from 75.6 to 76.9 years. Patient characteristics have been summarized in Table 1 . Hospitalized patients with AVD were predominantly non-Hispanic whites (69%) and were >70 years (76%). Overall, there were more hospitalizations in men than women (55% vs 45%), and the difference in male versus female gender ratio increased from 54% vs 46% in 2000 to 56% vs 44% in 2012 ( Figure 2 ). The admission rate in patients >80 years significantly increased from 32% in 2000 to 42% in 2012 (p <0.001). Admissions for patients with higher co-morbidities (CCI ≥2) doubled from 25% in 2000 to 50% in 2012 ( Figure 3 ). The most frequent coexisting conditions in these patients were hypertension (58%), heart failure (35%), renal failure and anemia (26% each), diabetes (24%), and chronic pulmonary disease (18%). Most hospitalizations for AVD (82%) were associated with Medicare as the primary payer. In terms of the geographic distribution of admissions, the hospitals in the South (29%) constituted the highest percentage of hospitalizations related to AVD, followed by Northeast (26%), Midwest (22%), and West (20%). Overall inhospital mortality of patients hospitalized for AVD was 3.8%, which significantly decreased from 4.5% in 2000 to 3.5% in 2012 (p <0.001; Figure 4 ). The largest decrease in mortality was seen in the subgroup of patients who had heart failure (62% reduction), had CCI >2 (58% reduction), and who were >80 years (53% reduction) ( Table 2 ). Forty-one percent of the patients were discharged to home, whereas 55% were transferred to another facility (short- or long-term nursing homes or assisted facilities). There was a noticeable increase in the trend for disposition to another facility, 45% in 2000 to 60% in 2012 (p <0.001; Figure 5 ). The length of hospital stay for this patient population decreased from 8.4 days in 2000 to 7.8 days in 2012 (p <0.001) and was associated with a substantial increase in cost of hospitalization in the last decade from $31,909 to $38,172 (p <0.001; Figure 6 ). This represents an absolute increment in annual national cost from an approximate $1.28 billion in 2001 to $2.13 billion in 2011. The total annual cost of AVD hospitalization increased exponentially from 2001 to 2011. Assuming a similar increase in cost of care for AVD-related hospitalization, the total cost for AVD hospitalization is expected to increase to nearly $3 billion by 2020 ( Figure 7 ).
| Demographic Variables | 2000 | 2001 | 2002 | 2003 | 2004 | 2005 | 2006 | 2007 | 2008 | 2009 | 2010 | 2011 | 2012 | Total | P-value for Trend |
|---|---|---|---|---|---|---|---|---|---|---|---|---|---|---|---|
| Total No. of Observations (>60 yrs age) with AV Disorders | 7,213 | 7,905 | 7,830 | 7,881 | 7,696 | 7,546 | 8,267 | 7,931 | 8,950 | 10,539 | 8,895 | 11,663 | 11,531 | 113,847 | <0.001 |
| Age (years) | |||||||||||||||
| 60-69 | 23.4% | 22.1% | 23.1% | 24.3% | 24.0% | 24.4% | 24.0% | 24.4% | 24.1% | 25.0% | 24.9% | 24.2% | 23.4% | 24.0% | <0.001 |
| 70-79 | 44.3% | 44.5% | 43.8% | 41.1% | 40.9% | 40.6% | 41.7% | 39.0% | 37.2% | 38.0% | 35.9% | 35.1% | 34.6% | 39.3% | <0.001 |
| >80 | 32.3% | 33.4% | 33.1% | 34.6% | 35.1% | 35.1% | 34.3% | 36.6% | 38.7% | 37.0% | 39.2% | 40.8% | 42.1% | 36.7% | <0.001 |
| Male | 53.6% | 52.8% | 53.6% | 53.9% | 54.7% | 55.4% | 54.6% | 56.4% | 55.5% | 56.7% | 56.3% | 55.4% | 56.0% | 55.1% | <0.001 |
| Female | 46.4% | 47.2% | 46.4% | 46.1% | 45.3% | 44.6% | 45.4% | 43.6% | 44.5% | 43.3% | 43.7% | 44.6% | 44.0% | 44.9% | <0.001 |
| Non-hispanic Whites | 69.0% | 65.5% | 60.6% | 62.3% | 64.9% | 64.1% | 65.3% | 66.6% | 69.7% | 68.6% | 74.7% | 77.6% | 79.1% | 69.0% | <0.001 |
| Others | 9.0% | 10.1% | 10.0% | 10.7% | 9.4% | 9.7% | 10.4% | 12.0% | 11.8% | 12.3% | 12.8% | 14.2% | 14.9% | 11.6% | <0.001 |
| Missing | 22.1% | 24.4% | 29.4% | 27.0% | 25.7% | 26.3% | 24.2% | 21.4% | 18.5% | 19.1% | 12.5% | 8.2% | 6.0% | 19.4% | <0.001 |
| AHRQ Comorbidities ∗ | |||||||||||||||
| Charlson/ Deyo Comorbidity Index † | |||||||||||||||
| 0 | 37.9% | 36.3% | 35.0% | 34.1% | 33.2% | 31.6% | 31.0% | 28.3% | 28.1% | 27.6% | 25.2% | 23.2% | 21.6% | 29.6% | <0.001 |
| 1 | 36.7% | 37.7% | 37.1% | 36.8% | 37.3% | 37.0% | 33.8% | 32.2% | 32.6% | 31.0% | 31.6% | 28.3% | 28.1% | 33.4% | <0.001 |
| More than or equal to 2 | 25.3% | 26.0% | 27.9% | 29.1% | 29.5% | 31.4% | 35.2% | 39.6% | 39.3% | 41.4% | 43.2% | 48.5% | 50.4% | 37.1% | <0.001 |
| Obesity | . | . | 5.0% | 5.5% | 6.9% | 7.2% | 7.9% | 8.7% | 12.1% | 11.8% | 12.3% | 15.0% | 15.9% | 9.0% | <0.001 |
| Hypertension | . | . | 49.9% | 53.1% | 60.1% | 62.7% | 65.6% | 65.6% | 69.6% | 71.0% | 71.4% | 74.6% | 77.3% | 57.7% | <0.001 |
| Diabetes Mellitus | . | . | 20.3% | 20.6% | 24.2% | 25.0% | 26.1% | 27.9% | 28.9% | 29.5% | 31.1% | 31.7% | 33.6% | 24.0% | <0.001 |
| Congestive Heart Failure (AHRQ coded co-morbidity) | . | . | 1.5% | 1.2% | 1.3% | 1.1% | 1.1% | 1.1% | 1.0% | 1.2% | 1.1% | 1.1% | 0.8% | 1.0% | <0.001 |
| History of Chronic Pulmonary Disease | . | . | 18.1% | 18.4% | 19.5% | 21.4% | 22.3% | 21.8% | 20.9% | 21.0% | 20.0% | 22.6% | 24.2% | 18.3% | <0.001 |
| Peripheral Vascular Disease | . | . | 10.1% | 10.5% | 13.1% | 12.3% | 13.4% | 14.9% | 16.2% | 17.3% | 15.3% | 18.7% | 19.9% | 13.1% | <0.001 |
| Fluid-electrolyte abnormalities & Renal Failure | . | . | 15.4% | 17.0% | 17.8% | 21.6% | 27.9% | 31.0% | 32.7% | 35.2% | 34.7% | 42.8% | 43.3% | 26.3% | <0.001 |
| Neurological disorder or paralysis | . | . | 5.0% | 3.7% | 4.4% | 4.6% | 4.6% | 5.5% | 6.0% | 6.0% | 6.3% | 6.7% | 7.0% | 4.8% | <0.001 |
| Anemia or coagulopathy | . | . | 17.7% | 19.7% | 21.8% | 25.7% | 26.7% | 29.2% | 31.5% | 33.3% | 31.9% | 39.9% | 40.3% | 25.9% | <0.001 |
| Solid Tumors or Metastatic Cancers or Lymphoma | . | . | 9.7% | 2.1% | 2.5% | 2.3% | 2.3% | 2.6% | 2.2% | 2.4% | 2.6% | 2.8% | 2.8% | 2.6% | <0.001 |
| Depression, Psychosis, or Substance Abuse | . | . | 3.3% | 4.3% | 4.3% | 3.9% | 5.2% | 6.0% | 7.1% | 7.0% | 7.4% | 8.3% | 8.9% | 5.4% | <0.001 |
| Liver Disease | . | . | 0.7% | 0.8% | 0.7% | 1.1% | 0.8% | 1.0% | 1.1% | 1.2% | 1.0% | 1.4% | 1.5% | 0.9% | <0.001 |
| Co-morbidities according to ICD-9 code | |||||||||||||||
| Acute Heart Failure | 0.0% | 0.0% | 0.1% | 0.2% | 0.4% | 0.3% | 0.3% | 1.1% | 6.2% | 7.3% | 9.5% | 11.9% | 14.0% | 4.5% | <0.001 |
| Heart Failure other than Acute Heart Failure | 30.3% | 31.7% | 32.3% | 34.0% | 33.2% | 33.0% | 32.5% | 32.9% | 26.9% | 25.6% | 26.3% | 27.3% | 28.4% | 30.1% | <0.001 |
| Heart Failure (Total) | 30.3% | 31.7% | 32.4% | 34.2% | 33.6% | 33.3% | 32.8% | 34.0% | 33.0% | 32.9% | 35.8% | 39.1% | 42.4% | 34.5% | <0.001 |
| Acute Myocardial Infarction | 2.4% | 2.4% | 2.2% | 2.7% | 2.6% | 2.4% | 2.0% | 2.3% | 2.4% | 2.6% | 3.1% | 2.9% | 2.9% | 2.6% | <0.001 |
| Median Household Income Category for patient’s Zip code ‡ | |||||||||||||||
| 1. 0-25th percentile | 4.9% | 4.4% | 3.4% | 21.0% | 20.0% | 19.7% | 19.1% | 19.0% | 20.0% | 20.7% | 20.8% | 20.6% | 22.1% | 17.1% | <0.001 |
| 2. 26-50th percentile | 26.4% | 20.1% | 17.1% | 25.1% | 25.5% | 23.5% | 24.5% | 23.1% | 27.5% | 25.7% | 26.7% | 23.5% | 24.1% | 24.1% | <0.001 |
| 3. 51-75th percentile | 27.9% | 24.6% | 23.7% | 26.9% | 23.5% | 27.5% | 25.1% | 25.4% | 24.3% | 24.9% | 26.2% | 26.6% | 25.2% | 25.5% | 0.867 |
| 4. 76-100th percentile | 39.1% | 49.6% | 53.4% | 25.2% | 28.6% | 27.6% | 29.3% | 30.0% | 26.7% | 26.2% | 24.3% | 27.5% | 27.0% | 31.3% | <0.001 |
| Primary Payer | |||||||||||||||
| Medicare | 79.8% | 81.5% | 82.3% | 83.7% | 80.9% | 81.8% | 82.6% | 81.2% | 80.6% | 81.3% | 81.0% | 83.3% | 84.0% | 81.9% | <0.001 |
| Medicaid | 2.0% | 1.8% | 1.4% | 1.7% | 1.5% | 1.9% | 1.3% | 1.4% | 1.5% | 1.5% | 2.0% | 1.2% | 1.3% | 1.6% | <0.001 |
| Private including HMOs & PPOs | 16.2% | 14.5% | 14.3% | 12.6% | 15.6% | 14.4% | 14.3% | 15.4% | 15.6% | 14.9% | 14.6% | 13.6% | 12.5% | 14.4% | <0.001 |
| Other/Self-pay | 1.8% | 2.0% | 2.0% | 1.9% | 1.9% | 1.9% | 1.7% | 2.0% | 2.3% | 2.1% | 2.3% | 1.7% | 2.0% | 2.0% | 0.03 |
| Hospital Characteristics | |||||||||||||||
| Bed size of Hospital depending on Location & Teaching Status | |||||||||||||||
| Small | 7.7% | 5.9% | 6.8% | 7.3% | 8.3% | 4.8% | 9.2% | 7.8% | 8.1% | 7.7% | 9.3% | 7.5% | 7.9% | 7.6% | <0.001 |
| Medium | 20.9% | 15.9% | 17.8% | 21.5% | 18.9% | 21.2% | 20.0% | 21.4% | 18.3% | 15.5% | 15.7% | 18.0% | 19.3% | 18.6% | <0.001 |
| Large | 71.4% | 78.2% | 75.4% | 71.2% | 72.8% | 74.1% | 70.8% | 70.7% | 73.6% | 74.9% | 73.7% | 74.1% | 72.8% | 73.4% | 0.799 |
| Hospital Location & Teaching Status | |||||||||||||||
| Rural | 5.2% | 5.7% | 5.3% | 6.0% | 5.4% | 4.0% | 4.0% | 5.2% | 5.4% | 5.2% | 6.6% | 3.4% | 4.3% | 5.0% | <0.001 |
| Urban Non-teaching | 29.8% | 33.1% | 34.6% | 33.6% | 33.1% | 37.8% | 37.8% | 32.5% | 38.0% | 31.0% | 33.6% | 28.3% | 27.9% | 33.0% | <0.001 |
| Urban Teaching | 65.0% | 61.2% | 60.1% | 60.4% | 61.5% | 58.2% | 58.2% | 62.3% | 56.6% | 63.9% | 59.8% | 68.3% | 67.8% | 62.0% | <0.001 |
| Hospital Region | |||||||||||||||
| Northeast | 28.8% | 25.4% | 27.8% | 22.8% | 26.6% | 24.8% | 23.3% | 27.3% | 24.6% | 23.3% | 27.1% | 27.4% | 24.5% | 25.6% | <0.001 |
| Midwest | 23.3% | 19.9% | 18.0% | 21.7% | 21.9% | 22.4% | 20.9% | 18.7% | 23.2% | 26.0% | 23.8% | 18.8% | 23.4% | 21.8% | <0.001 |
| South | 30.7% | 31.0% | 27.8% | 28.6% | 28.5% | 26.6% | 29.3% | 26.2% | 28.5% | 26.3% | 27.3% | 29.4% | 32.6% | 28.8% | 0.659 |
| West | 17.1% | 17.9% | 20.5% | 20.8% | 23.0% | 26.2% | 20.2% | 21.1% | 18.2% | 19.5% | 16.5% | 20.0% | 19.6% | 19.9% | <0.001 |
| Admission Type | |||||||||||||||
| Emergency/Urgent | 39.6% | 38.2% | 38.1% | 38.2% | 37.7% | 36.8% | 38.9% | 36.5% | 39.0% | 38.0% | 36.1% | 35.1% | . | 33.7% | <0.001 |
| Elective | 50.1% | 50.5% | 49.8% | 47.4% | 50.4% | 44.6% | 50.0% | 48.5% | 51.9% | 51.4% | 56.7% | 53.1% | . | 45.4% | <0.001 |
| Admission Day | |||||||||||||||
| Weekdays | 90.9% | 91.4% | 90.8% | 90.5% | 90.6% | 92.0% | 92.4% | 91.3% | 91.0% | 91.7% | 91.9% | 92.2% | 92.2% | 91.5% | <0.001 |
| Weekends | 9.1% | 8.6% | 9.2% | 9.5% | 9.4% | 8.0% | 7.6% | 8.7% | 9.0% | 8.4% | 8.1% | 7.8% | 7.8% | 8.5% | <0.001 |
| Disposition | |||||||||||||||
| Home | 50.7% | 48.0% | 49.0% | 48.0% | 43.5% | 40.8% | 40.7% | 36.8% | 36.9% | 40.4% | 35.9% | 35.1% | 36.6% | 41.1% | <0.001 |
| Transfer to Short-term Hospital/other facilities/Home Health Care | 44.5% | 47.3% | 46.6% | 46.8% | 51.9% | 55.1% | 55.4% | 59.3% | 58.5% | 56.1% | 60.6% | 61.3% | 59.8% | 54.7% | <0.001 |
| In Hospital Mortality (died in hospital) | 4.5% | 4.5% | 3.9% | 4.6% | 4.3% | 3.8% | 3.7% | 3.6% | 4.3% | 3.2% | 3.3% | 3.4% | 3.5% | 3.8% | <0.001 |
| Adjusted Cost to Charge ($)(Mean, Std Error) | . | 31,909 | 32,989 | 34,595 | 35,210 | 37,897 | 36,369 | 38,080 | 35,365 | 36,453 | 38,052 | 38,172 | . | 36,090 | |
| Length of Stay (Mean, Std Error)(days) | 8.4 | 8.3 | 8.3 | 8.3 | 8.2 | 8.3 | 8.3 | 8.4 | 8.0 | 8.0 | 7.8 | 8.1 | 7.8 | 8.1 |
∗ Variables are AHRQ comorbidity measures.
† Charlson/Deyo comorbidity index was calculated as per Deyo classification.
‡ This represents a quartile classification of the estimated median household income of residents in the patient’s ZIP Code. These values are derived from ZIP Code-demographic data obtained from Claritas. The quartiles are identified by values of 1 to 4, indicating the poorest to wealthiest populations. Because these estimates are updated annually, the value ranges vary by year. http://www.hcupus.ahrq.gov/db/vars/zipinc_qrtl/nisnote.jsp .
| Year | 2000 | 2001 | 2002 | 2003 | 2004 | 2005 | 2006 | 2007 | 2008 | 2009 | 2010 | 2011 | 2012 | Relative Change | P-value for Trend |
|---|---|---|---|---|---|---|---|---|---|---|---|---|---|---|---|
| Overall | 4.53% | 4.5% | 3.86% | 4.64% | 4.29% | 3.77% | 3.74% | 3.62% | 4.32% | 3.2% | 3.34% | 3.41% | 3.46% | -30.92% | <0.001 |
| Age(years) | |||||||||||||||
| 60-69 | 2.56% | 2.59% | 2.03% | 3.14% | 2.73% | 1.99% | 2.32% | 2.55% | 2.37% | 1.76% | 2.3% | 1.7% | 2.26% | -13.27% | <0.001 |
| 70-79 | 4.03% | 4.43% | 3.51% | 4.24% | 4.31% | 3.58% | 3.63% | 3.02% | 3.98% | 3.08% | 3.33% | 3.22% | 3.19% | -26.33% | <0.001 |
| >80 | 6.65% | 5.86% | 5.62% | 6.17% | 5.32% | 5.23% | 4.87% | 4.97% | 5.85% | 4.29% | 4% | 4.59% | 4.35% | -52.87% | <0.001 |
| Male | 3.83% | 3.81% | 3.34% | 4.28% | 3.67% | 3.5% | 3.33% | 3.33% | 3.91% | 3.18% | 2.94% | 3.16% | 3.41% | -12.32% | <0.001 |
| Female | 5.33% | 5.28% | 4.47% | 5.06% | 5.03% | 4.11% | 4.23% | 4% | 4.83% | 3.22% | 3.85% | 3.73% | 3.53% | -50.99% | <0.001 |
| Non-hispanic Whites | 4.45% | 4.61% | 3.85% | 4.34% | 4.22% | 3.84% | 3.74% | 3.44% | 4.4% | 3.15% | 3.3% | 3.42% | 3.39% | -31.27% | <0.001 |
| Others | 4.5% | 5.72% | 4.08% | 4.24% | 5.32% | 2.98% | 3.29% | 3.76% | 4.17% | 2.4% | 3.42% | 3.78% | 3.67% | -22.62% | <0.001 |
| Missing | 4.8% | 3.7% | 3.83% | 5.49% | 4.07% | 3.88% | 3.92% | 4.09% | 4.1% | 3.88% | 3.46% | 2.73% | 3.88% | -23.71% | <0.001 |
| AHRQ Comorbidities ∗ | |||||||||||||||
| Charlson/ Deyo Comorbidity Index † | |||||||||||||||
| 0 | 1.74% | 2.13% | 2.25% | 2.17% | 2.15% | 2.21% | 1.58% | 2% | 3.2% | 1.85% | 1.71% | 1.87% | 1.37% | -27.01% | <0.001 |
| 1 | 5.1% | 5.19% | 4.24% | 5.05% | 4.98% | 3.48% | 3.63% | 3.58% | 3.81% | 2.51% | 2.84% | 2.59% | 2.32% | -119.83% | 0.005 |
| More than or equal to 2 | 7.89% | 6.81% | 5.4% | 7.02% | 5.8% | 5.69% | 5.75% | 4.82% | 5.54% | 4.61% | 4.65% | 4.64% | 4.99% | -58.12% | <0.001 |
| Hypertension | . | . | 2.05% | 3.17% | 3.12% | 2.6% | 2.65% | 2.69% | 3.44% | 2.45% | 2.47% | 2.82% | 3.05% | 32.79% | 0.064 |
| Diabetes Mellitus | . | . | 3.22% | 4.34% | 3.74% | 3% | 2.92% | 3.18% | 3.02% | 3.07% | 3.25% | 3.2% | 3.48% | 7.47% | 0.107 |
| Congestive Heart Failure (AHRQ coded co-morbidity) | . | . | 18.34% | 23.05% | 22.6% | 21.73% | 26.91% | 24.67% | 27.32% | 21.02% | 18.67% | 18.42% | 23.4% | 21.62% | 0.547 |
| Co-morbidites according to ICD-9 code | |||||||||||||||
| Acute Heart Failure | . | . | 0.0% | 18.18% | 6.48% | 8.29% | 6.59% | 4.11% | 5.87% | 6.09% | 4.96% | 6.39% | 5.65% | -221.77% | 0.24 |
| Heart Failure other than Acute heart failure | 8.25% | 7.86% | 6.07% | 8.12% | 7.04% | 6.23% | 6.6% | 5.78% | 6.58% | 5.17% | 5.44% | 4.65% | 4.82% | -71.16% | <0.001 |
| Heart Failure (total) | 8.25% | 7.86% | 6.06% | 8.18% | 7.04% | 6.24% | 6.6% | 5.72% | 6.44% | 5.38% | 5.31% | 5.18% | 5.09% | -62.08% | <0.001 |
| Acute Myocardial Infarction | 17.78% | 17.17% | 13.89% | 19.24% | 21.13% | 14.61% | 19.55% | 10.87% | 14.22% | 12.37% | 12.29% | 11.81% | 14.54% | -22.28% | <0.001 |
| Primary Payer | |||||||||||||||
| Medicare | 5% | 4.74% | 4.03% | 4.77% | 4.51% | 3.89% | 4.04% | 3.73% | 4.5% | 3.32% | 3.48% | 3.55% | 3.59% | 39.28% | <0.001 |
| Medicaid | 2.75% | 5.5% | 8.05% | 4.69% | 5.66% | 4.22% | 0.0% | 4.91% | 2.18% | 3.79% | 1.79% | 2.05% | 4.64% | 40.73% | <0.001 |
| Private including HMOs & PPOs | 2.83% | 2.93% | 2.62% | 3.29% | 2.84% | 2.99% | 2.08% | 2.74% | 3.08% | 2.3% | 2.49% | 2.04% | 2.01% | 40.80% | <0.001 |
| Other/Self-pay | 0.0% | 1.53% | 1.38% | 8.46% | 5.84% | 1.54% | 1.64% | 2.76% | 4.59% | 1.68% | 5.27% | 3.99% | 2.3% | 33.48% | <0.001 |
| Hospital Characteristics | |||||||||||||||
| Bed size of Hospital depending on Location & Teaching Status | |||||||||||||||
| Small | 5.91% | 4.96% | 4% | 3.82% | 5.16% | 3.14% | 4.9% | 3.24% | 4.85% | 3.48% | 4.3% | 3.52% | 4.17% | -41.73% | <0.001 |
| Medium | 4.51% | 4.6% | 4.27% | 4.03% | 3.7% | 3.83% | 3.3% | 3.74% | 4.27% | 3.41% | 3.18% | 3.43% | 3.06% | -47.39% | <0.001 |
| Large | 4.39% | 4.45% | 3.76% | 4.91% | 4.34% | 3.79% | 3.71% | 3.63% | 4.27% | 3.16% | 3.27% | 3.36% | 3.49% | -25.79% | <0.001 |
| Hospital Location & Teaching Status | |||||||||||||||
| Rural | 3.73% | 2.69% | 3.4% | 4.11% | 3.48% | 3.84% | 4.26% | 2.24% | 5.78% | 3.75% | 2.57% | 3.74% | 3.88% | 3.87% | 0.425 |
| Urban Non-teaching | 4.26% | 4.75% | 3.87% | 4.87% | 4.51% | 4.23% | 3.5% | 3.92% | 4.26% | 2.91% | 3.78% | 2.92% | 3.29% | -29.48% | <0.001 |
| Urban Teaching | 4.73% | 4.55% | 3.9% | 4.57% | 4.23% | 3.44% | 3.87% | 3.58% | 4.21% | 3.34% | 3.19% | 3.56% | 3.5% | -35.14% | <0.001 |
| Admission Type | |||||||||||||||
| Emergency/Urgent | 5.55% | 5.2% | 4.86% | 5.81% | 4.99% | 4.84% | 4.62% | 3.78% | 4.83% | 3.79% | 4.24% | 4.28% | . | -−-29.67% | <0.001 |
| Elective | 3.73% | 3.81% | 2.98% | 3.94% | 3.64% | 3.16% | 3.3% | 3.45% | 3.61% | 2.57% | 2.83% | 2.97% | . | -25.59% | <0.001 |
| Admission Day | |||||||||||||||
| Weekdays | 4.23% | 4.42% | 3.66% | 4.51% | 4.2% | 3.74% | 3.74% | 3.56% | 4.11% | 3.1% | 3.47% | 3.32% | 3.39% | -−-24.78% | <0.001 |
| Weekends | 7.47% | 5.31% | 5.86% | 5.93% | 5.07% | 4.14% | 3.67% | 4.22% | 6.47% | 4.25% | 1.86% | 4.48% | 4.24% | -76.18% | <0.001 |
Stay updated, free articles. Join our Telegram channel

Full access? Get Clinical Tree


