Transcranial Duplex Imaging
Sheila M. Byrd-Raynor
Watson B. Smith
The aim of this chapter is to review the role of transcranial duplex imaging (TCI) in the routine vascular laboratory setting. TCI is an advanced ultrasound technique typically used in association with extracranial carotid and vertebral duplex scanning (see Chapter 8). This chapter discusses the hemodynamic consequences of carotid stenosis on the cerebral circulation and how these pertain to TCI examination findings. Illustrative diagrams of the cerebral circulation are introduced to assist both the new and the experienced user in the understanding of collateral flow patterns. Advanced ultrasound scanning techniques and tips for performing the study are also covered.
INDICATIONS AND APPLICATIONS
Although the brain has a high metabolic rate, neurons do not store significant energy reserves. Therefore, the brain is critically dependent on constant blood flow through the cerebral arteries to maintain normal activity. The brain is so intolerant of ischemia that an interruption of cerebral blood flow (CBF) can result in loss of consciousness in as little as 5 seconds. Hence, adequate CBF must be maintained throughout a variety of physiologic conditions, including a circulatory crisis. In this situation, the maintenance of flow to the brain is the number-one priority. Whereas the usual cardiovascular response is widespread vasoconstriction, the cerebral regulating vessels dilate. For these important reasons, there is clinical interest in assessing the cerebral circulation with noninvasive techniques such as transcranial Doppler ultrasound.
Vascular laboratories commonly receive requests to perform carotid duplex examinations on patients who have experienced a transient ischemic attack (TIA) or stroke. This is done to evaluate the extracranial common carotid artery (CCA) and its branches for atherosclerosis and other causes of neurologic symptoms. A high-grade stenosis or occlusion in the internal carotid artery (ICA) can act as a source of emboli to the brain and also produce hemodynamic impairment.1,2 Although such lesions are often symptomatic, there is a chance that no symptoms will occur and CBF could be virtually unaffected, even in the case of a total ICA occlusion. It is for these reasons that clinicians may request further information about the cerebral circulation based on TCI in order to determine the best management for an individual patient. In a simple statement, Dr. D. Eugene Strandness Jr, once reminded us that “In order to properly treat disorders of the vascular system, it is necessary to make a correct diagnosis and precisely define the location and extent of involvement.”
A routine carotid duplex scan can identify disease in the extracranial arteries to the brain, but it cannot predict the downstream effects on the cerebral circulation. To determine the effects of carotid disease on the brain for any individual, a transcranial Doppler examination (TCD) or TCI may be utilized. These tests directly measure flow velocities in the large arteries of the brain and define collateral flow patterns that can be useful for planning treatment. Unfortunately, many anatomic variations of the hemodynamically complete and well-balanced circle of Willis are commonly observed. Based on more than 50 radiologic and anatomic studies, Lippert and Pabst3 found that in about 50% of the population, at least one artery in the circle of Willis is either absent or hypoplastic. These anatomic variations reduce the collateral potential and increase the risk of stroke in patients with severe stenosis in an ICA.4 The circle of Willis behaves as a pressure equalizer and, therefore, takes part in the regulation of CBF before vasodilatation of the resistance arteries is involved. Consequently, knowledge of the compensatory capacity of the circle of Willis is crucial for neurosurgeons, vascular surgeons, and other specialists when a procedure in the intracranial or extracranial cerebral arteries is to be attempted.5 Such procedures include carotid endarterectomy and carotid angioplasty with stenting. In addition, TCI can provide an indirect assessment of the status of the distal cerebral vascular bed with regard to vasodilatation or vasoconstriction.6 In combination with a carotid duplex study, TCI constitutes a complete noninvasive cerebrovascular examination and can provide additional valuable information about a patient’s hemodynamic status. However, as mentioned previously, TCI is a targeted, advanced ultrasound examination—it should be used on selected patients and is not necessary in every individual who is referred for a carotid duplex scan.
ANATOMY OF THE INTRACRANIAL ARTERIES
The middle cerebral artery (MCA), anterior cerebral artery (ACA), posterior cerebral artery (PCA), and the basilar artery (BA) are considered the basal cerebral vessels. These are conducting vessels of the intracranial circulation and are muscular by nature. Compared with the aorta, which is approximately 25 mm in diameter, the basal cerebral vessels are small and range between 2 and 4 mm in diameter. The basal cerebral circulation sits within the relatively rigid bony structure of the cranium at the base of the brain. The intracranial contents are incompressible, and therefore, any increase in the volume of one component (brain tissue, blood, or cerebral spinal fluid) must be associated with a corresponding decrease in another. In contrast to the blood supply to many other organs, CBF must be kept within a narrow range, which averages approximately 55 mL/100 g of brain tissue/min.7 On the basis of studies on cerebral cortical slices by both K.A.C. Elliott (1903-1986) in Montreal and Henry McIlwain (1912-1992) in London, it was estimated that the majority of the oxidative metabolism of the brain is devoted to the support of neural conduction and transmission. It has been established that the brain stores no oxygen and has no significant stores of glycogen. Thus, failure of CBF due to vascular occlusion can cause irreversible damage after about 8 minutes. Similar damage will occur after about 90 minutes of severe hypoglycemia.
Blood flow is delivered to the brain via four main arteries in the neck—two ICAs and two vertebral arteries. For the purposes of this chapter, we refer to these extracranial vessels as inflow vessels to the brain because they carry blood flow to the cerebral circulation. At the base of the brain, the ICAs bifurcate to form the MCA and ACA. These vessels are commonly referred to as the anterior circulation. They are mainly responsible for delivering blood flow to the temporal, parietal, and frontal regions of the brain if there is no disease or anatomic anomaly. The two vertebral arteries join to form the BA after they have entered the foramen magnum. The BA courses toward the level of the anterior circulation vessels and then divides into the right and left PCAs. This system is referred to as the posterior circulation and delivers blood to the region of the brainstem.8
The intracranial vessels are referred to as outflow vessels because they directly supply the brain parenchyma. This terminology provides a simple way to relate the effects of extracranial arterial disease to the downstream effects measured in the cerebral circulation. Figure 9.1 presents the inflow/outflow concept as a stylized map of the extracranial and intracranial circulations, so the complete network can be easily visualized. The distinction between inflow and outflow vessels is drawn at the angle of the jaw. This level was chosen because it is approximately the point at which the extracranial carotid duplex examination ends and the TCI begins.
Circle of Willis
The anterior and posterior circulations are linked together by small connecting vessels, the single anterior communicating artery (ACoA) and a posterior communicating artery (PCoA) on each side; this unique structure is called the circle of Willis. These small connecting vessels form a link between separate flow systems in the brain—the anterior and posterior circulations via the PCoAs and the right and left hemispheres via the ACoA. This arrangement provides backup blood flow delivery should one or more of the contributing arteries become diseased. Although the circle of Willis appears to be an effective system for maintaining constant blood flow, less than half of the human population has a complete circle of Willis.3 The communicating arteries are frequently hypoplastic or absent, so the shunting of blood flow from one artery to another may be ineffective in times of need. It is difficult to determine the completeness and the capacity of the circle of Willis to supply collateral flow without carotid compression maneuvers; therefore, it is rarely assessed without a compelling indication.
Flow rates in the communicating arteries are normally small but sufficient to keep these vessels active. The flows arise from pressure phase delays between the right and left sides of the circle of Willis, which are the consequence of the asymmetry introduced by the brachiocephalic artery. Because the volume flow rates along these arteries are normally about two orders of magnitude smaller than the volume outflow rates in the other cerebral arteries,9 even magnetic resonance angiography (MRA) techniques may not be able to detect the presence of the communicating arteries in subjects with a complete circle of Willis or with anatomic variations involving these arteries. The most frequent anatomic variations reported in Lippert and Pabst3 are shown in Figure 9.2.
INTERPRETATION
Step 1. Goals of the Examination
For patients with extracranial carotid stenosis, the main goals of the TCI examination are to detect the presence or absence of collateral flow, determine the pathways of collateral flow (this may prove important for surgical planning or intervention), comment on the symmetry of the MCA velocities between hemispheres, and in some cases, relate the findings to established normal ranges. The TCI examination can also identify significant stenoses in the intracranial cerebral arteries. This information is meant to give the clinician an indication of how well the patient is or is not compensated for the inflow disease. Whether intracranial collateral flow is present or absent is largely determined by the hemodynamic effects of the extracranial carotid stenosis.
Step 2. Flow Velocities
There are well-established normal values for TCD flow velocities in the basal cerebral vessels, as listed in Table 9.1.10,11,12,13 These cerebral vessels have a consistent flow velocity relationship to each other. The MCA velocity is usually the highest because the majority of blood from the ICA flows directly into the MCA territory. The ACA and PCA supply less brain tissue, so their flow velocities are lower. This results in the important relationship of MCA > ACA > PCA = BA for the relative flow velocities. Recognizing this relationship is the first step in the interpretation of TCI studies. Mean Doppler flow velocities (time-averaged peak velocities) are generally used in TCI. These are often provided directly by the ultrasound machine, but they can also be calculated from peak systolic velocity (PSV) and end-diastolic velocity (EDV) using a simple equation similar to that for mean arterial blood pressure.
Mean velocity = (PSV − EDV)/3 + EDV
Flow velocities show a consistent decrease with increasing age.14 These findings correlate well with age-related studies of CBF.15 This supports the validity and sensitivity of TCD to estimate changes in CBF based on velocity data.
In nonimaging TCD studies, velocities are acquired at a zero-degree Doppler angle. However, because of the tortuosity of the intracranial vessels and the lack of an image, this
angle is only an assumption, and measurements are realistically acquired between 0 and 30 degrees. Because nonimaging TCD was the original study method in the 1980s, the majority of published data are based on these assumptions with regard to Doppler angle. When TCI became available, the technologist had the option to angle correct. Although this is a topic of ongoing debate, many vascular laboratories using TCI continue to leave the Doppler angle set at zero degree so their results can be compared with data reported in the literature.
angle is only an assumption, and measurements are realistically acquired between 0 and 30 degrees. Because nonimaging TCD was the original study method in the 1980s, the majority of published data are based on these assumptions with regard to Doppler angle. When TCI became available, the technologist had the option to angle correct. Although this is a topic of ongoing debate, many vascular laboratories using TCI continue to leave the Doppler angle set at zero degree so their results can be compared with data reported in the literature.
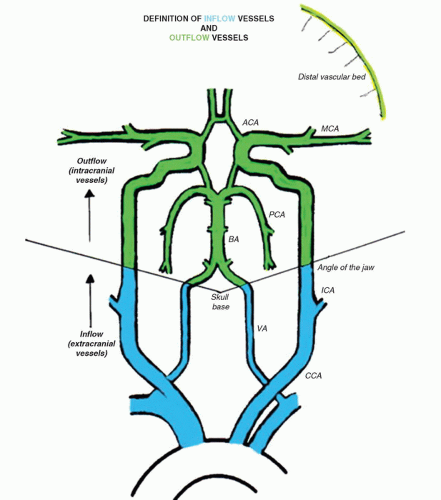 FIGURE 9.1. A stylized map of the main extracranial arteries (in blue), which will be considered inflow vessels, and the intracranial vessels (in green), which will be considered outflow vessels for the purposes of this chapter. (Copyright © Sheila Raynor.) |
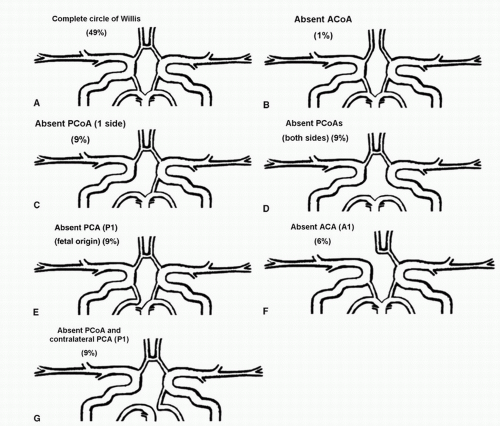 FIGURE 9.2. A-G, Anatomical variations of the circle of Willis. For each case, the absent artery and its frequency are indicated, according to Lippert H, Pabst R. Arterial Variations in Man: Classification and Frequency. Munich: JF Bergmann, 1985 (depicted on only one side, but it can also be absent on the other side). |
Step 3. Side-to-Side Comparisons
Although it is useful to compare TCI findings from a specific patient with published values, the most helpful comparisons are often within an individual. Comparison of the right and left MCAs, right and left ACAs, and right and left PCAs often gives a better idea of what the “normal” values are for that individual, because heart rate, blood pressure, and cardiac output are all matched. A patient referred for a TCI examination will often have extracranial pathology that affects interpretation of the intracranial findings. For example, in unilateral extracranial ICA stenosis, the downstream effects of a diseased side can be compared with a normal side.
Step 4. Hemodynamics and Indices
Before beginning a TCI examination, it is helpful to know whether to expect evidence of collateral flow based on simple hemodynamic principles. Figure 9.3 reviews the dynamics of an arterial stenosis. In a mild or moderate stenosis, there is a slight increase in velocity (dashed white line) through the stenosis but then a normalization of velocity distal to the stenosis, because very little energy is lost. If we look at the corresponding change in pressure (dashed green line), there is a mild decrease through the stenosis but a recovery of pressure distally. In effect, this indicates that the inflow to the cerebral circulation should be relatively unaffected by mild or moderate stenoses. In this situation, a TCI examination may not demonstrate any collateral flow patterns.
Some clinicians have questioned whether TCI adds any valuable information at lower levels of carotid stenosis. However, even at lower levels of stenosis, it can be useful to evaluate the symmetry or asymmetry between the right and the left hemispheres, because there may already be vasodilatory mechanisms activated to maintain CBF at a constant level. In this case, measuring a parameter such as pulsatility index (PI), resistance index (RI), or mean RI may show subtle changes that would otherwise go undetected. Indices have indeed been a major part of TCD interpretation in the past. They are thought to provide indirect information about the small regulatory vessels that are inaccessible by TCI but play an important
role in maintaining CBF at a constant level. The two major historical indices: PI16
role in maintaining CBF at a constant level. The two major historical indices: PI16
TABLE 9.1 NORMAL VALUES OF MEAN BLOOD FLOW VELOCITY FOR THE MIDDLE CEREBRAL ARTERY, ANTERIOR CEREBRAL ARTERY, POSTERIOR CEREBRAL ARTERY, AND BASILAR ARTERYa | |||||||||||||||||||||||||||||||||||
|---|---|---|---|---|---|---|---|---|---|---|---|---|---|---|---|---|---|---|---|---|---|---|---|---|---|---|---|---|---|---|---|---|---|---|---|
| |||||||||||||||||||||||||||||||||||
PI = (PSV − EDV)/mean velocity
and RI17
RI = (PSV − EDV)/PSV
are found throughout the literature on TCD.18 The introduction of these indices was originally based on the assumption of interplay between resistance and compliance of the vascular bed. The accuracy and tendency of these two indices are nearly identical in most clinical applications, and both indices seem to change with alterations in vasomotor tone seen in vasomotor reserve testing.19 Because the cerebral conduit vessels such as the MCA are relatively stiff, we assume that the cerebral arterial compliance is practically negligible, and therefore, the indices must represent changes in resistance. The problem with using PI or RI is that changes in resistance are often small and can be overshadowed by changes in cardiovascular factors such as blood pressure. Therefore, subtle changes in central factors may influence the PI or RI without the investigator being aware of such influence.
A recently derived parameter, the mean RI, could also prove useful.20
Mean resistance index = mean blood pressure (mmHg)/mean blood flow velocity (cm/s)
This index includes one of the major cardiovascular influences (blood pressure) in conjunction with flow velocity. Although systemic blood pressure is not often recorded during TCI examinations, it should become a more common part of the examination because it can aid in interpretation of relative changes. Of note, mean RI should not be confused with the term cerebral vascular resistance (CVR), which is calculated as the ratio of cerebral perfusion pressure (CPP) to CBF:
CVR = CPP (mmHg)/CBF (mL/100 g brain/min)
where CPP equals the mean arterial blood pressure minus the intracranial pressure. This ratio cannot be calculated from TCD ultrasound velocity measurements; however, the mean RI is an indicator of cerebral resistance, which can be derived from velocity data and does consider the effects of changes in mean arterial blood pressure on the flow velocities.
These indices are generally calculated only on the most distal velocity measurement taken from the MCA trunk in order to look for indirect evidence of vasodilatation or vasoconstriction of the downstream distal vascular bed. Indices are a useful way of showing differences in waveform shape in numeric terms. For example, if the PI for the MCA on the unaffected side is 1.0 whereas the PI for the MCA on the stenotic side is 0.5, this would reflect an important difference in the waveform shape and indicate an asymmetry between the hemispheres.
Step 5. Detection of Stenosis
As with stenosis in the extracranial carotid arteries, intracranial arterial stenosis is associated with characteristic changes in the normal flow pattern: a focal velocity increase, localized turbulence, and a poststenotic decrease in velocity (Fig. 9.4). Slow systolic acceleration and decreased pulsatility may be observed in the spectral waveform distal to the stenosis, and a Doppler bruit may
be present. Since many factors other than the presence of a stenosis influence the velocity of flow in the cerebral arteries (hematocrit, blood volume, blood pressure, cardiac output), absolute velocity thresholds for identifying intracranial arterial stenosis may not be reliable. In general, a focally increased mean velocity of ≥80 cm/s with a decrease of more than 30 cm/s distally is suggestive of a 50% or greater stenosis in the MCA. Higher velocity thresholds, such as ≥100 cm/s or ≥120 cm/s, provide a higher positive predictive value for 50% or greater MCA stenosis.21,22,23
be present. Since many factors other than the presence of a stenosis influence the velocity of flow in the cerebral arteries (hematocrit, blood volume, blood pressure, cardiac output), absolute velocity thresholds for identifying intracranial arterial stenosis may not be reliable. In general, a focally increased mean velocity of ≥80 cm/s with a decrease of more than 30 cm/s distally is suggestive of a 50% or greater stenosis in the MCA. Higher velocity thresholds, such as ≥100 cm/s or ≥120 cm/s, provide a higher positive predictive value for 50% or greater MCA stenosis.21,22,23
Stay updated, free articles. Join our Telegram channel

Full access? Get Clinical Tree


