Fig 1 a, b.
Cardiac magnetic resonance (MR) tagging. Magnetic strips are placed in the heart before contraction (diastole, a) and then followed throughout the cardiac cycle (systole, b) to measure the regional contraction of different portions of the heart. Note that in the left image the tag lines are curved, representing deformation of the myocardium. Cardiac MR is considered the reference standard for the measurement of regional function of the heart compared to other imaging modalities bulent jet during systolic LVOT obstruction is easily detected using suitable echo times (about 4 ms). MRI also detects the systolic anterior motion of the mitral valve, in a four-chamber or a short-axis view on the valvular plane [15], and can be used to document quantify mitral regurgitation. A newer technique is to measure the effective LVOT area by MR planimetry during systole, which overcomes the problem of interstudy variability of the LVOT gradient due to its independence from the hemodynamic status. There are preliminary data showing that assessment of diastolic function using MRI may be superior to the determination of conventional parameters by echocardiography. Analysis of the early untwisting motion of the myocardium could be helpful in assessing diastolic function [16]. Other functional changes that make use of myocardial tagging include a reduction in posterior rotation, reduced radial displacement of the inferoseptal myocardium, reduced 3-D myocardial shortening, and heterogeneity of regional function. With late enhancement imaging after the injection of gadolinium chelates (Fig. 4), MRI may help to detect areas of fibrosis, the prognostic value of which has been demonstrated [17, 18]. MRI also easily detects the acute and chronic changes after septal artery ablation [14, 19].
Assessment of Cardiomyopathies
In the visualization of left and right ventricular morphology and function, MRI is a noninvasive tool that has a high degree of accuracy and reproducibility. It is also superior to echocardiography in the determination of ventricular mass and volumes [8] and has become the gold standard for the in vivo identification of the phenotypes of cardiomyopathies [9].
Dilated Cardiomyopathy
In dilated cardiomyopathy, MRI is useful to study ventricular morphology and function (Fig. 2), by analyzing wall thickening, impaired fiber shortening, and end-systolic wall stress, which is a very sensitive parameter of a change in LV systolic function. It can also accurately assess the morphology and function of the right ventricle (RV), which is frequently affected in dilated cardiomyopathy. Late contrast-enhanced T1-weighted images are helpful in detecting the changes that occur in acute myocarditis. In this setting, increased gadolinium accumulation is thought to be due to inflammatory/hyperemia-related increased flow, slow wash-in/wash-out kinetics, and diffusion into necrotic cells [10]. There is evidence of similar changes in chronic dilated cardiomyopathy [11]. Contrast-enhanced MRI may also increase the sensitivity of endomyocardial biopsy by revealing inflamed areas, which aids in determining the appropriate biopsy site. Moreover, the presence and extent of myocardial late enhancement has been shown to predict clinical outcome [12, 13].
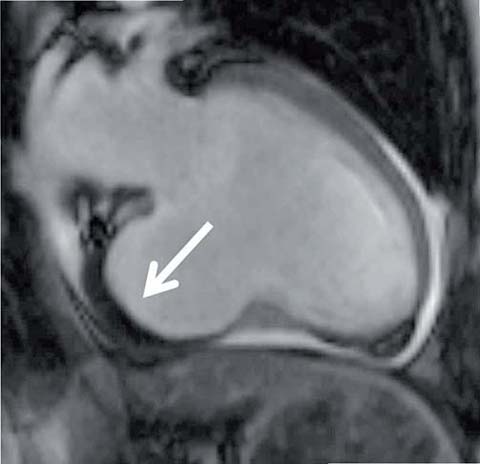
Fig 2.
Bright-blood cine image (SSMP) shows the vertical long-axis view of the left ventricle. There is an aneurysm at the base of the left ventricle; the thickened dark tissue in the aneurysm is the thrombus (arrow)
Hypertrophic Cardiomyopathy
Due to its high accuracy, MRI is increasingly used to assess morphology, function, tissue status, and degree of LV outflow tract (LVOT) obstruction in patients with hypertrophic cardiomyopathy (HCM) (Fig. 3). In addition, it is very accurate in assessing a LV mass, regional hypertrophy patterns, and the different phenotypes of HCM (e.g., apical HCM) [7]. Post-surgical changes after myomectomy can also be reliably monitored [14]. The tur-
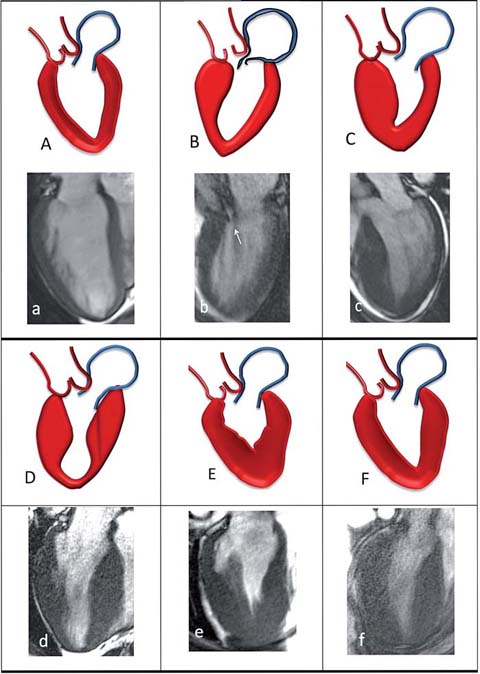
Fig 3.
Morphologic patterns in hypertrophic cardiomyopathy. , a normal LV; B, b sigmoid septum; C, c reversed septal contour; D, d mid-ventricular hypertrophy; E, e apical and F, f symmetric hypertrophic cardiomyopathy
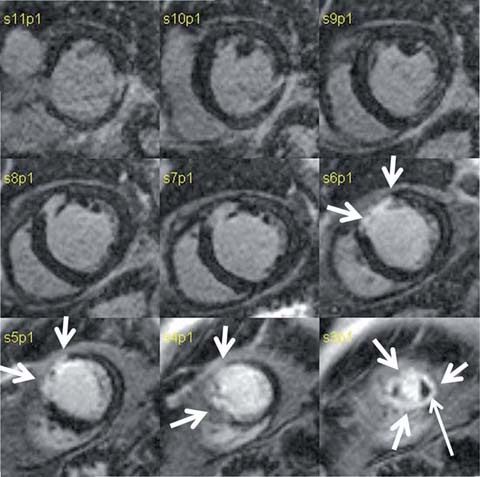
Fig 4.
Delayed gadolinium short-axis images of the heart in a patient with a history of myocardial infarction. The bright, high-signal portion of the anterior and anterolateral walls (arrows) of the left ventricle is the area of prior infarction. At the apex (lower right corner) the infarct involves the entire circumference of the heart; a small thrombus (thin arrow) is present at the apex as an area of dark tissue
Arrhythmogenic Right Ventricular Cardiomyopathy/Dysplasia
Arrhythmogenic right ventricular cardiomyopathy/ dysplasia (ARVC/D) is a rare disorder characterized by fibrofatty replacement of the RV free wall. MRI is usually the diagnostic imaging technique of choice for ARVC/D (Fig. 5) [20, 21] as it visualizes the ventricular cavities and walls, with excellent depiction of the myocardial anatomy. Although T1-weighted spin-echo images may reveal fatty infiltration, thinned walls, and dysplastic trabecular structures, these particular findings are actually quite infrequent. Moreover, the subjective assessment of RV wall thinning, wall motion abnormalities, and fatty infiltration of the myocardium by cardiac MR may be problematic. Thus, the international Task Force proposed revised criteria for the clinical diagnosis of ARVC/D. Major and minor criteria defined by cardiac MR contribute to the final diagnosis. Regional RV dysfunction associated with an increase of RV end-diastolic volume (> 110 mL/m2 for males and > 100 mL/m2 for females) and RV ejection fraction <40% are considered to be major criteria for the diagnosis of ARVC/D [22].
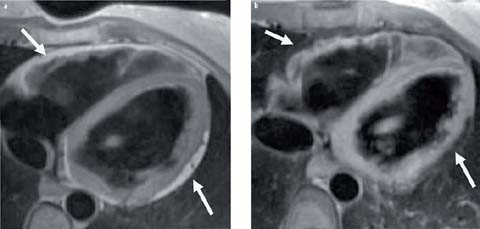
Fig 5 a, b.
Axial black-blood image of the heart. The T1 image (a) shows replacement of the myocardium by fat signal (arrows) in the left and right ventricles. The fat suppression T1-weighted image (b) shows dark signal at the corresponding sites of fat deposition
Restrictive Cardiomyopathy
Primary infiltration of the myocardium by fibrosis or other tissues leads to the development of restrictive cardiomyopathy, which is characterized by normal LV size and systolic function, severe diastolic dysfunction, and biatrial enlargement. Restrictive cardiomyopathy needs to be differentiated from constrictive pericarditis, which is a primary disease of the pericardium rather than the myocardium. LV size and thickness are quantified using gradient-echo sequences. Atrial enlargement is assessed in a four-chamber view. Mitral regurgitation should be assessed as well. The restrictive diseases that can be effectively assessed using MRI are described below [23, 24].
Sarcoidosis
Cardiac involvement in sarcoidosis produces symptoms in only 5% of patients but has been found in 20–50% of sarcoidosis patients at autopsy. During acute myocardial inflammation, sarcoid infiltrates are visible on MRI as intramyocardial, epicardial, or endocardial hyperhancement in a non-ischemic pattern with increased signal intensity on both T2-weighted and gadolinium-enhanced images [25, 26]. Occasionally, MRI may be useful in guiding endomyocardial biopsy.
Hemochromatosis, Iron Overload Conditions
Extensive iron deposits leading to wall thickening, ventricular dilatation, congestive heart failure, and death characterize cardiac hemochromatosis. Usually, the iron deposits are subepicardial; hence, endomyocardial biopsy may fail to confirm the diagnosis of hemochromatosis. MRI is able to detect the iron deposits because of the very strong paramagnetic properties of iron, which lead to extensive signal loss in native T1- and T2-weighted images. The pattern of focal signal loss in a dysfunctional myocardium associated with an abnormally “dark” liver might be sufficient to confirm the diagnosis of systemic hemochromatosis. However, iron loading in the myocardium does not always correlate with the degree of disease involvement. A particular sequence acquisition that allows T2* calculation (T2* mapping) has been established for the determination of cardiac iron concentrations. T2* values <20–25 ms indicate myocardial iron overload [27–29].
Amyloidosis
Infiltration of the heart by amyloid deposits is found in almost all cases of primary amyloidosis and in 25% of the cases of familial amyloidosis. MRI is the modality of choice for evaluating cardiac amyloidosis, by demonstrating LV wall thickening, reduced systolic function with decreased ejection fraction, and disproportionate atrial enlargement. The more specific finding, obtained on late-enhanced images, is a diffuse, heterogeneous pattern of increased signal intensity on delayed contrast-enhanced inversion recovery T1 images. During the selection of the most appropriate inversion time to null the normal myocardium signal intensity, the null point for the myocardium is often reached before the blood pool is nulled [30]. The shorter T1 of myocardium than of blood reflects the accumulation of amyloid material. This finding is of important value for the final diagnosis of cardiac amyloidosis.
Most recently, T1 mapping of the myocardium has been performed prior to gadolinium administration to determine “native” T1 times. In patients with cardiac amyloidosis, the native T1 time is longer than in normal subjects (e.g., average 1140 ms vs. 958 ms) [31].
Assessment of Pericardial Disease
MRI is ideally suited to evaluating the pericardium (Fig. 6). T1-weighted spin-echo imaging demonstrates the normal pericardium as a thin band (<2 mm) of low signal, bordered by epicardial and pericardial fat, which have a high signal. Because pericardial thickness varies at different levels, the thickness should be measured in axial images at the level of the right atrium, RV, and LV. A thickness >4 mm is considered abnormal and suggests fibrous pericarditis, either acute or chronic (due to surgery, uremia, tumor, infection or connective tissue disease) [32]. Contrast-enhanced MRI may help to better delineate the pericardium in cases of effusive-constrictive pericarditis. Breath-hold or real-time cine gradient echo images of the ventricles and phase-velocity mapping of the cardiac valves may be helpful in assessing the significance of pericardial pathology. The same approach is useful to detect other disorders, such as congenital absence of the pericardium, pericardial cysts, or pericardial effusion undetected by other modalities.
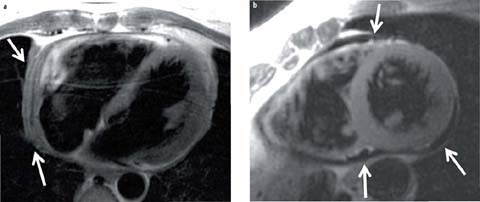
Fig 6 a, b.
Black-blood image of the heart in long (a) and short (b) axis reveals a thickened pericardium (arrows) and fluid (b, arrows). Pericardial effusion and thickening ⩾4 mm is abnormal
Myocarditis
In patients in whom myocarditis is suspected, cardiac MR has become the primary tool for the noninvasive diagnosis of myocardial inflammation. Myocarditis is defined as the inflammation of myocardial tissue and is an important underlying etiology of other myocardial diseases, such as dilated cardiomyopathy. The definitive diagnosis is frequently confirmed based on the clinical history, the clinical assessment, and non-invasive test results, in which case cardiac MR is nowadays crucial. Pericardial effusion has been reported in 32–57% of patients with myocarditis although it is not specific for the diagnosis. T2-weighted or T2 mapping images sensitively detect tissue edema because of the long T2 values of edematous tissue. However, the definitive diagnosis is usually based on the observation on late enhanced images of focal signal increase typically localized to the subepicardial regions of the LV and possibly extension through the ventricular wall. Late enhancement may be multifocal or diffuse in distribution but with no coronary artery disease distribution. Consensual diagnostic criteria using cardiac MR have been proposed (“Lake Louise Consensus Criteria”) for the diagnosis of acute myocarditis [33].
Evaluation of Cardiac and Paracardiac Masses
Primary cardiac tumors are rare (0.002–0.3% incidence) and the majority (75%) are benign. Metastatic tumors are 20- to 40-fold more common than primary tumors. MRI is ideal for delineating the morphologic details of a mass (including extent, origin, hemorrhage, vascularity, calcification, and effects on adjacent structures). Protocols include the combined use of axial black-blood sequences and axial bright-blood cine images. Functional MRI is useful to study the pathophysiologic consequences of a cardiac mass. Specifically, benign myxomas (the most common cardiac tumor) appear brighter than myocardium on T2 weighting; cine images may reveal the characteristic mobility of the pedunculated tumor. Lipomas (Fig. 7) appear brighter on spin-echo T1-weighted images. The diagnosis is verified by a decrease in signal intensity using a fat suppression technique [34].
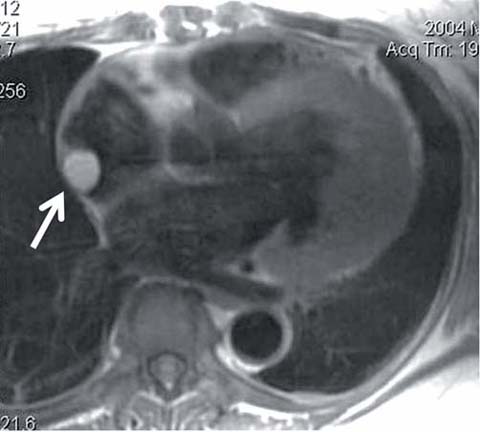
Fig 7.
Black-blood image of the heart in a long-axis view shows a mass (arrow) in the right atrium that was subsequently diagnosed as lipoma
Evaluation of Valvular Diseases
Echocardiography with color Doppler is usually the firstline imaging modality for diagnosing valvular diseases. MRI is generally reserved for use when other modalities fail or provide suboptimal information. Double inversion recovery sequences can show valve morphology as well as evidence of associated secondary changes (chamber dilatation, myocardial hypertrophy, post-stenotic changes in the great vessels, or thrombus in any of the chambers). Semi-quantitative assessment of valvular stenosis or regurgitation can be obtained by measuring the area of signal void on gradient-echo images. The duration or extent of the signal void correlates with the severity of the aortic stenosis, and the total area of signal loss with the severity of mitral regurgitation. This technique has a very high sensitivity (98%), specificity (95%), and accuracy (97%) for diagnosing aortic and mitral regurgitation. The signal void, however, is dependent upon certain scan parameters, such as echo time, voxel size, and image orientation relative to the flow jet. Phase-contrast MRI can be used to assess the severity of valvular stenosis (by measuring the peak jet velocity) by calculating the valve orifice area and the transvalvular pressure gradient.
Stay updated, free articles. Join our Telegram channel

Full access? Get Clinical Tree


