Using virtual histology and intravascular ultrasound (VH-IVUS), tissue characterization of restenotic in-stent neointima after drug-eluting stent (DES) and bare metal stent (BMS) implantation was assessed. VH-IVUS was performed in 117 lesions (70 treated with DESs and 47 treated with BMSs) with angiographic in-stent restenosis and intimal hyperplasia (IH) >50% of the stent area. The region of interest was placed between the luminal border and the inner border of the struts and tissue composition was reported as percentages of IH area (percent fibrous, percent fibrofatty, percent necrotic core, percent dense calcium) at the 2 sites of maximal percent IH and maximal percent necrotic core. Mean follow-up times between stent implantation and VH-IVUS study were 43.5 ± 33.8 months for BMS-treated lesions and 11.1 ± 7.8 months for DES-treated lesions (p <0.001). The 2 groups had greater percent necrotic core and percent dense calcium at maximal percent IH and maximal percent necrotic core sites, especially in stents that had been implanted for longer periods. In conclusion, this VH-IVUS analysis showed that BMS- and DES-treated lesions develop in-stent necrotic core and dense calcium, suggesting the development of in-stent neoatherosclerosis.
In-stent restenosis (ISR) after bare metal stent (BMS) implantation is generally considered a stable process with an early peak in intimal hyperplasia (IH) followed by regression, stabilization, and fibrotic maturation. However, histologic and angioscopic studies have shown emerging evidence of late de novo in-stent neoatherosclerosis. The aim of the present study was to assess the morphology of in-stent neointimal tissue in restenotic BMS-treated and drug-eluting stent (DES)-treated lesions using virtual histology and intravascular ultrasound (VH-IVUS) in an attempt to understand the in-stent restenotic process, especially in patients who present with late ISR.
Methods
From July 2005 to September 2006, VH-IVUS was performed in 151 patients with 151 lesions at the time of detection of an angiographic ISR at the Asan Medical Center, Seoul, Korea. Clinical presentations at time of ISR detection were stable angina in 124 patients (82%), unstable angina in 23 (15%), and non–ST-segment elevation myocardial infarction in 4 (3%). We excluded patients with hemodynamic instability, ST-segment elevation myocardial infarction necessitating primary percutaneous intervention, and an inability of the IVUS imaging catheter to cross the ISR lesion into the distal vessel. Sixty-five patients (42%) underwent target lesion revascularization for ISR. All patients signed written informed consent before the study.
Qualitative and quantitative angiographic measurements were done using standard techniques with automated edge-detection algorithms (CASS-5, Pie-Medical, Maastricht, The Netherlands) in the angiographic analysis center of the Cardiovascular Research Foundation, Seoul, Korea. Angiographic restenosis was defined as a diameter stenosis >50% at follow-up angiography.
VH-IVUS examination of angiographic ISR lesions was performed before any intervention and after intracoronary administration of nitroglycerin 0.2 mg. The 2.9Fr IVUS imaging catheter (Eagle Eye, Volcano Corp., Rancho Cordova, California) incorporated a 20-MHz electronic-array transducer. The transducer was advanced into the distal reference segment, and an imaging run was performed back through the stent to the proximal reference segments using a motorized transducer pullback (0.5 mm/s).
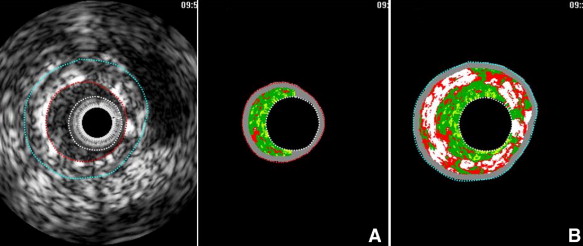
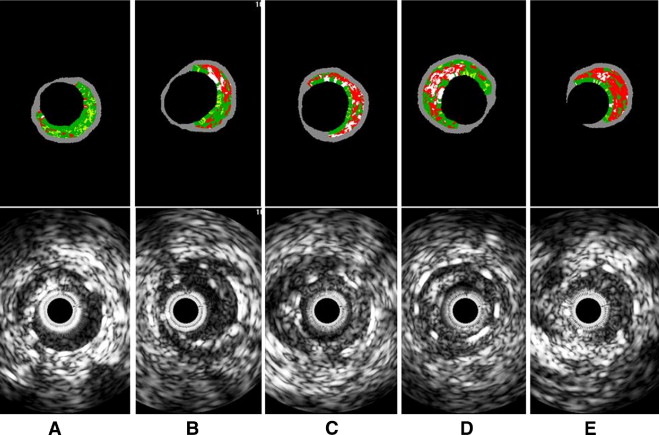
Using pcVH software (Volcano Corp.), the region of interest was placed between the luminal border and the inner border of the struts to avoid stent strut artifacts ( Figure 1 ). VH-IVUS analysis coded tissue as green (fibrotic), yellow-green (fibrofatty), white (dense calcium), and red (necrotic core). Each neointima tissue component was represented as percentages of measured total IH (percent fibrous, percent fibrofatty, percent necrotic core, and percent dense calcium; Figure 2 ). VH-IVUS analysis was performed at sites of maximal percent IH and maximal percent necrotic core. IH area was defined as stent minus intrastent lumen area, and percent IH was calculated as (IH area/stent area × 100). In 31 lesions (21%) the major mechanism of ISR was dominant stent underexpansion (stent area <5 mm 2 and IH <50%). In addition, 3 ISR lesions (2%) yielded images of poor quality. Thus, after excluding these 34 lesions with underexpansion and little neointima, 117 lesions with significant IH (>50% of stent area) were included in VH-IVUS analysis.


All values are expressed as mean ± SD (continuous variables) or count and percentage (categorical variables). Continuous variables were compared by unpaired or paired t test or nonparametric Mann-Whitney test; categorical variables were compared with chi-square statistics or Fisher’s exact test. All p values are 2-sided, and p values <0.05 were considered statistically significant. Stepwise multiple linear regression analysis was performed to assess independent predictors for percent necrotic core of the neointima, including variables such as age, gender, follow-up time, statin treatment, C-reactive protein, diabetes mellitus, stent type (DES vs BMS), and acute coronary syndrome. In addition, interactions between follow-up time and other presenting variables were assessed. Assumptions of linear regression were confirmed by residual plots and no relevant violations were found. A p value <0.05 were considered statistically significant. All statistical analyses were performed using SAS 9.1 (SAS Institute, Cary, North Carolina).
Results
Clinical and lesion characteristics and IVUS data are presented in Tables 1 and 2 . There were 47 BMS-treated lesions and 70 DES-treated lesions (24 lesions with sirolimus-eluting stents and 46 lesions with paclitaxel-eluting stents). Overall, follow-up time from implantation to ISR and VH-IVUS imaging was 24.1 ± 27.3 months; however, follow-up time in BMS-treated lesions (43.5 ± 33.8 months, range 94.4 to 119.2) was longer than in DES-treated lesions (11.1 ± 7.8 months, range 4.2 to 33.1, p <0.001).


