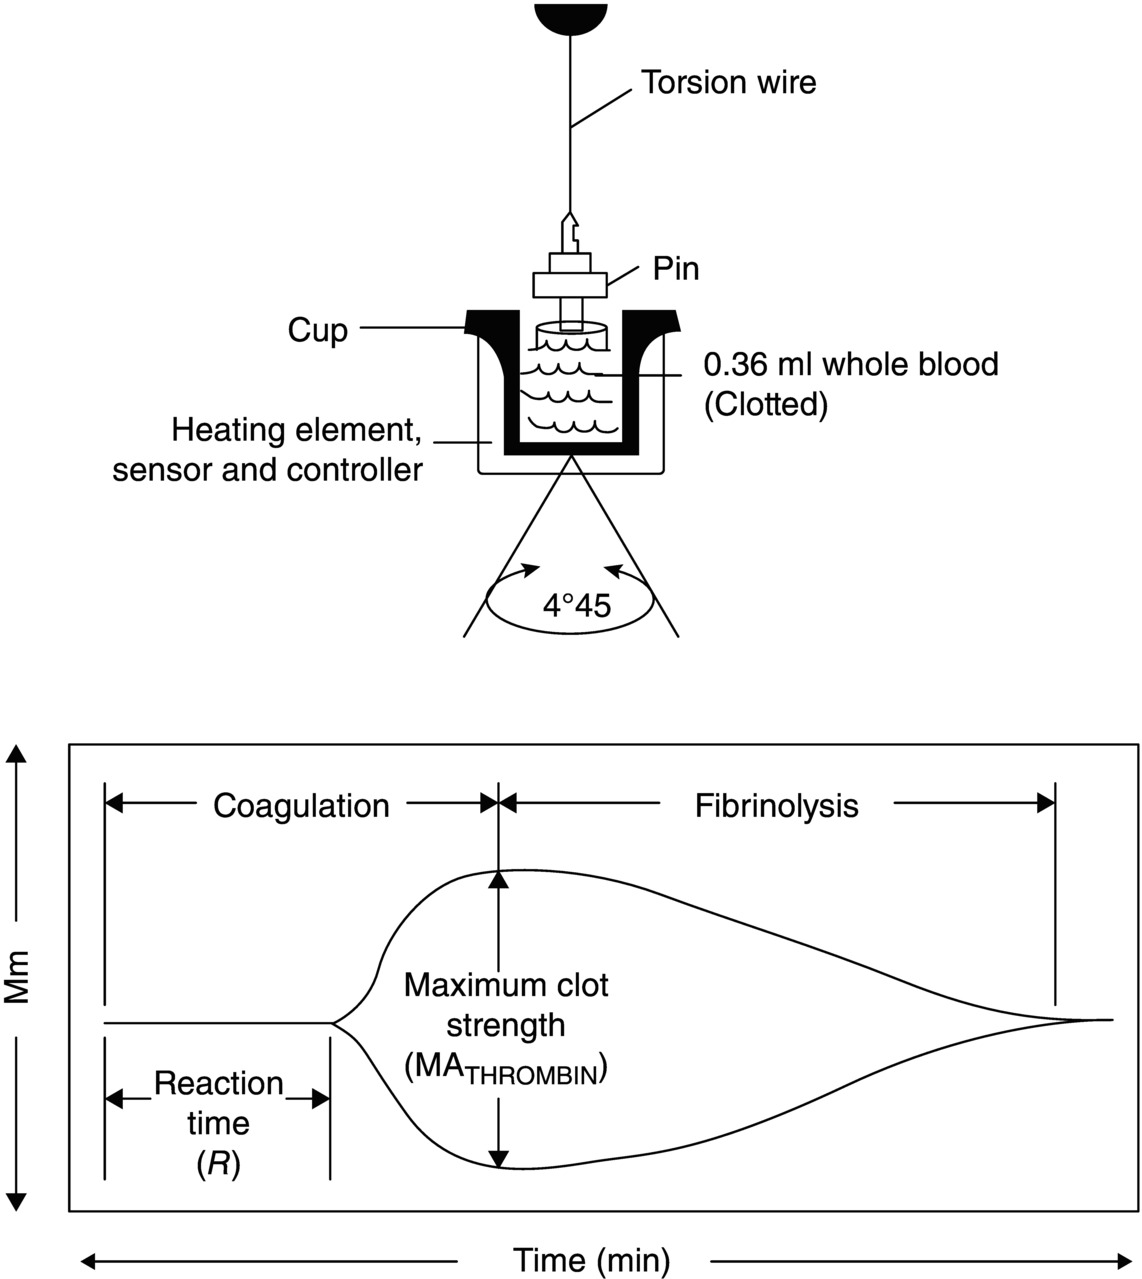
12 Udaya S. Tantry1, Vijay A. Doraiswamy3, Glenn Stokken3, Marvin J. Slepian3, and Paul A. Gurbel1,2,4 1 Sinai Hospital of Baltimore, Baltimore, MD, USA 2 Johns Hopkins University, School of Medicine, Baltimore, MD, USA 3 University of Arizona, Tucson, AZ, USA 4 Duke University School of Medicine, Durham, NC, USA Recent implementation of user-friendly, point-of-care (POC) and near-POC platelet function assays in translational research studies enhanced interest in the personalized antiplatelet therapy concept [1]. However, these ex vivo laboratory assays have limitations. In these assays, platelet function is measured in response to a specific agonist, and therefore, these assays may be adequate to assess pharmacodynamic response to an antiplatelet agent. Secondly, platelet function is measured in the presence of an anticoagulant, completely ignoring the contribution of thrombin and fibrin to thrombotic risk. The generation of thrombin and fibrin plays important roles in the formation of stable clot at the site of vascular injury in the presence of high arterial shear and subsequent ischemic event occurrence. Moreover, the positive predictive value of POC assays in identifying patients destined to have ischemic event occurrences is low, indicating that the assessment of platelet function alone may not be adequate to optimally identify high-risk patients for personalized antiplatelet therapy strategies. Therefore, in addition to the measurement of platelet response to a particular agonist, analyses of thrombin generation and viscoelastic characteristics of platelet–fibrin clot generation may enhance the prognostic value of the functional test. Thrombelastograph refers to the graphic display produced from measurement of the viscoelastic properties of platelet–fibrin clot generated in the whole blood under conditions of low shear. Viscoelastic properties can be determined by thrombelastography using the TEG (Haemonetics Corp, Braintree, MA, USA) or ROTEM (Tern International GmbH, Munich, Germany) devices. In the TEG assay, the change in clot strength is measured by the rotation of a torsion wire, whereas in the ROTEM assay, it is determined by an optical detector. Thrombelastography has been used extensively to monitor hemostasis during major surgical interventions such as liver transplantations, cardiovascular procedures, trauma, and neurosurgery [2]. In the TEG assay, blood anticoagulated with citrate is recalcified with the addition of calcium chloride and then activated by kaolin. The kaolin-activated blood is then placed in a cylindrical cup. Fibrin strands in the blood sample during clot formation first link the rotating cylindrical cup to a stationary pin suspended by the torsion wire. Changes in the viscoelasticity of the blood are transmitted to the pin. Pin movement is converted to an electrical signal by a transducer, and the magnitude of the electrical signal generated by the torque is plotted as a function of time [3] (Figure 12.1). Figure 12.1 Schematic of thrombelastograph system: a torsion wire suspending a pin that is immersed in blood. As the clot forms while the cup is rotated 45°, the pin will rotate depending on the strength of the platelet–fibrin bonds. Signal is discharged continuously that reflects the onset of clotting (reaction time [R]) and the clot strength (MA). (Source: Adapted from Gurbel PA et al., 2005 [3]. Reproduced with permission of Elsevier.) The platelet–fibrin clot assessment is dependent on (i) cellular (mainly platelets) and plasma components (procoagulant and fibrinolytic factors) and (ii) the activity and concentration of coagulation elements. The TEG trace can therefore provide continuous real-time information on the viscoelastic properties of the evolving clot from the time of initial fibrin formation through platelet aggregation, fibrin cross-linkage, and clot strengthening to clot lysis. In this assay, (i) the speed of clot generation, (ii) its strength, and (iii) its stability are calculated by a computer-generated program (Table 12.1). Table 12.1 Thrombelastography-derived parameters.
Thrombelastography and Other Novel Techniques

Reaction time (R value) (minutes)
The time elapsed from the initiation of the test until the point where the onset of clotting provides enough resistance to produce a 2 mm amplitude reading on the TEG tracing
It is most representative of the initiation phase of enzymatic clotting factors; this is the point at which all other platelet-poor plasma clotting assays are stopped (e.g., PT and aPTT)
K
A measurement of the time interval from the R time to the point where fibrin cross-linking provides enough clot resistance to produce a 20 mm amplitude reading
It assesses the rapidity of fibrin cross-linking
∝ Angle
The angle formed by the slope of a tangent line traced from the R to the K time measured in degrees. K time and the ∝ angle denote the rate at which the clot strengthens
It is most representative of thrombin’s cleaving of the available fibrinogen into fibrin![]()
Stay updated, free articles. Join our Telegram channel

Full access? Get Clinical Tree

 Get Clinical Tree app for offline access
