The left ventricular (LV) volumes, ejection fraction (EF), and dyssynchrony indexes for the 16 and 12 cardiac segments (Tmsv16-SD and Tmsv12-SD, respectively) were analyzed among nonadult, anthracycline-exposed long-term survivors of childhood cancer and compared with those of healthy controls using conventional and real-time 3-dimensional echocardiography (RT-3DE) with cardiac magnetic resonance (CMR) imaging in a prospective, cross-sectional, single tertiary center setting. Seventy-one survivors and gender-, body surface area-, and age-matched healthy controls were studied by conventional echocardiography and RT-3DE. Fifty-eight of the 71 survivors underwent also CMR. The survivors were evaluated in 2 groups. Group I consisted of 63 exposed to anthracyclines and group II consisted of 8 also exposed to cardiac irradiation. By RT-3DE, the group I survivors had a lower LVEF (57% vs 60%, respectively, p = 0.003) and larger body surface area–indexed LV end-systolic volume (31 vs 28 ml/m 2 , respectively, p = 0.001) than controls. The Tmsv16-SD was higher in group II than in I (1.93% vs 1.39%, respectively, p = 0.003). None of the survivors had an abnormal fractional shortening (<28%), but 10% had an LVEF <50% by RT-3DE. An LVEF <55% was detected in 45 of 58 (78%) of those imaged with CMR. In conclusion, RT-3DE seems to detect more abnormalities in cardiac function than conventional echocardiography following childhood cancer therapy. The LV dyssynchrony indexes derived from RT-3DE appear potentially useful in assessing the early signs of cardiotoxicity between anthracycline and cardiac irradiation exposed long-term survivors of childhood cancer.
Anthracyclines and radiotherapy, both with cardiotoxic side effects, are used in the treatment of many childhood malignancies. The Children’s Oncology Group recommends transthoracic 2-dimensional echocardiography for the assessment of the left ventricular (LV) function among the survivors due to its broad availability and noninvasiveness. However, the M-mode–derived fractional shortening remains insensitive in detecting subtle changes in cardiac function. The real-time, 3-dimensional echocardiography (RT-3DE) is a well-validated method for the assessment of the LV dimensions and ejection fraction (EF) not relying on geometrical assumptions. Many factors, including the synchronicity of the LV contraction, impact the function. Indexes for assessing the LV mechanical dyssynchrony can be derived from the time-volume data provided by the RT-3DE. There is an obvious need for more sensitive methods for cardiotoxicity screening especially in the pediatric population with a long life expectancy. Our aim was to evaluate the prevalence of LV dysfunction among asymptomatic childhood cancer survivors by means of conventional echocardiography, RT-3DE, and cardiac magnetic resonance (CMR) imaging and to test whether the RT-3DE is a method employable in the screening.
Methods
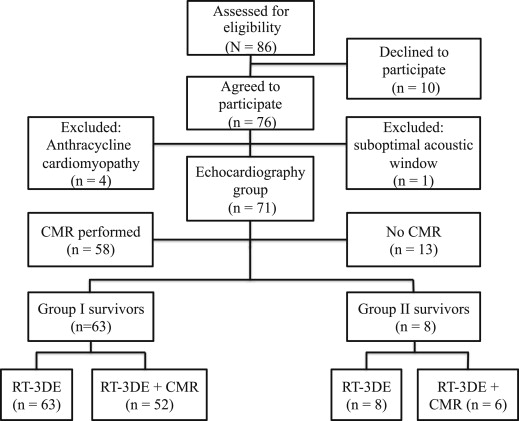
All consecutive, long-term survivors of childhood cancer in remission attending the population-based, pediatric hematology-oncology service of the Tampere University Hospital (Tampere, Finland) from February 2010 to June 2011, and having received anthracyclines as part of their chemotherapy no <5 years earlier, were prospectively enrolled. Survivors with a congenital heart disease were excluded. Of the 86 initially recruited 76 (42 women and 34 men) agreed to participate. We studied survivors without previously diagnosed cardiotoxicity, and thus 4 women with a previous diagnosis of late-onset anthracycline-associated cardiomyopathy were excluded. One woman with a suboptimal acoustic window was also excluded, resulting in a total of 71 survivors in the study cohort ( Figure 1 ). The total cumulative anthracycline dose was calculated per the recommendations of the Children’s Oncology Group ( www.survivorshipguidelines.org ). A total of 71 healthy volunteers without cardiac pathology were recruited as gender-, body surface area-, and age-matched controls. This study complies with the Declaration of Helsinki. The Institutional Review Board of the Tampere University Hospital approved the study protocol. All patients/controls and their legal guardian(s) gave their written informed consent.
The key clinical data on the survivors and controls are listed in Table 1 . The former were divided into 2 groups by therapy. Group I consisted of 63 anthracycline-exposed survivors, group II consisted of 8 exposed to both anthracyclines and cardiac irradiation, and controls I and II of their respective controls. The average cumulative cardiac radiation dose was deduced from the radiotherapy records (median 10.0 Gy [range 3.6 to 12.0]). Electrocardiogram was obtained from all survivors.
| Variable | Group I (n = 63) | Control I (n = 63) | p Value | Group II (n = 8) | Control II (n = 8) | p Value |
|---|---|---|---|---|---|---|
| Women | 31 (49) | 31 (49) | 6 (75) | 6 (75) | ||
| Men | 32 (51) | 32 (51) | 2 (25) | 2 (25) | ||
| Age (yrs) | 14 ± 3 | 14 ± 3 | 0.099 | 13 ± 3 | 14 ± 3 | 0.020 |
| Height (cm) | 161 ± 16 | 162 ± 17 | 0.012 | 152 ± 15 | 154 ± 13 | 0.585 |
| Weight (kg) | 55 ± 17 | 54 ± 17 | 0.147 | 46 ± 13 | 47 ± 11 | 0.376 |
| Body surface area (m 2 ) | 1.6 ± 0.3 | 1.6 ± 0.3 | 0.573 | 1.4 ± 0.3 | 1.4 ± 0.2 | 0.435 |
| Acute lymphoblastic leukemia | 31 (49) | 0 | ||||
| Acute myeloid leukemia | 3 (5) | 6 (75) | ||||
| Solid tumor | 29 (46) | 2 (25) | ||||
| Age at diagnosis (yrs) | 4 (0–14) | 5 (0–13) | ||||
| Follow-up (yrs) | 7 (5–18) | 6 (5–12) | ||||
| Cumulative anthracycline dose (mg/m 2 ) | 218 (80–386) | 382 (163–454) | ||||
| Cardiac irradiation | 0 | 8 (100) | ||||
| Relapse | 1 (2) | 3 (38) | ||||
| Allogeneic stem cell transplantation | 0 | 6 (75) |
Echocardiographic examination was performed using the iE33 ultrasound machine (Royal Philips Electronics, Philips Healthcare, Bothell, Washington). A 2-dimensional, Doppler, and M-mode examination was performed from the standard subcostal, apical, and parasternal views using the S8-3, S5-1, or X5-1 transducers. All measurements in the M-mode were made according to the recommendations of the American Society of Echocardiography, and the average of 3 cardiac cycles used in the analysis. M-mode–derived LV mass was calculated according to the American Society of Echocardiography recommendation and mass/volume ratio using the LV volume derived from the formula of Teichholz. RT-3DE was performed in the left lateral semirecumbent position using either the X3-1 or the X5-1 matrix-array transducers. The RT-3DE full-volume data sets were acquired from the apical 4-chamber view during 4 consecutive cardiac cycles and normal breathing. At least 3 data sets were acquired for each individual, stored off-line, and the highest quality data set selected for analysis.
A single investigator (KY) performed the off-line analysis on a Q-lab workstation (Philips Q-lab, version 8.1; 3DQA; Philips Healthcare, Bothell, Washington). The frame immediately before the full closure of the mitral valve was selected as end-diastole and that immediately before the full closure of the aortic valve as end-systole. The septal and lateral mitral annuli in the 4-chamber, the anterior and inferior mitral annuli in the 2-chamber view, and the LV apex in either of the 2 were set in both the end-diastolic and end-systolic frames. A semiautomated endocardial border detection was used to track the LV endocardium throughout the entire cardiac cycle. The software created a 3-dimensional dynamic model representing the cardiac cycle in the whole LV cavity and divided it into 16 segments excluding the apex as defined by the American Society of Echocardiography. The software displayed the LV end-diastolic and end-systolic volumes, EF, and time-volume data for each segment. The time to reach the minimum systolic volume for each of the segments was calculated. The dyssynchrony index for the 16 segments (Tmsv16-SD) was defined as the SD of this time as a percentage of the RR interval to correct for differences in heart rate between subjects. The maximum time difference to reach the minimum regional volume between the segments reaching the volume earliest and latest was calculated as a percentage of the RR interval (Tmsv16-Dif). The corresponding measurements (Tmsv12-SD and Tmsv12-Dif) were also performed for the 12 segments (6 basal and 6 middle) with the more synchronous the ventricular contraction, the lower the dyssynchrony index obtained. Two investigators (KY and AE) measured independently 20 randomly selected data sets for interobserver and the former independently 20 data sets twice for intraobserver variability.
Fifty-eight of the 71 survivors also agreed to undergo CMR imaging as previously described. LV end-diastolic and end-systolic volumes and LVEF were measured. The CMR data of Robber-Visser et al on 60 healthy children of the same age range with comparable size and imaged with comparable CMR method were employed as reference. Due to ethical reasons, CMR on the healthy controls was not performed.
The statistical analysis was performed using the IBM SPSS Statistics version 21 (IBM Corp., Armonk, New York) software. The data are presented as frequencies and percentages for categorical data, mean ± SD for normally distributed data, or median and range in case of non-normality. The group means were compared between the survivors and controls with the paired-samples t test. The Mann-Whitney U test was employed for the medians and the independent samples t test for the means among the survivors. The correlations were assessed with the Pearson correlation coefficients with data normally distributed and the Spearman’s rho test in case of non-normality. The linear regression analysis was used to establish the predictors for Tmsv16-SD. All tests were 2-sided and p <0.05 considered significant. Intraclass correlation coefficients were calculated for the intra and interobserver variabilities for RT-3DE measurements. An agreement between CMR and RT-3DE assessment of LV volumes and EF was evaluated using the Bland-Altman analysis. With none of the controls having an RT-3DE LVEF <50% and their −2 SD for LVEF lying at 51%, we concluded 50% to be the appropriate lower normal limit by RT-3DE, in accordance with published reference values on children. The lower normal limit for CMR-derived LVEF was set at 55% as deduced from literature. The upper normal limits for dyssynchrony indexes were derived from +2 SD of our 71 healthy controls: Tmsv16-SD 2.26% and Tmsv12-SD 2.11%, in line with published.
Results
None of the controls had a fractional shortening <28% or an RT-3DE LVEF <50%. The echocardiographic data of the 71 survivors and controls and the CMR data of 58 survivors are listed in Table 2 . The M-mode classified 7 of the survivors with an abnormal LVEF by RT-3DE to have a normal LV function (fractional shortening). One case-control pair was left out of the dyssynchrony analysis due to a stitch artifact. Three of the 70 survivors (4%) had an abnormally high Tmsv16-SD, and 4 of 70 (6%) had a high Tmsv12-SD, but all had QRS-duration within normal limits in electrocardiograms.
| Variable | Group I (n = 63) | Control I (n = 63) | p Value | Group II (n = 8) | Control II (n = 8) | p Value |
|---|---|---|---|---|---|---|
| M-mode | ||||||
| LV end-diastolic dimension | 0.8 ± 0.8 | 0.7 ± 0.9 | 0.282 | 0.3 ± 0.8 | 0.4 ± 1.1 | 0.831 |
| LV end-systolic dimension | 1.1 ± 0.7 | 0.7 ± 0.8 | 0.003 | 0.8 ± 0.6 | 0.4 ± 0.8 | 0.289 |
| Interventricular septum diastolic diameter | 0.4 ± 0.8 | 0.5 ± 1.0 | 0.535 | 0.4 ± 1.0 | 1.0 ± 0.8 | 0.220 |
| LV posterior wall diastolic diameter | −0.2 ± 0.7 | −0.2 ± 0.6 | 0.950 | −0.5 ± 0.4 | 0.1 ± 0.6 | 0.089 |
| LV mass (g/m 2 ) | 75 ± 13 | 75 ± 16 | 0.975 | 63 ± 9 | 74 ± 13 | 0.119 |
| LV mass/volume ratio (g/ml) | 1.1 ± 0.2 | 1.1 ± 0.2 | 0.558 | 1.0 ± 0.1 | 1.2 ± 0.1 | 0.039 |
| Fractional shortening (%) | 33 ± 3 | 35 ± 3 | 0.003 | 33 ± 2 | 35 ± 3 | 0.045 |
| RT-3DE | ||||||
| LV end-diastolic volume (ml/m 2 ) | 73 ± 10 | 70 ± 9 | 0.060 | 67 ± 7 | 72 ± 8 | 0.218 |
| LV end-systolic volume (ml/m 2 ) | 31 ± 6 | 28 ± 5 | 0.001 | 30 ± 5 | 30 ± 6 | 0.963 |
| LV stroke volume (ml/m 2 ) | 41 ± 7 | 42 ± 6 | 0.890 | 38 ± 6 | 43 ± 3 | 0.039 |
| LVEF (%) | 57 ± 6 | 60 ± 4 | 0.003 | 56 ± 7 | 59 ± 5 | 0.131 |
| Tmsv16-SD (%) | 1.39 ± 0.43 | 1.49 ± 0.40 | 0.164 | 1.93 ± 0.72 | 1.37 ± 0.24 | 0.098 |
| Tmsv16-Dif (%) | 5.13 ± 1.60 | 5.48 ± 1.57 | 0.208 | 6.92 ± 2.01 | 5.56 ± 1.19 | 0.192 |
| Tmsv12-SD (%) | 1.19 ± 0.44 | 1.30 ± 0.43 | 0.207 | 1.76 ± 0.48 | 1.11 ± 0.35 | 0.008 |
| Tmsv12-Dif (%) | 3.95 ± 1.51 | 4.33 ± 1.50 | 0.178 | 5.92 ± 1.64 | 3.85 ± 1.43 | 0.007 |
| Frame rate (frames/s) | 23 ± 3 | 25 ± 4 | <0.001 | 25 ± 3 | 24 ± 3 | 0.554 |
| CMR imaging | (n = 52) | (n = 6) | ||||
| LV end-diastolic volume (ml/m 2 ) | 90 ± 14 | — | — | 82 ± 20 | — | — |
| LV end-systolic volume (ml/m 2 ) | 45 ± 9 | — | — | 41 ± 11 | — | — |
| LV mass (g/m 2 ) | 69 ± 12 | — | — | 63 ± 16 | — | — |
| LV mass/volume ratio (g/ml) | 0.8 ± 0.1 | — | — | 0.8 ± 0.1 | — | — |
| LVEF (%) | 50 ± 6 | — | — | 50 ± 6 | — | — |
Among the survivors, the RT-3DE LVEF correlated negatively with the Tmsv16-SD (r = −0.44, p <0.001), Tmsv12-SD (r = −0.34, p = 0.005), Tmsv16-Dif (r = −0.43, p <0.001), and Tmsv12-Dif (r = −0.27, p = 0.024). The body surface area–indexed LV end-systolic volume correlated positively with Tmsv16-SD (r = 0.32, p <0.007). No significant correlation was found between the RT-3DE LVEF or Tmsv16-SD and the age at study, at diagnosis, at follow-up time, or cumulative anthracycline dose (data not shown). In the linear regression analysis, the Tmsv16-SD was predictable with the RT-3DE LVEF (p <0.001) and cardiac irradiation (p = 0.002) with an adjusted R 2 of 0.28.
Figure 2 shows the data on the fractional shortening derived by M-mode and LVEF derived by RT-3DE and CMR among 58 survivors with all imaging performed. None of them had an abnormal fractional shortening. LVEF <50% was detected by RT-3DE in 6 of 58 (10%) and an abnormal LVEF (<55%) by CMR in 45 of 58 (78%). Even with the CMR-derived cutoff being was set <50%, 29 of 58 (50%) had an abnormal LVEF. Of those who underwent both RT-3DE and CMR, all 6 with an abnormal LVEF by RT-3DE also had an abnormal LVEF by CMR. The LV end-diastolic and end-systolic volumes were larger as measured by CMR than RT-3DE (89 ± 14 vs 73 ± 11 ml/m 2 and 44 ± 9 vs 31 ± 7 ml/m 2 , p <0.001, for both, respectively).


