The Working Heart
More than a century ago, Woods (1892) related the different shapes of the right and left ventricles (see Chapter 1) to the law of Laplace. Using measurements of wall thickness and radii of curvature, and assuming that wall stress is uniform throughout the heart, Woods noted that “the thickness of the heart at any place bears a direct proportion to the relative tension at that place.” This allowed him not only to predict that left ventricular pressure is higher than that in the right ventricle, but that the difference is less in the neonatal heart where, as we now know, pulmonary artery pressure is the same as that in the aorta.
Adaptation of the shape of the heart to the pressure developed in its cavities explains architectural differences in the ventricles of various animals (Fig. 12-1). For example, in the giraffe left ventricle, where systolic pressure often exceeds 300 mm Hg, wall stress is kept low by thick walls and a narrow cavity, whereas the amphibian ventricle, which generates low pressures, is thin-walled and almost spherical. The law of Laplace also explains the different shapes of the right and left ventricles (Fig. 12-2; see also Fig. 1-4). The right ventricle, which develops a relatively low systolic pressure, is crescentic and has a large radius of curvature, while the more conical left ventricle has a smaller radius of curvature that allows it to generate high intraventricular pressures with the same wall stress as the right ventricle.
The interventricular septum normally functions as part of the left ventricle, and so moves toward the free wall of the left ventricle as the heart ejects (Weber et al., 1981). However, when right ventricular pressure is abnormally elevated, for example, in pulmonary hypertension, the septum contracts “paradoxically” and moves away from the left ventricular cavity to assist in right ventricular ejection.
The Work of the Heart
The heart performs two types of work: external work that propels blood from the left ventricle into the aorta and from the right ventricle into the pulmonary artery, and internal work that is expended during systole to alter the shape of the heart as it contracts, and to stretch elasticities and lengthen viscous elements in the walls of the contracting ventricles. Although much of the energy expended to perform internal work is degraded to heat when the heart relaxes, and so reduces the efficiency of cardiac performance, some of the energy used to stretch elasticities can help eject blood (see below).
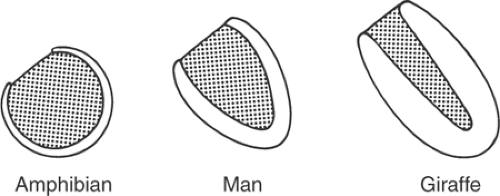 Fig. 12-1: Ventricular cavity shape. The thin-walled ventricle of the amphibian heart, which develops a low pressure, is almost spherical, while that of the thicker human left ventricle, which develops a much higher pressure, is conical. In the giraffe, where left ventricular systolic pressure is extremely high, the cavity of the thick-walled ventricle is almost tubular. |
External Work
Stroke Work
The work performed during each cardiac cycle to eject blood under pressure into the aorta and pulmonary artery is the stroke work (sometimes called pressure–volume work). This can be estimated by multiplying the volume of blood ejected during each stroke (the stroke volume, abbreviated SV) by the average pressure at which the blood is ejected (P):
The product of pressure (dyn/cm2) and volume (cm3) has the correct cgs units for work (dyn cm). In the left ventricle, when mean ejection pressure is 105 mm Hg and stroke volume is 70 mL, stroke work is 7,350 mm Hg mL, which in cgs units is ∼9.3 × 10⁶ dyn cm.
Because aortic and pulmonary artery pressures first rise and then fall during ejection (see Chapter 11), stroke work is more accurately calculated as the integral of pressure and the volume change:
where P is the pressure at which each increment (dV) of the stroke volume is ejected. The total external work is also the area within the pressure–volume loop (Fig. 12-3). For most purposes, left ventricular stroke work can be estimated simply by multiplying stroke volume by either peak or mean aortic pressure.
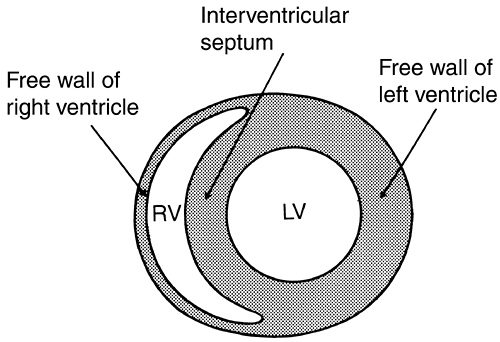 Fig. 12-2: Cross section of the human heart showing the thin-walled, crescentic right ventricle (RV), where systolic pressure is ∼1/5 that of the thick-walled, narrower left ventricle (LV). The interventricular septum normally functions as part of the LV. |
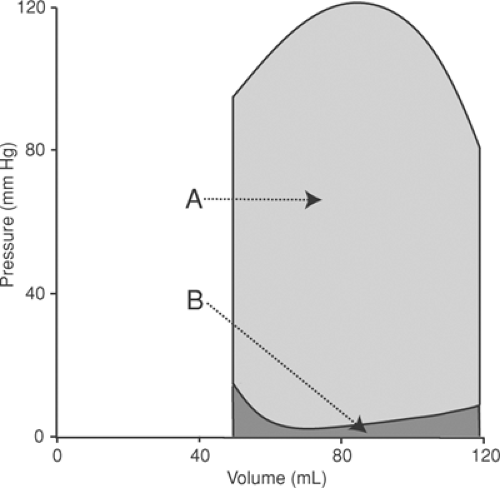 Fig. 12-3: The external work of the left ventricle during each cardiac cycle is equal to the work performed by the ventricle, which is the area within the pressure–volume loop (A) plus the work contributed by the inertia of the venous return and by atrial systole (B). |
Stroke volume is end-diastolic volume (EDV, the volume in the ventricle when ejection begins) minus end-systolic volume (ESV, the residual volume at the end of ejection). This allows Equation 12-1 to be expanded as:
Each of the determinants of stroke work is controlled differently. EDV is determined by three variables; two, which together define the preload, are venous return and ESV, and the third is the lusitropic state of the ventricle. ESV is determined by EDV and the volume of blood that is ejected (stroke volume), which in turn reflects the inotropic state of the ventricle and the afterload. At any steady state the stroke volumes of the two ventricles are the same, but because pulmonary artery pressure is approximately one-fifth that of aortic pressure, the stroke work of the right ventricle is less than that of the left ventricle.
Preload and Afterload
Preload and afterload, which are most accurately defined as wall stresses, are related to but are not the same as systolic and diastolic chamber pressures. The relationships are determined by the law of Laplace, which states that wall stress is directly proportional to chamber pressure and chamber diameter, and inversely proportional to wall thickness (see Chapter 11). These variables all change as the heart ejects; chamber size decreases and wall thickness increases, both of which reduce wall stress; pressure, which initially rises and then falls, has mixed effects. Overall, the net effect is a marked fall in wall stress during ejection (Fig. 12-4) that has important effects on the efficiency of cardiac performance (see below).
Resistance and Impedance
Aortic pressure is determined by the amount of blood ejected into the aorta by the left ventricle and aortic impedance. Although impedance is often equated to resistance, they are not the same, nor are they determined in the same regions of the arterial system.
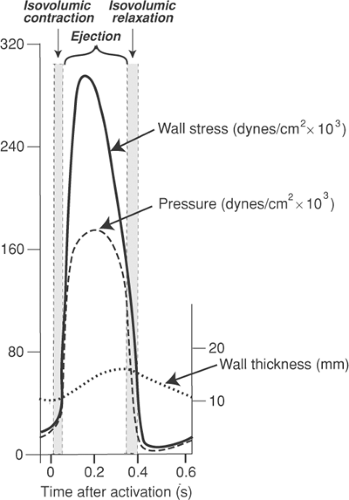 Fig. 12-4: Changes in wall stress during ejection by the normal left ventricle. The initial rise in pressure (dashed line) causes wall stress (solid line) to increase rapidly. However, left ventricular wall thickening (dotted line) and the subsequent fall in pressure and cavity volume cause a marked fall in wall stress during ejection. |
Peripheral resistance, the major determinant of the rate at which blood flows out of the arteries to perfuse the tissues, is regulated largely by the diameter of small arterioles, often called “resistance vessels,” that control blood flow into the capillaries. Vascular resistance is defined as the ratio between the pressures at the arterial and venous sides of a vascular bed (ΔP) and the flow through the bed (Q).

Aortic impedance, which determines the peak level of pressure when blood is being ejected from the left ventricle, is influenced by the elasticities of the aorta and other large arteries as well as by the caliber of the resistance vessels. Unlike resistance, which describes the relationship between cardiac output and the difference between the mean pressures in the arteries and veins (Equation 12-4), impedance is also influenced by the changes in pressure and flow velocity that occur throughout the cardiac cycle. For example, systolic blood pressure becomes higher and diastolic pressure becomes lower when impedance is increased by loss of elasticity in the large arteries, which occurs during normal aging and is accelerated by arteriosclerotic changes in the large arteries. Because calculation of impedance is complex, resistance is almost always used for clinical measurements.
The distinction between resistance and impedance has important implications; consider, for example, two patients in whom cardiac output and venous pressure are the same, but in whom aortic pressures are 110/80 and 170/50 mm Hg (the latter is often called “systolic hypertension”). Because mean aortic pressure (which can be estimated as aortic diastolic pressure + 1/3 pulse
pressure) is ∼90 mm Hg in both patients, their peripheral resistances are also the same. However, the left ventricle ejects against a higher afterload in the patient with systolic hypertension because aortic impedance is greater.
pressure) is ∼90 mm Hg in both patients, their peripheral resistances are also the same. However, the left ventricle ejects against a higher afterload in the patient with systolic hypertension because aortic impedance is greater.
Kinetic Work
The heart performs a small amount of kinetic work when it imparts velocity to the blood as it leaves the ventricles. The kinetic energy of this moving stream of blood, according to the laws of physics, is proportional to the square of the velocity at which blood leaves the ventricle:
where m is the mass of blood moving out of the left ventricle into the aorta or from the right ventricle to the pulmonary artery, and v is the velocity at which this blood crosses the semilunar valves.
The kinetic work of the left ventricle is normally less than 5% of the stroke work, but in the right ventricle, where systolic pressure is low, kinetic work represents a greater proportion of the smaller amount of total work performed. Because stroke volume contributes to both m (cm3) and v2 [(cm3/s)2] in Equation 12-5, kinetic work is proportional to the cube of the stroke volume. For this reason, when stroke volume is abnormally high (as occurs in aortic insufficiency or severe anemia), kinetic work can represent a significant portion of the work of the left ventricle (although rarely more than 10%).
Kinetic work contributes to the “useful” work of the heart because most of the kinetic energy is converted to pressure as velocity slows when blood moves through the circulatory system. For this reason kinetic work, like stroke work, contributes to the “useful” work that pumps blood through the body.
Atrial Work
The work done when the atria pump blood into the ventricles makes only a negligible contribution to cardiac energy expenditure because atrial systole propels only a fraction of the stroke volume at a low pressure. Even though it adds little to overall energy utilization, atrial systole is an important determinant of ventricular EDV because of its timing (see Chapter 11).
Work Done to Fill the Ventricle
The initial phase of ventricular filling, which follows isovolumic relaxation, occurs when the elastic recoil of the ventricular walls literally sucks blood into the expanding cavity (Nikolic et al., 1988). The energy expended to fill the ventricle later during diastole is provided by the momentum of the venous return, which is generated by the opposite ventricle; blood pumped out of the right ventricle helps fill the left ventricle, and blood pumped from the left ventricle helps fill the right ventricle. As noted above, atrial systole normally makes only a small contribution to filling. Calculations of the work of the ventricle often subtract the energy expended to fill the ventricles, but this is usually a small fraction of total stroke work (Fig. 12-3).
Internal Work
The heart uses a large amount of energy to perform internal work. This includes energy used to rearrange cytoskeletal structures (see Chapter 5) and stretch elastic and viscous elements in the myosin cross-bridges other sarcomeric proteins. Energy is also expended to stretch the
connective tissue that supports the heart and reorient the spiral bundles that make up the muscular architecture of the ventricles (see Chapter 1). Because most of this energy is used to elongate elasticities and viscosities, internal work is proportional to wall stress.
connective tissue that supports the heart and reorient the spiral bundles that make up the muscular architecture of the ventricles (see Chapter 1). Because most of this energy is used to elongate elasticities and viscosities, internal work is proportional to wall stress.
The downward movement of the entire heart during ejection, sometimes referred to as the “descent of the base,” is a form of internal work; this movement, which is a consequence of Newton’s third law (“to every action there is an equal and opposite reaction”), occurs when blood ejected across the aortic valve toward the head causes the heart to move in the opposite direction, toward the feet. The descent of the base is the major cause of the x descent in the jugular venous pulse, a downward pulsation seen immediately after the upward a wave caused by atrial systole. This movement, which explains the bouncing of the needle in synchrony with the heartbeat when one stands quietly on a spring scale, provided the rationale for ballistocardiography, a now discarded method to estimate stroke volume.
Much of the energy expended as internal work contributes to the heart’s inefficiency because it is degraded to heat when the heart relaxes (see below). However, some of the potential energy stored in stretched elasticities is used to perform external (useful) work when wall stress decreases during ejection (see below). Conversion of this potential energy to useful work accounts for the energy-sparing effect of interventions that reduce afterload; conversely, increased release of this potential energy as heat is among the adverse consequences of high wall stress. The latter is especially deleterious in patients with coronary occlusive disease or heart failure, whose hearts are usually energy-starved.
Minute Work
Clinical descriptions of cardiac work generally refer to the external work performed per minute, or minute work. The latter, which is a power (work performed over time), can be calculated by multiplying the work per beat (stroke work) by the number of beats per minute (HR = heart rate):
Because the product of HR × SV in Equation 12-6 is cardiac output (CO), minute work is also the product of pressure times cardiac output:
Each of the variables in Equation 12-6 makes an independent contribution to the minute work; for example, the latter can be increased by increasing ejection pressure, heart rate, stroke volume, or any combination of these variables. Because stroke volume = EDV – ESV, minute work has four determinants:
Each of these four variables has a different impact on cardiac energetics, so that minute work provides only a rough index of the energy demands of the heart.
Work of the Isolated Heart
The variables that determine minute work are readily analyzed in isolated heart preparations, where each can be varied independently. The preparation illustrated in Figure 12-5, which is similar to a working turtle heart that the author studied as a medical student in 1953, considers
the work of a single ventricle–this is not a problem in the turtle heart, which has only one ventricle. Filling pressure (preload) can be varied by adjusting the height of the venous reservoir and ejection pressure (afterload) by raising or lowering the outlet of a flexible tube connected to the aorta; heart rate is controlled by electrical stimulation. The following discussion examines the effects of changing filling pressure, ejection pressure, and heart rate while the other determinants of minute work are kept constant.
the work of a single ventricle–this is not a problem in the turtle heart, which has only one ventricle. Filling pressure (preload) can be varied by adjusting the height of the venous reservoir and ejection pressure (afterload) by raising or lowering the outlet of a flexible tube connected to the aorta; heart rate is controlled by electrical stimulation. The following discussion examines the effects of changing filling pressure, ejection pressure, and heart rate while the other determinants of minute work are kept constant.
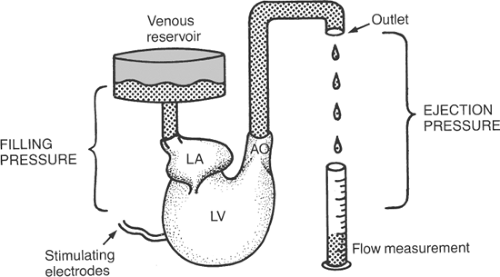 Fig. 12-5: Isolated turtle heart preparation. Blood flows from the venous reservoir into the left atrium (LA) at a pressure determined by the height of the reservoir. When the single ventricle (V) contracts, blood is pumped across the aortic valve (AO) into a tube in which the height of the outlet, relative to the center of the atrium, is the ejection pressure. Stroke volume is the amount of blood ejected during each beat. |
Vary Filling Pressure
Changing the height of the venous reservoir directly modifies ventricular end-diastolic pressure and EDV (preload). The effects on cardiac performance are predicted by Starling’s law of the heart; as long as the heart functions on the ascending limb and ejection pressure is constant, stroke volume will increase with increasing filling pressure (Fig. 12-6). Because stroke
work equals stroke volume times ejection pressure, which is held constant, stroke work can be substituted for stroke volume on the ordinate in Figure 12-6; as heart rate is also kept constant, minute work can be placed on the ordinate of Figure 12-6.
work equals stroke volume times ejection pressure, which is held constant, stroke work can be substituted for stroke volume on the ordinate in Figure 12-6; as heart rate is also kept constant, minute work can be placed on the ordinate of Figure 12-6.
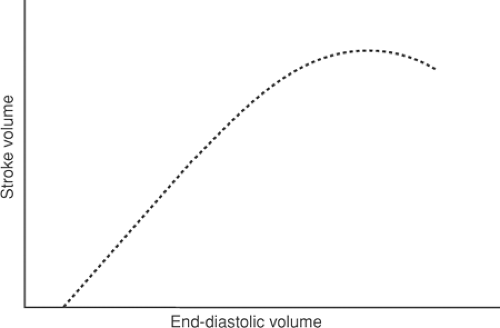 Fig. 12-6: Operation of Starling’s law of the heart under conditions where heart rate and ejection pressure are constant, and only filling pressure is allowed to vary. Under these conditions, stroke volume rises as filling pressure increases. The descending limb shown at high end-diastolic volumes in this and the next figure is not seen in the normal mammalian heart. |
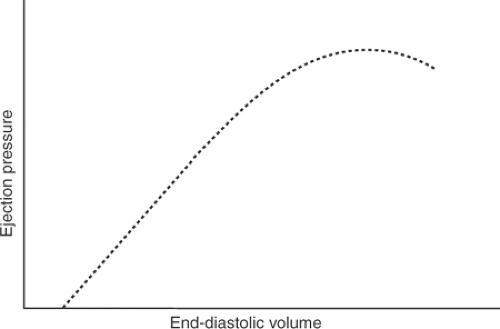 Fig. 12-7: Operation of Starling’s law of the heart under conditions where heart rate and stroke volume are constant, so that only ejection pressure can vary. When ejection pressure is increased, the end-diastolic pressure must also be increased to meet the requirement that stroke volume remains constant, and vice versa. |
Vary Ejection Pressure
Raising or lowering the outlet of the tube connected to the aorta directly affects ejection pressure (afterload). However, stroke volume will also change because afterload is a major determinant of the ability of a muscle to shorten (see Chapter 3); for this reason, increasing afterload will reduce stroke volume, and decreasing afterload will increase ejection. To satisfy the requirement that only one variable be changed at any time, the level of the venous reservoir must also be adjusted to maintain a constant stroke volume. This means that when afterload is increased, the venous reservoir must be raised to maintain stroke volume; conversely, when reduced ejection pressure allows stroke volume to increase, the venous reservoir must be lowered. Varying the pressure in the venous reservoir directly alters EDV, which allows Starling’s law to maintain a constant output in the face of the changing afterload (Fig. 12-7). As heart rate is kept constant, stroke work and minute work can replace ejection pressure on the ordinate in Figure 12-7.
Varying Heart Rate
When heart rate is varied at constant filling and ejection pressures, stroke volume by the turtle heart will be constant (Fig. 12-8); within limits, therefore, cardiac output and minute work will vary directly with heart rate. However, at very high heart rates diastole becomes too brief to allow the ventricle to relax completely between beats, so that cardiac output will begin to fall as rate increases further.
The effects of changing heart rate are not the same in the intact animal where, within limits, cardiac output is independent of heart rate. This is because blood flow through most organs is matched to energy needs by changes in the caliber of the resistance vessels that control tissue perfusion. This mechanism, called autoregulation, adjusts blood flow to match the needs of the tissue, which means that cardiac output is normally determined by the needs of the body, rather than the ability of the heart to pump blood (Warner and Toronto, 1960) (Fig. 12-8). At very low and very high heart rates, however, cardiac output becomes dependent on rate. At very rapid heart rates, cardiac output falls because diastole does not last long enough to allow the ventricle to fill completely; this is due both to limited flow velocity across the mitral valve and lack of time for the myocardium to relax completely. In humans, cardiac output begins to fall at heart rates greater than about 160/min and less when there is heart failure. Cardiac output also falls when heart rate becomes extremely slow, as in patients with complete heart block where rates can be as low as 20/min. Under these conditions, even though there is ample time for filling, the ability of the heart to fill is limited by its low diastolic compliance. The adverse clinical effects of these very slow heart rates include profound weakness and clinical evidence of heart failure, both of which can be relieved by pacing the heart with an electronic pacemaker.
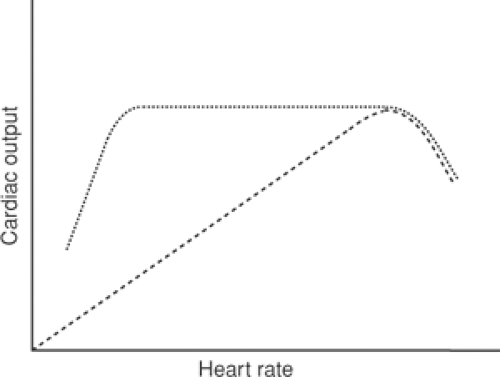 Fig. 12-8: Effects of heart rate on cardiac output in the isolated turtle heart (dashed line) and in the intact animal (dotted line). In the former, as long as the duration of diastole is sufficient to allow the heart to relax completely, cardiac output will be directly related to heart rate. In the intact animal, blood flow through the tissues is normally determined by local metabolic needs, so that cardiac output will remain constant when heart rate changes; for this reason, stroke volume will vary inversely with heart rate. In both, cardiac output will begin to fall at heart rates so rapid that the duration of diastole becomes too brief to allow the heart to relax fully. Cardiac output in intact animals also falls at very low heart rates. |
Energy Cost of the Work of the Heart
Cardiac energy utilization can be estimated by measuring the consumption of oxygen by the heart because the myocardium satisfies virtually all of its energy needs by oxidizing fat, carbohydrates, and to a minor extent protein (see Chapter 2). The energy made available from a given amount of oxygen is virtually independent of the substrate oxidized because, even though oxidation of fat yields ∼9 calories/g, while carbohydrate and protein oxidation yields only ∼4 calories/g, more oxygen is consumed by the oxidation of fat. For this reason, energy release per liter of oxygen consumed is similar for all of these substrates.
Cardiac Efficiency
The efficiency of cardiac contraction can be estimated by dividing the external work of the heart by the energy equivalent of the oxygen consumed:

Equation 12-9 does not describe a thermodynamic efficiency, which is extremely difficult to calculate. However, this simpler analysis provides a useful index of the overall economy of the heart. The efficiency of the working heart calculated in this manner ranges between 5% and 20%, the exact value depending on the nature and amount of work performed.
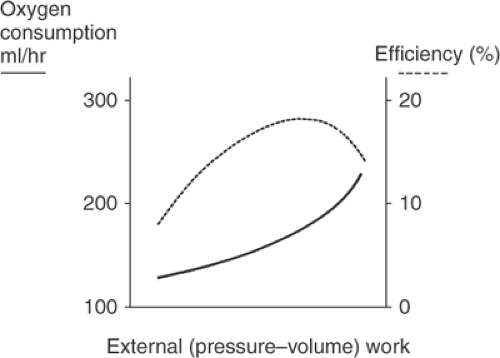 Fig. 12-9: Relationship between external work and the energetics of ventricular contraction. Oxygen consumption (solid line) increases when more work is done while efficiency (dashed line) first rises and then falls. (Based on data from Evans and Matsuoka, 1915).
Stay updated, free articles. Join our Telegram channel
Full access? Get Clinical Tree
 Get Clinical Tree app for offline access

|