Activation of the bundle branches and Purkinje fibers also generates electrical forces, but these are too small to be detected by conventional ECG recording devices, hence the isoelectric line between the P wave and QRS complex. The earliest forces are those spreading in a semicircular ring in the endocardial septal surface between the papillary muscles. The early excitation of the papillary muscles provides an initial vector superiorly along the long axis of the LV. As the activation process spreads through the ventricular wall, more cells are recruited, and a visible record can be detected on the body surface, the beginning of the QRS complex.
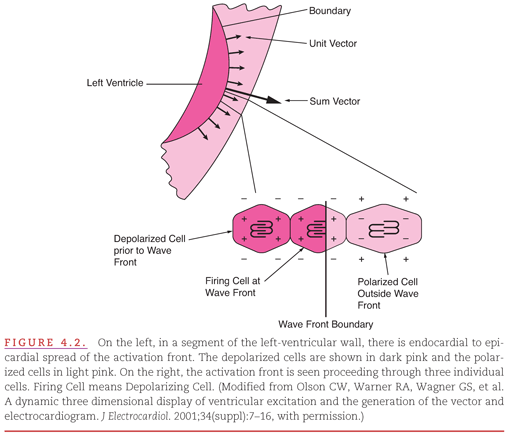
The electrical stimulus then spreads into a wider area of endocardial layers of the myocardium by the Purkinje cell network and continues to spread from the endocardium outward toward the epicardial surface. Figure 4.2 shows this activation front in a segment of the left-ventricular wall as it is moving from its endocardial location across the wall.4 The boundary marking the activation front is seen as a curved black line, with the cells already depolarized on the left (dark pink) and the still polarized cells on the right (light pink). The expanded diagrammatic view on the right shows the process as it proceeds from cell to cell, with the boundary seen as a vertical line. At the activation front, ions are rapidly moving across the cell wall. It is this ionic movement that induces the potential difference we record in the VCG and ECG. The electrical forces in each cell undergoing this process can be represented by a small vector (the unit vector). The sum vector is the vectoral sum of all unit vectors at a given instant.

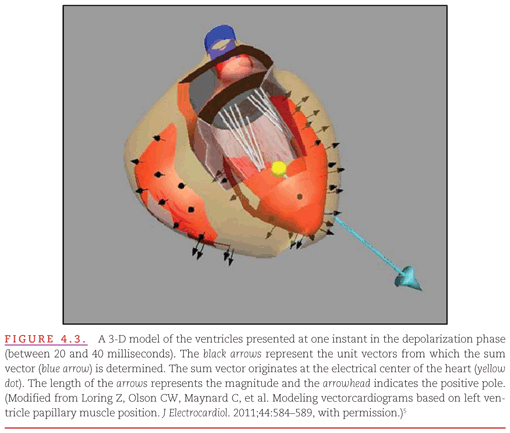
Figure 4.3 shows these same forces in a form more closely resembling the process seen in the heart. As the activation boundary moves from endocardium to epicardium, there are many cells undergoing depolarization at any instant in time. Each cell contributes a small unit vector, directed perpendicular to the wave front. Again, the sum of all unit vectors acting at that instant can be represented as a single sum vector. As seen in Figure 4.3, not all unit vectors have the same direction as the overall sum vector. These opposing unit vectors pointing in the opposite direction reduce the magnitude of the sum vector; this phenomenon is referred to as cancellation.

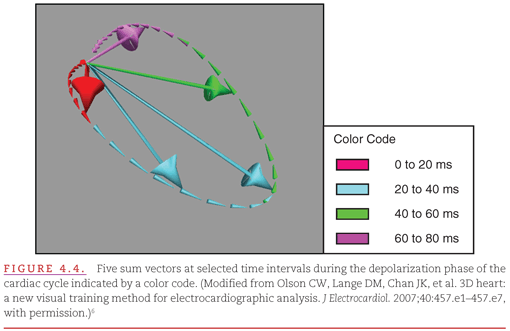
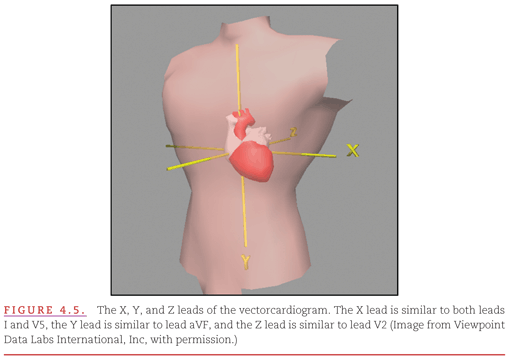
Figure 4.4 shows the sum vectors at five selected time intervals during the depolarization phase of the cardiac cycle. Note that this cycle could have been divided into 50 intervals, and each would have a sum vector indicating the magnitude and direction of the sum vector at that instant. As you can see, connecting the tips of these sum vectors forms a loop-shaped figure, which returns to the point of origin at the end of the cycle (80 milliseconds). Like the 12-lead ECG, this loop can be directly recorded from conventional points on the body surface. Note that the loop is located in space and does not have a fixed relationship with body anatomy. The VCG is recorded as the projection of the loop on three defined leads: the X, Y, and Z leads. These leads are shown in Figure 4.5.

The transmission of these forces to the body surface was studied in detail by Frank,7,8 whose experimental work with a current dipole in the center of anatomic models of the human torso made it possible to design new leads (X, Y, and Z leads) that are used to record the VCG from the body surface, which are at right angles to each other (orthogonal) and intersect at the center of the heart, as shown in Figure 4.5. These and similar studies also show us how to transform signals from one lead to another, including those in the conventional 12-lead ECG.

The QRS loop in a single cardiac cycle can be represented as a projection onto each of the three orthogonal planes as shown in Figure 4.6
Stay updated, free articles. Join our Telegram channel

Full access? Get Clinical Tree


