The Normal Electrocardiogram
George F. Van Hare
Jennifer N. A. Silva
In this era of easily available high-resolution imaging techniques, does electrocardiography (ECG) still have a place in the diagnosis and management of children with congenital heart disease? Certainly, for the noninvasive diagnosis of arrhythmias and cardiac conduction disorders, there is no substitute for careful analysis of the ECG. In addition to the assessment of arrhythmias, the ECG is important in the diagnosis and management of heart disease in children. Although rarely diagnostic of the type of congenital heart disease, the ECG should be thought of in the same way as the physical examination. It provides clues to the likely diagnosis, provides information about the severity of the condition, and may be indicative of other associated problems. In addition, review of the ECG may identify important discrepancies as compared with the patient’s presumed diagnosis, prompting further testing or a more careful review of the existing data. Most experienced pediatric cardiologists consider a cardiology consultation incomplete without a review of the ECG.
There is a growing body of literature on body surface mapping and noninvasive electrocardiographic mapping. These techniques do not substitute for careful analysis of the surface ECG but rather provide additional information which may help with the diagnosis and treatment of complex patients.
The History of Electrocardiography
Although Augustus Waller was the first to record an ECG in a human (1), Willem Einthoven of The Netherlands is considered the father of ECG. In 1901, Einthoven published a description of the string galvanometer, a device ideally suited for recording the rapidly changing and weak currents of cardiac electrical activity present on the body surface (2). During subsequent work, Einthoven identified the major waveforms of the ECG, and initially named them A, B, C, and D. He subsequently changed the naming system to P, Q, R, S, and T waves (Fig. 19.1), leaving room at either end of the alphabet for naming of new, as yet undiscovered, waves (as later came to pass when the U wave was described). The string galvanometer proved useful for the study of the ECG. The investigations of Einthoven and Sir Thomas Lewis dominated the early years of ECG studies, and they are credited with bringing the ECG to the bedside (3). This was not anticipated by Waller: “I certainly had no idea that the electrical signs of the heart’s action could ever be utilized for clinical investigation” (1). Recordings in children followed, and Ziegler (4) reviewed the early reports on the use of the ECG in children. In 1913, Hecht published a “comprehensive” study, evaluating all three standard bipolar leads (I, II, III) in ECG tracings from hundreds of premature infants, term infants, and children with normal and abnormal hearts. By the late 1930s, the distinctive developmental changes that occur in the ECGs of normal infants and children had been described (4).
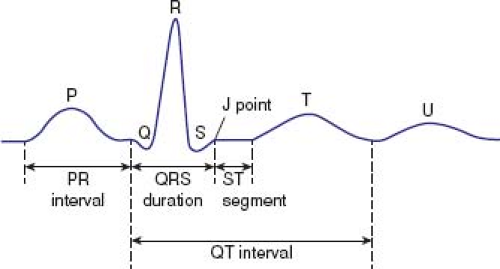 Figure 19.1 Scalar ECG showing P, Q, R, S, T, and U waves. The J point is shown, as well as the standard intervals (PR interval, QRS duration, ST segment, and QT interval). |
Principles and Technical Considerations in Recording the Electrocardiogram
The Scalar Electrocardiogram
The heart is an electrically active organ, and the current flows that result in cardiac contraction can be recorded from the body surface. How these electrical events are transmitted to the body surface is a complex topic and involves characteristics both of the heart as a current source as well as of the chest, which acts as a conductor (5,6). These characteristics change in the presence of congenital defects and other forms of cardiac disease as well as with normal growth and development.
The basic principle of the ECG is that electrical potentials generated by the heart can be accounted for by considering these electrical events to be equivalent to those generated by a dipole source in a homogeneous volume conductor (the equivalent dipole model). This concept has the limitation of seriously oversimplifying these events, especially in the assumption of homogeneity of conduction through the chest. The scalar ECG can be thought of as the record of voltage variation of this dipole with respect to time, in the particular orientation of the lead recorded. Cardiac electrical activity, of course, generates potentials in three dimensions, so any particular lead provides a very small amount of the potentially available information that can be recorded. For this reason, the conventional ECG includes 12 or 15 leads, arranged to give recordings along a variety of lead orientations to better represent the cardiac activity in three dimensions. The choice of these leads evolved as studies of the ECG progressed and, in retrospect, may not represent the best of all possible lead systems. However, these particular leads are deeply entrenched in modern cardiology practice.
Electrocardiographic interpretation begins with artifact-free ECG recordings. In addition to accurate electrode placement, cleaning of the skin with alcohol or acetone is essential to lower the skin resistance. ECG recordings in active infants and toddlers can be a technical challenge.
The standard ECG record consists of 12 leads recorded from nine body surface locations with the patient in the supine position (7). The ideal recorder should have the capability of displaying 3 to 12 leads simultaneously. The standard configuration usually
is modified in children and adults with congenital heart disease, to record additional right (V3R, V4R) and left (V7) chest leads. Interpretation of rhythm disturbances ideally is accomplished by viewing a rhythm strip with 12 simultaneously recorded leads so that transient events, such as premature beats, can be assessed in all leads simultaneously.
is modified in children and adults with congenital heart disease, to record additional right (V3R, V4R) and left (V7) chest leads. Interpretation of rhythm disturbances ideally is accomplished by viewing a rhythm strip with 12 simultaneously recorded leads so that transient events, such as premature beats, can be assessed in all leads simultaneously.
Electrocardiograms can be recorded at various “paper speeds” and at various voltage standardizations (although modern systems acquire the tracings digitally and may be interpreted online without ever being printed on paper). Paper speeds of 12.5, 25, and 50 mm/s have been used, but 25 m/s is standard. Standard ECG recording paper has major time divisions at 5-mm intervals and minor time divisions at 1-mm intervals. Therefore, at a paper speed of 25 mm/s, each large block corresponds to 0.20 seconds (200 ms), and 1 second is represented by five large blocks. Each small block represents 0.04 seconds (40 ms). In terms of voltage, full standardization refers to 1.0 mV/10 mm in vertical deflection on the recording, whereas half standardization refers to 1.0 mV/5 mm. It is important that the ECG reader always checks standardization prior to interpreting the ECG because the use of half standardization is common when large voltages cause overlap between leads. The choice of paper speed and gain may have an impact on the reproducibility of interval measurements (8). With the exception of the signal-averaged ECG, it is uncommon to discuss or report ECG voltages in terms of millivolts. It is much more common to discuss them in terms of millimeters of amplitude at full standardization. Therefore, for the remainder of this chapter, millimeters at full standardization is used rather than millivolts.
Vectorcardiography
Vectorcardiography was developed to correct some basic limitations of the conventional lead system and to display the data obtained by the ECG in a potentially more useful format. The dipole varies in magnitude and direction with time. The scalar ECG allows the presentation of the magnitude only, as it varies with time, and one needs to infer the direction of forces from the lead chosen. Each instant, the heart generates a force that has both magnitude and direction. This vector force changes with time and traces a loop during the duration of the QRS complex, which occupies all three dimensions. The vectorcardiography lead system allows a reasonably faithful representation of this three-dimensional loop as two-dimensional frontal, sagittal, and horizontal planes (Fig. 19.2). Several lead systems have been used. They each have their advantages and disadvantages. The Frank (9) system has been the most widely used, but the McFee system also has been used. The QRS vectorcardiogram, then, consists of a loop that starts at the beginning of the QRS, ends with the end of the QRS, and is displayed on paper in three planes.
Because of the need for special equipment, technical expertise, and the inconvenience of multiple leads, vectorcardiograms rarely are obtained in modern pediatric cardiology practice. Also, because of high-quality echocardiography, vectorcardiography has limited utility. Still, the best electrocardiographers think in terms of vectors even when interpreting the scalar ECG. Rather than memorizing patterns of QRS morphology and axis, they view the standard scalar ECG as a representation of the vector forces that vary with time, and perhaps understand the ECG better than those who simply “pattern read.”
Body Surface Mapping and Noninvasive Electrophysiologic Imaging
A natural extension of the technique of ECG and vectorcardiography is the use of body surface mapping. To obtain the spatial–temporal representation of cardiac electrical potentials on the body surface, simultaneous measurement of potentials are needed at a number of sites (from 24 to 200) on the anterior and posterior torso. Several excellent reviews have addressed the specific details, including number and location of electrodes (10), electrode type (11), sample rate (12), digital collection and processing of ECG signals (13,14), and construction of maps (13). These techniques are investigational and require specialized equipment and a high level of computerization. Recent developments in solving the “inverse problem” in electrocardiology have allowed for “noninvasive electrocardiographic imaging” (or ECGI) in which epicardial potentials are computed from over 250 body surface electrocardiograms. From this, individualized activation maps, repolarization maps, activation-recovery intervals, and potential maps can be generated. This approach has shown promise in the noninvasive evaluation of cardiac conduction abnormalities such as Wolff–Parkinson–White (WPW) syndrome (Fig. 19.3) and long QT syndrome (15,16). Future studies in congenital heart disease patients will provide more insight into this population.
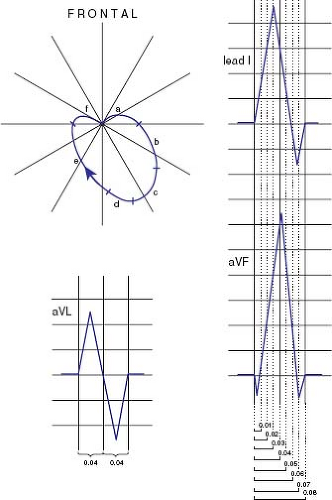 Figure 19.2 Diagrammatic representation of a typical normal frontal plane vector loop (top left) with corresponding scalar ECG leads I, aVL, and aVF. The loop is clockwise in the frontal plane and lasts for 0.08 seconds. Each lettered segment corresponds to a portion of the QRS interval: a, 0 to 0.01 seconds; b, 0.01 to 0.03 seconds; c, 0.03 to 0.04 seconds; d, 0.04 to 0.055 seconds; e, 0.055 to 0.07 seconds; f, 0.07 to 0.08 seconds. |
Esophageal Electrocardiography
Because the esophagus normally is behind the left atrium and is in close proximity to the heart, an electrode placed in the esophagus will record atrial activity more locally than the standard ECG leads (17).
This is especially useful in evaluating cardiac rhythm disturbances, particularly in situations where the P wave is difficult to find on the surface ECG. For example, when there is atrial flutter with 2:1 atrioventricular (AV) conduction, flutter waves may not be obvious on the surface ECG. Even if one observes atrial activity on the surface ECG, it may not be apparent that there are twice as many atrial deflections as ventricular deflections. The esophageal ECG solves this problem by recording atrial electrograms that are as large as or larger than the simultaneously recorded ventricular electrograms.
This is especially useful in evaluating cardiac rhythm disturbances, particularly in situations where the P wave is difficult to find on the surface ECG. For example, when there is atrial flutter with 2:1 atrioventricular (AV) conduction, flutter waves may not be obvious on the surface ECG. Even if one observes atrial activity on the surface ECG, it may not be apparent that there are twice as many atrial deflections as ventricular deflections. The esophageal ECG solves this problem by recording atrial electrograms that are as large as or larger than the simultaneously recorded ventricular electrograms.
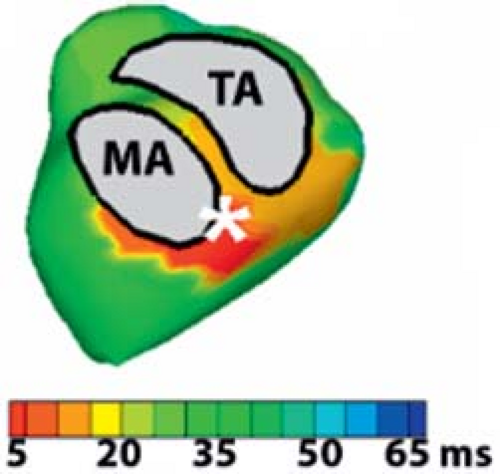 Figure 19.3 Activation map of a patient with Wolff–Parkinson–White created with noninvasive electrocardiographic imaging. This figure shows the earliest point of activation or site of the accessory pathway (in red, marked with an asterisk) in the left posterioseptal aspect of the mitral valve. (From Ghosh S et al. Circulation. 2008:118:908–915, used with permission.) |
To obtain artifact-free esophageal ECGs, a soft bipolar electrode that has widely spaced large electrodes is used. Several are commercially available from 5 to 10 F in size. The catheter is positioned at the proper site and the signal filtered, usually employing band-pass filtering at 10 to 1,000 Hz, to eliminate the low-frequency respiratory artifact (17). Electrode placement is similar to nasogastric tube placement. The insertion depth for recording the maximum atrial deflection can be estimated from the patient’s height (18,19). The ideal position is the site at which the atrial electrogram is about equal to the ventricular electrogram amplitude, and both are as large as possible. Positioning too distally will yield a large ventricular electrogram and a small atrial electrogram, and positioning too proximally will yield low amplitudes of both electrograms.
Signal-Averaged Electrocardiography
Under normal circumstances, the amplitude of P waves and ST segments is <2.5 mm, and T waves do not exceed 10 mm in the precordial leads. On the other hand, precordial R and S waves may have amplitudes of 30 to 40 mm. Interest in low-level potentials has led to the development of the signal-averaged ECG as a way of eliminating noise, which may exceed 0.03 mV peak to peak, and improving the signal-to-noise ratio.
The principal interest in the signal-averaged ECG has been to identify small high-frequency potentials either during the PR interval or during late QRS and ST segment (20). High-frequency potentials during the ST segment may result from areas of slow conduction that have been observed in myocardial infarction and associated ventricular arrhythmias (21). Interest in high-frequency potentials during the PR interval has focused on detecting depolarization within the His–Purkinje system.
The basic principle is that averaging a periodic, repetitive signal will reduce random noise to <0.001 mV, thereby enhancing the detection of low-amplitude signals. The signals are recorded at very high gain and are band-pass filtered. Waveforms usually are averaged over several minutes. Sensitivity and specificity of the technique for predicting adult patients at risk for ventricular arrhythmias have been reported. Reports of this technique for pediatric patients have been limited (22), but it has been used to identify patients with arrhythmogenic right ventricular dysplasia (23).
24-Hour Ambulatory Electrocardiography
Named after Dr. N. J. Holter (24), the 24-hour ambulatory ECG, or Holter ECG, is an important tool in the diagnostic armamentarium of the pediatric cardiologist. It is used for various indications and is, perhaps, the most effective method to diagnose transient events such as AV block and other conduction disorders.
Modern Holter equipment records two or three channels of the ECG for 24 hours, either onto a cassette tape or digitally into a flash memory card in the recorder (25). The digital recording system has the advantage of being smaller and lighter and avoids the mechanical problems of cassette tape drag and damaged tapes. The ECG leads chosen for recording generally are modified chest leads and most closely resemble leads V1 and V5. The ECG is obtained using chest leads that are applied after adequate skin preparation, and the chest is often wrapped in an elastic bandage. The recorder can be worn on the belt, placed in a backpack, or suspended from a strap. The recorders have a digital clock for linking events with actual times, as well as a patient-activated event marker that allows the patient to annotate episodes of cardiac symptoms.
The recording is scanned using a computerized analysis system that provides both a full disclosure of the entire recording, as well as summary data regarding average, maximum, and minimum heart rates. Computerized algorithms allow the identification, characterization, and enumeration of premature atrial and ventricular contractions, as well as higher grades of ectopy and episodes of abnormal tachycardia. The patient keeps a diary of events while wearing the Holter recorder, and any such episodes of interest can be printed out and evaluated as part of the scanning process. The algorithms for arrhythmia diagnosis are limited in their applicability to pediatric patients, and the technician who scans and prints the report must be experienced in pediatric Holter scanning and supervised by a pediatric cardiologist (26,27,28).
Transtelephonic Event Recording
One limitation of Holter monitoring is that to record a transient symptomatic event, the event must occur spontaneously during the period that the patient is wearing the recorder. Thus, Holter monitoring often fails to record such events when they do not occur many times per day. Accordingly, to capture a symptomatic event, transtelephonic event recording allows longer periods of monitoring in a cost-effective manner (29,30). Several types of recorders are available. The simplest is a small device that records a single ECG channel for 30 to 60 seconds into the memory of the device when a button is pushed. It may have electrodes built into the device that contact the chest, or can be attached to the patient by several ECG electrodes or by wrist electrodes. These recorders have the disadvantage that the episode must be long enough for the recorder to be applied. This problem can be minimized by using a recorder that resembles a wristwatch, does not require additional electrodes, and can be worn continuously. An alternative to this simple type of recorder is the so-called memory-loop recorder. This recorder resembles a small Holter recorder, is attached to the patient by means of chest electrodes, and is worn continuously. Rather than recording and storing all the ECG data while worn, the device temporarily stores about
60 seconds of ECG data. When the patient experiences a symptom, he or she presses a button on the unit, causing it to store the 30 seconds of data that occurred prior to pressing the button as well as a short amount of data following the episode.
60 seconds of ECG data. When the patient experiences a symptom, he or she presses a button on the unit, causing it to store the 30 seconds of data that occurred prior to pressing the button as well as a short amount of data following the episode.
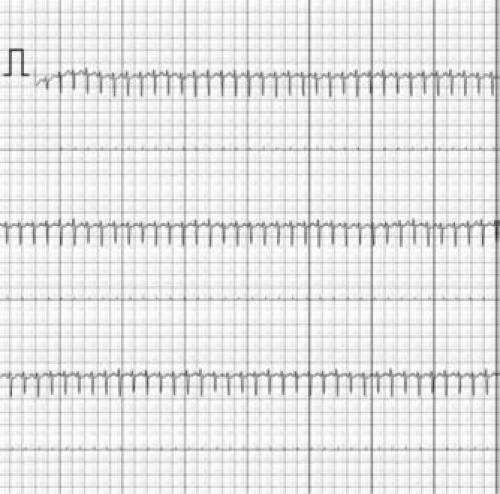 Figure 19.4 This tracing, obtained by a handheld smartphone device, is from a 10 week old with supraventricular tachycardia. This breakthrough was documented by the parents as an outpatient. |
The recorder stores the episode as an oscillatory audio signal. After an episode is captured by the recorder, the patient or a parent can transmit the ECG by playing back the stored audio signal over the telephone to the monitoring center, where the ECG is converted back to an ECG waveform and printed out for interpretation.
Novel wireless cardiac monitoring devices are rapidly developing and coming to market for patient use. Real-time smart phone monitoring adapters are available and allow patients to record and transmit a single-lead ECG (Fig. 19.4) (31). The ECG patch monitor is an adhesive single-lead ECG monitor that converts analog ECG signals to a digital format, has an accelerometer to remove artifact, a low-power Bluetooth low-energy processor that transmits the data, and a lithium polymer battery (32).
Also available are insertable loop recorders (ILRs), which are implanted in the subcutaneous tissue on the chest wall and are active for up to 3 years. The device incorporates a continuous loop recording of the heart rhythm that is stored when the device is activated by the patient or parent. There is also an autoactivation component that allows the device to automatically record rhythms that are out of a preset range. Remote monitoring is available so that patients can transmit recorded data over phone lines using equipment at home (33). This device is useful for pediatric patients with syncope and/or palpitations (34). These are ideal when noninvasive methods have failed to document the rhythm particularly in cases of very infrequent events.
How to Read a Pediatric Electrocardiogram
An organized approach to evaluating the ECG is important to avoid failure to consider each characteristic of the ECG. Many advise that these characteristics be evaluated in a particular order, for example, by assessing the P wave first, the QRS second, and so on. The order, of course, is less important than a careful review of all the aspects of the recording (Table 19.1). Often pediatric ECGs are interpreted in light of extensive knowledge of the patient’s condition. Clearly, the more information the reader has about the patient’s condition, the more relevant the ECG interpretation will be. However, one often reads ECGs with no clinical information except the patient’s age. For this reason, the ECG is considered a laboratory test. ECG attributes (e.g., intervals, voltages) are distributed within a population. Thus, the prevalence of an abnormality depends on the normal cutoff points one picks. Just as the presence of a murmur does not necessarily mean that a patient has valvar stenosis, an “abnormal” ECG does not necessarily mean that the patient has heart disease. An example of this pitfall is the presence of a chest deformity (e.g., pectus excavatum or scoliosis) about which the ECG reader may not have information and needs to interpret the ECG. Even if the reader knows about the deformity, he or she may not know what constitutes normal for such a situation.
TABLE 19.1 Characteristics for Evaluation of the Electrocardiogram | ||||||||||||||
|---|---|---|---|---|---|---|---|---|---|---|---|---|---|---|
|
Pediatric ECG features are age dependent (Table 19.2). The PR interval, ST segment, and T wave are heart rate dependent as well. The most comprehensive tabulation of age- and heart rate–dependent ECG measures was provided by Davignon et al. (35,36).
The zero-voltage baseline, which is the reference level for ECG voltage measurements, is based on the fact that no potential differences exist on the body surface at that instant. At slow heart rates, the TP or UP segment is a good approximation of the voltage baseline. At faster heart rates, the P wave may be superimposed on the previous T-U wave. In this situation, the PR segment is the best alternative. When measuring a large deflection, choice of baseline selection is relatively unimportant. However, when measuring a low-level potential (e.g., ST segment), or attempting to determine onset of a waveform (e.g., QRS), choice of the baseline is critical—maybe as important as the measurement of interest.
Detailed descriptions of arrhythmia diagnosis are found elsewhere in this text. Likewise, the ECG patterns characterizing various forms of complex congenital heart disease are addressed in the chapters dealing with those diseases.
TABLE 19.2 Normal ECG Standards for Children by Age | |||||||||||||||||||||||||||||||||||||||||||||||||||||||||||||||||||||||||||||||||||||||||||||||||||||||||||||||||||||||||||||||||||||||||||||||||||||||||||||||||||||||||||||||||||||||||||||||||||
|---|---|---|---|---|---|---|---|---|---|---|---|---|---|---|---|---|---|---|---|---|---|---|---|---|---|---|---|---|---|---|---|---|---|---|---|---|---|---|---|---|---|---|---|---|---|---|---|---|---|---|---|---|---|---|---|---|---|---|---|---|---|---|---|---|---|---|---|---|---|---|---|---|---|---|---|---|---|---|---|---|---|---|---|---|---|---|---|---|---|---|---|---|---|---|---|---|---|---|---|---|---|---|---|---|---|---|---|---|---|---|---|---|---|---|---|---|---|---|---|---|---|---|---|---|---|---|---|---|---|---|---|---|---|---|---|---|---|---|---|---|---|---|---|---|---|---|---|---|---|---|---|---|---|---|---|---|---|---|---|---|---|---|---|---|---|---|---|---|---|---|---|---|---|---|---|---|---|---|---|---|---|---|---|---|---|---|---|---|---|---|---|---|---|---|---|
| |||||||||||||||||||||||||||||||||||||||||||||||||||||||||||||||||||||||||||||||||||||||||||||||||||||||||||||||||||||||||||||||||||||||||||||||||||||||||||||||||||||||||||||||||||||||||||||||||||
Rate and Rhythm
Ventricular Rate
Heart rate is determined by measuring the RR interval. It often is more useful to think of cycle length than heart rate, because on the standard ECG there seldom is an entire minute’s worth of heartbeats to count. Cycle length and heart rate have a reciprocal relationship. Cycle length (in milliseconds) is measured directly as the RR interval. Heart rate is calculated by dividing 60,000 by the measured cycle length in milliseconds. Heart rate is highly dependent on age, body temperature, autonomic tone, and physical activity. For example, in a 14 year old, a resting heart rate (cycle length) of 150 beats per minute (400 ms) would be abnormally high. However, it might be a perfectly normal rate for an apprehensive toddler during ECG recording. Similarly, a resting heart rate of 50 beats per minute (1,200 ms) in a healthy adolescent would be normal, whereas the same heart rate in an infant would signify bradycardia.
Origin of the Pacemaker
On most ECGs, there will be normal AV conduction with P waves preceding each QRS complex. It is important to determine if the P wave originates from the sinus node or elsewhere. The vector of a sinus P wave is from top to bottom and right to left (positive in leads I, II, and aVF). The P wave in sinus rhythm is biphasic in lead V1, initially being upright followed by a brief downward deflection. If the P wave does not have these characteristics, it does not originate from the sinus node and has an “ectopic” location. One must ascertain its origin, for example, a rhythm in which the P wave is inverted in leads I and aVL is termed a left atrial rhythm, whereas a P wave that is inverted in leads II, III, and aVF is termed a low right atrial rhythm (also known as a coronary sinus rhythm).
Stay updated, free articles. Join our Telegram channel

Full access? Get Clinical Tree


