The Electrocardiogram
The electrocardiogram (abbreviated ECG from the English spelling, or EKG from the Dutch) uses electrodes placed on the body surface to record the electrical activity of the heart. These tracings provide measurements of the heart’s ability to initiate electrical impulses (chronotropy) and conduct action potentials (dromotropy), but contain virtually no direct information about contractility (inotropy) or relaxation (lusitropy).
All adult cardiac myocytes can respond to electrical stimuli and conduct action potentials, but the working cells of the atria and ventricles generally lack automaticity, and the cells of the sinoatrial (SA) and atrioventricular (AV) nodes and His-Purkinje system have virtually no ability to contract and relax. Conduction velocity also differs in various regions of the heart; it is very slow in the SA and AV nodes, more rapid in the atria and ventricles, and very rapid in the His-Purkinje system. These and other manifestations of the heart’s electrical activity can be evaluated using the ECG, which provides invaluable pathophysiological information about patients with heart disease.
Chronotropy: Pacemakers and Impulse Formation
The primary pacemaker of the heart is the SA node, which is derived from the sinus venosus, which is the most rapidly beating portion of the embryonic heart. These tubular hearts, like those of primitive animals, can be divided into four regions: sinus venosus, atria, ventricles, and truncus arteriosus (Fig. 15-1). Although embryonic atria and ventricles contain pacemaker cells, their spontaneous depolarizations are suppressed by the faster sinus venosus pacemaker; this is because the intrinsic rate of pacemaker depolarization decreases as one proceeds from the higher (upstream) venous to the lower (downstream) arterial end of the embryonic heart. As a result, the pacemaker cells in the embryonic atria and ventricles do not have time to reach the threshold needed to initiate a propagated wave of depolarization unless they are isolated from the more rapidly firing sinus venosus.
A similar hierarchy of pacemaker activity exists in the adult human heart (Table 15-1), where impulses conducted from the SA node pacemaker normally suppress the slower pacemaker activity in the AV node and His-Purkinje system. The activity of the lower pacemakers can become manifest only when they fire more rapidly, when the SA node pacemaker is slowed, or when conduction of impulses generated in the SA node is blocked (see Chapter 16).
The rate of pacemaker discharge by the normal resting human SA node is 60 to 100 times per minute, whereas the firing rate of the most rapid lower pacemakers, generally found in the lower (NH) region of the AV node, is ∼40 to 55 beats/min. Pacemaker cells in His-Purkinje system depolarize spontaneously at rates of ∼25 to 40 beats/min (Table 15-1). Unfortunately, in spite of their large number, these lower pacemakers often fail to initiate a propagated wave
of depolarization when they become isolated electrically from the SA node. The resulting cessation of ventricular contraction is an important cause of cardiac arrest.
of depolarization when they become isolated electrically from the SA node. The resulting cessation of ventricular contraction is an important cause of cardiac arrest.
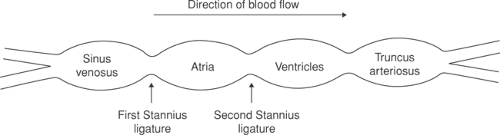 Fig. 15-1: Embryonic or primitive heart. Blood flow in these tubular hearts is from left to right. The intrinsic rates of the intrinsic pacemaker activity of each chamber decreases as one moves from the sinus venosus to the truncus arteriosus. This was demonstrated by Stannius, who in 1852 placed tight ligatures at the sinoatrial junction (first Stannius ligature) and the atrioventricular junction (second Stannius ligature) and found that elimination of the influence of the more rapid higher (“upstream”) pacemakers revealed the previously suppressed activity of pacemaker cells in the lower (“downstream”) regions. |
Dromotropy: Impulse Propagation Through the Heart
All conduction in the heart is via cardiac muscle; nerves serve only to regulate impulse generation and conduction. The normal activation sequence, shown in Table 15-1, reflects the heart’s embryology and anatomy. The impulse that originates in the SA node first activates the atria, after which it is conducted though the AV node, AV bundle, bundle branches, and His-Purkinje
system before it can activate the ventricles. In the latter, the last regions to be activated are the posterobasal left ventricle and the right ventricular outflow tract, both of which are derived in part from the truncus arteriosus. Conduction velocity is most rapid in the AV bundle, bundle branches, and Purkinje network; less rapid in atrial and ventricular myocardium; and much slower in the SA and AV nodes (Table 15-1).
system before it can activate the ventricles. In the latter, the last regions to be activated are the posterobasal left ventricle and the right ventricular outflow tract, both of which are derived in part from the truncus arteriosus. Conduction velocity is most rapid in the AV bundle, bundle branches, and Purkinje network; less rapid in atrial and ventricular myocardium; and much slower in the SA and AV nodes (Table 15-1).
Table 15-1 Normal Activation in the Human Heart | |||||||||||||||||||||||||||
|---|---|---|---|---|---|---|---|---|---|---|---|---|---|---|---|---|---|---|---|---|---|---|---|---|---|---|---|
| |||||||||||||||||||||||||||
Sa Node
The SA node in human hearts is a cigar-shaped collection of specialized cells located at the junction where the superior vena cava enters the right atrium. Impulses generated in the major pacemaker site, which lies near the center of the SA node, can follow different pathways before activating contiguous areas of the right atrium at the periphery of the node. Variations in these pathways can give rise to a benign arrhythmia called “wandering pacemaker” that is sometimes seen in normal ECGs (see Chapter 16).
Atrial Depolarization
After entering the atria from the SA node, the wave of depolarization reaches the left atrium and AV node through three preferred conducting pathways that are generally referred to as internodal tracts or ring bundles (Fig. 15-2). The anterior tract has two branches: one, called Bachmann’s bundle, transmits impulses from the right atrium to the left atrium, while the second links the SA and AV nodes. The others, called the middle and posterior internodal tracts (named after Wenckebach and Thorel, respectively), also serve as preferential conduction pathways that link the SA and AV nodes.
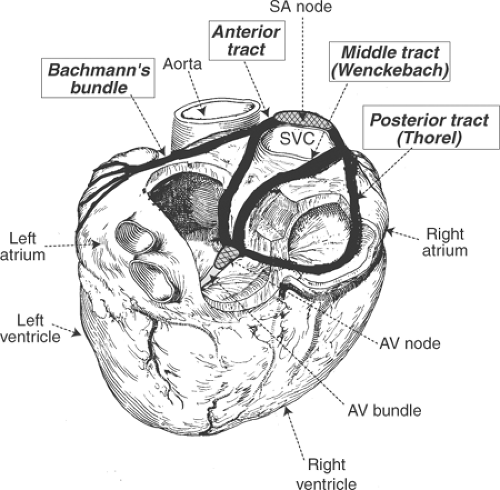 Fig. 15-2: Internodal tracts as seen in a posterior view of the heart. The anterior, middle (Wenckebach), and posterior (Thorel) internodal tracts provide preferential conduction pathways between the sinoatrial and atrioventricular nodes (cross hatched). A branch of the anterior internodal tract, sometimes called Bachmann’s bundle, provides a conduction pathway that links the right and left atria. (Redrawn from James, 1967.) |
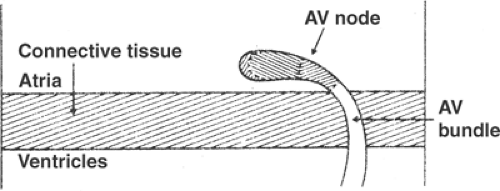 Fig. 15-3: The atrioventricular (AV) bundle provides the only conduction pathway that normally transmits impulses across the central fibrous body, which serves as a connective tissue insulator between the atria (above) and ventricles (below). The AV node controls the access of atrial impulses to the AV bundle. |
Although there is electrophysiological evidence for these rapidly conducting pathways in the atria, histological studies fail to demonstrate bundles of specialized cells surrounded by a fibrous sheath, which is the usual anatomical definition of a tract. For this reason, the rapidly conducting internodal tracts probably represent functional pathways in which preferential conduction is made possible by regions enriched in rapidly conducting Purkinje-like atrial myocytes, possibly within pectinate muscles.
Atrioventricular Conduction
Key to understanding AV conduction is that the heart’s fibrous skeleton serves as an electrical insulator which separates the atria and ventricles, and that the wave of depolarization transmitted from the SA node to the atria can normally reach the ventricles only by crossing the central fibrous body through the AV bundle (also called the bundle of His, His bundle, or common bundle, see Chapter 1). Electrical communication between the atria and the AV bundle is controlled by the AV node, a group of small nodal cells located near the coronary sinus in the posterior wall of the right atrium (Fig. 15-3). Slow conduction through the AV node, which prolongs the interval between atrial and ventricular systole, is critical to the ability of the atria to serve as a “primer pump” (see Chapter 1).
Abnormal electrical connections can link the atria and ventricles. These include accessory pathways, sometimes called a bundle of Kent, which are strands of atrial myocardium that cross the central fibrous body at many locations (Fig. 15-4). Conduction velocity in an accessory pathway is more rapid than the AV node, which allows these pathways to provide a “short circuit” that bypasses the normal delay caused by slow conduction in the AV node. Rapid conduction of atrial impulses into the ventricles by an accessory pathway is responsible for a condition called pre-excitation or the Wolff–Parkinson–White syndrome (WPW, see Chapter 16). Other abnormal conduction pathways,
called bypass fibers of James, can link the atria to the upper portion of the AV bundle and so bypass the normal conduction delay in the AV node. Mahaim fibers, which provide another abnormal pathway, can transmit impulses from the upper part of the AV bundle to the ventricles. Conduction through these abnormal pathways is a common cause of supraventricular tachycardias in which impulses go back and forth between the atria and ventricles—in one direction through the AV node and in the other direction through the abnormal pathway. Dual conducting pathways in the AV node are an even more common cause of supraventricular tachycardias (see Chapter 16).
called bypass fibers of James, can link the atria to the upper portion of the AV bundle and so bypass the normal conduction delay in the AV node. Mahaim fibers, which provide another abnormal pathway, can transmit impulses from the upper part of the AV bundle to the ventricles. Conduction through these abnormal pathways is a common cause of supraventricular tachycardias in which impulses go back and forth between the atria and ventricles—in one direction through the AV node and in the other direction through the abnormal pathway. Dual conducting pathways in the AV node are an even more common cause of supraventricular tachycardias (see Chapter 16).
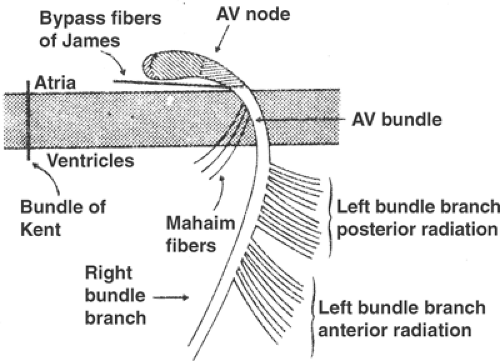 Fig. 15-4: Abnormal conduction pathways that can link the atria and ventricles. These include accessory pathways (bundle of Kent), whose locations vary; bypass fibers of James, which connect the atrial myocardium to the upper portion of the atrioventricular (AV) bundle; and Mahaim fibers, which connect the AV bundle to abnormal sites in the ventricles. |
Activation of the Ventricles: Bundle Branches, Fascicles, and Purkinje Network
The specialized conduction system of the heart, which is made up of rapidly conducting Purkinje fibers, includes the AV bundle, bundle branches, fascicles, and Purkinje network. The AV bundle divides into the right and left bundle branches at the top of the interventricular septum (see Chapter 1). The right bundle branch generally continues in a structure called the moderator band until it reaches the right ventricular free wall (Fig. 15-5), whereas
the left bundle branch fans out over the left ventricle (Fig. 15-6). The left bundle branch is conventionally viewed as dividing into two branches, called the anterior and posterior fascicles, that conduct impulses to the anterior and posterior walls of the left ventricle. The electrocardiographic abnormalities seen when conduction in one of these fascicles is interrupted are left anterior fascicular block (or left anterior hemiblock) when the anterior fascicle is blocked, and left posterior fascicular block (or left posterior hemiblock) when conduction is blocked in the posterior fascicle (see below). Although fascicular blocks are well-defined electrocardiographic entities, their anatomic basis is tenuous because division of the left bundle branch is highly variable and discrete anterior and posterior fascicles are uncommon (Fig. 15-7).
the left bundle branch fans out over the left ventricle (Fig. 15-6). The left bundle branch is conventionally viewed as dividing into two branches, called the anterior and posterior fascicles, that conduct impulses to the anterior and posterior walls of the left ventricle. The electrocardiographic abnormalities seen when conduction in one of these fascicles is interrupted are left anterior fascicular block (or left anterior hemiblock) when the anterior fascicle is blocked, and left posterior fascicular block (or left posterior hemiblock) when conduction is blocked in the posterior fascicle (see below). Although fascicular blocks are well-defined electrocardiographic entities, their anatomic basis is tenuous because division of the left bundle branch is highly variable and discrete anterior and posterior fascicles are uncommon (Fig. 15-7).
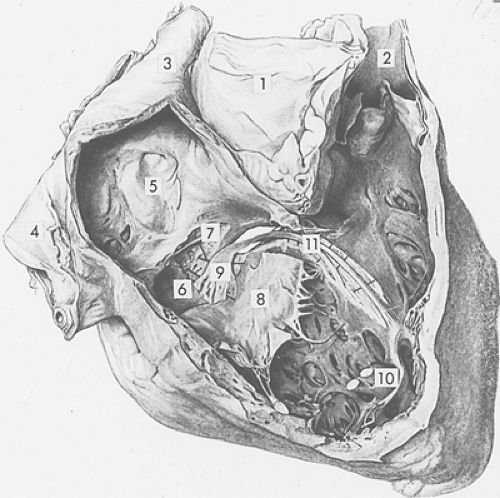 Fig. 15-5: Conduction system of the human right ventricle viewed from the right after removal of a portion of the right atrial and ventricular walls. Note the aorta (1); pulmonary artery (2); superior vena cava (3); inferior vena cava (4); fossa ovale of the interatrial septum (5); Thebesian valve overlying the coronary sinus (6); false tendon (7); and medial leaflet of the tricuspid valve, which has been separated from its point of insertion (8). The atrioventricular (AV) node (9), which lies in the right atrium above the tricuspid valve, receives branches from the atria and continues toward the ventricles where it merges into the AV bundle at the top of the membranous septum (which has been partially opened). The latter divides into the right and left bundle branches; the right bundle branch (11) courses along the right side of the interventricular septum and continues within the moderator band, usually without branching, to reach the anterior papillary muscle of the right ventricle (10). (Modified from Wenckebach and Winterberg, 1927.) |
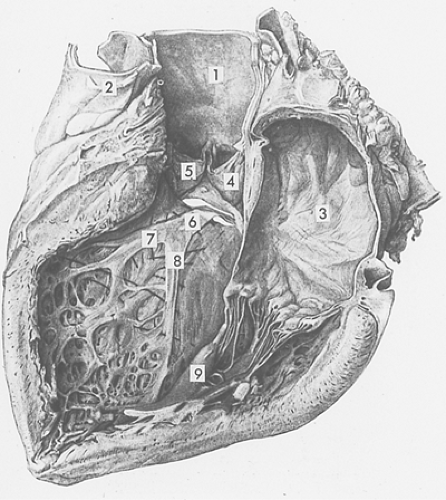 Fig. 15-6: The same heart shown in Figure 15-5, viewed from the left after removal of a portion of the left atrial and left ventricular walls. Note the aorta (1); pulmonary artery (2); left atrium (3); and two cusps of the aortic valve (4, 5). The left bundle branch, which emerges through an opening made by removal of a portion of the membranous septum, originates as a broad band (6). The left bundle branch then fans out into anterior (7) and posterior (8) fascicles, which course toward the posterior (9) and anterior (not shown) papillary muscles of the left ventricle. (Modified from Wenckebach and Winterberg, 1927.) |
The wave of depolarization that activates the working myocardial cells of the ventricles is propagated by the Purkinje network, a network of rapidly conducting cardiac myocytes that arise from the bundle branches and course within the inner third of the ventricular walls. Rapid conduction by these Purkinje fibers maximizes cardiac efficiency by synchronizing contraction of the ventricular walls. Damage to this specialized conduction system, which is seen in patients with advanced heart failure, delays activation of a portion of the left ventricle. The adverse clinical consequences of the resulting inhomogeneities in the walls of the ejecting heart can be ameliorated by a procedure called cardiac resynchronization therapy, which uses electrical stimulation to activate regions of the left ventricle where activation is delayed.
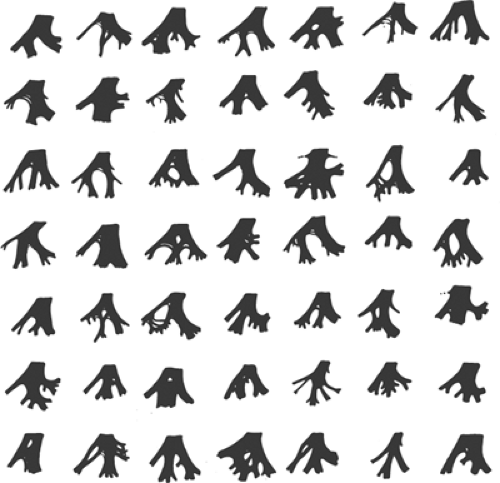 Fig. 15-7: Division of the left bundle branch in 49 human hearts showing that simple bifurcation into anterior and posterior fascicles is uncommon. (From Demoulin J-C, Thesis. Personal communication.) |
The Electrocardiogram
The electrocardiogram uses electrodes placed on the body surface to record potential differences arising within the heart (Fig. 15-8). The conventional speed of these recordings is 25 mm/s, so that each large horizontal division (time) represents 0.20 s, and each small division is 0.04 s. In the normally standardized ECG, each large vertical division (voltage) equals 0.5 mV and the small divisions are 0.1 mV.
The waves recorded by the ECG were named at the beginning of the 20th century by Einthoven, who invented the string galvanometer that made possible the first high fidelity records of the electrical activity of human hearts. To avoid controversies engendered by earlier nomenclature, Einthoven started in the middle of the alphabet and named these deflections P, Q, R, S, T, and U (Fig. 15-9). By convention, an interval is the time between the beginning of one deflection and the beginning or end of another, while segments are inscribed between the end of one deflection and the beginning of the next deflection.
The ECG provides no information regarding the absolute level of membrane potential; a “zero” potential cannot be measured because these tracings record only potential differences. The fact that the ECG records only electrical activity and not the mechanical behavior of the heart is sometimes overlooked. There is a weak correlation between the amplitude of the deflections inscribed during atrial or ventricular depolarization and the force of contraction, but these correlations are of limited value.
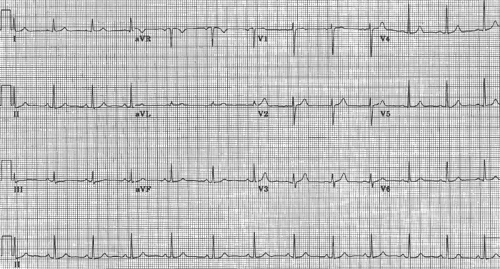 Fig. 15-8: Normal 12-lead electrocardiogram. The leads in the upper three tracings are recorded simultaneously; the lower tracing is a continuous lead II. The boxlike deflection at the left is a 1 mV standardization artifact that causes a 1.0 mm upward shift in the baseline. Paper speed is 25 mm/s, so that each heavy division is 0.2 s, and each of the smaller divisions is 0.04 s. |
The P Wave: Atrial Depolarization
The first deflection recorded by the ECG, named the P wave by Einthoven (Fig. 15-9), is caused by atrial depolarization. Although depolarization of the SA node precedes atrial depolarization (Fig. 15-10), the potential differences generated in this structure are very small and cannot be recorded at the body surface.
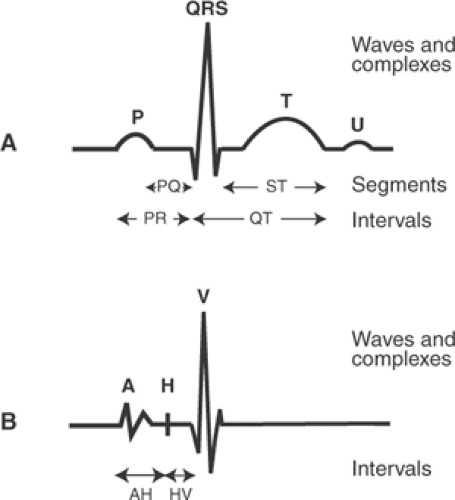 Fig. 15-9: Relationship between the electrocardiogram (ECG) and an intracardiac electrogram. A: Potential differences recorded by the ECG from leads at the body surface showing waves, complexes, segments, and intervals. B: The same electrical events recorded by an electrode catheter placed over the AV bundle within the heart. The AH interval is the time between atrial depolarization (A) and the passage of the impulse through the atrioventricular (AV) bundle (H) and the HV interval is the time between depolarization of the AV bundle (H) and ventricular activation (V). |
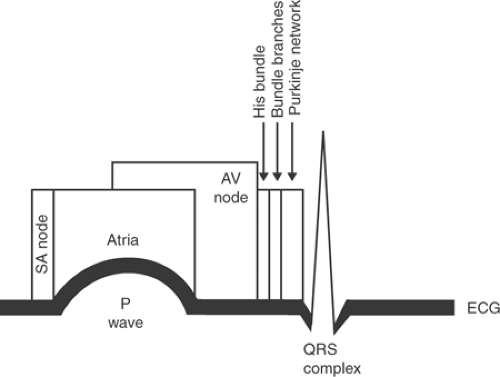 Fig. 15-10: Tissues depolarized by a wave of activation initiated in the sinoatrial node superimposed on the deflections of the electrocardiogram. Depolarization of many important structures during the PR interval does not generate potential differences sufficiently large to be recorded at the body surface. SA, sinoatrial; AV, atrioventricular. |
The width (duration) of the P wave, which reflects the time taken for the wave of depolarization to spread over the atria, can be prolonged by atrial enlargement or an intra-atrial conduction delay. Potential differences generated during atrial repolarization, which can be recorded as the TP wave (the “T of the P”), are rarely seen because they are small and usually “buried” in the much larger QRS complex. TP waves can be seen when P waves are not followed by QRS complexes, as in AV block (see Chapter 16).
The PR Interval: Atrioventricular Conduction
The ECG returns to its baseline at the end of atrial depolarization where it normally remains until the onset of ventricular depolarization. However, a great deal is happening in the heart during this “silent” period (Fig. 15-10).
The interval between atrial and ventricular activation, called the PR interval, begins with the first deflection of the P wave and ends with the first deflection of the QRS complex (whether the latter is a Q wave or an R wave as defined below). During the PR interval, the wave of depolarization is propagated through the AV node, AV bundle, bundle branches, fascicles of the left bundle branch, and Purkinje network (Fig. 15-10). Activation of these specialized conducting structures is extremely important, but does not influence the body surface ECG because of their small size.
Electrode catheters passed into the right heart and placed over the AV bundle can record a His bundle electrogram whose timing can be used to measure the passage of the wave of depolarization from the atria to the AV bundle (AH interval), and from the AV bundle to the ventricles (HV interval) (Fig. 15-9). Prolongation of the PR interval caused by a conduction delay in the AV node prolongs the AH interval, whereas a delay in AV conduction that is due to slow passage of the wave of depolarization through the AV bundle prolongs the HV interval (see Chapter 16).
The QRS Complex: Ventricular Depolarization
The QRS complex is generated by potential differences that appear during the upstrokes (phase 0) of the action potentials that activate the ventricular myocardium (Fig. 15-11). The relationship between the electrical events in the ventricles and the potential differences that can be recorded at the body surface shown in Figure 15-11 is oversimplified because the ECG is influenced by the action potentials in all of the millions of cells that are depolarized and repolarized during each cardiac cycle.
The “waves” (deflections) of the QRS complex are named according to the following convention: Q, any initial downward deflection followed by an upward deflection (if there is only a downward deflection, this is called a QS); R, the first upward deflection whether or not it is preceded by a Q wave; S, any downward deflection preceded by an R wave. Additional upward deflections after S waves are called Rœ, R–, etc., and additional downward deflections after R waves are Sœ, S–, etc.
Loss of the normal synchrony of right and left ventricular depolarization prolongs the QRS complex. This can occur when conduction is blocked in one of the bundle branches (bundle branch block), or when a ventricular premature depolarization activates one ventricle before the other (see Chapter 16). The QRS complex can also be prolonged by slowed conduction in the distal His-Purkinje system; this condition, sometimes called arborization block, can occur in patients with severe cardiac disease, notably end-stage heart failure.
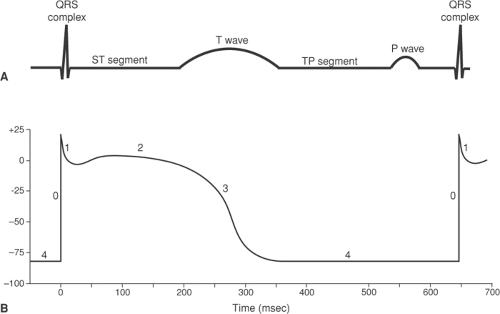 Fig. 15-11: Temporal relationships between the electrocardiogram (A) and a ventricular action potential (B). The QRS complex is produced by the upstrokes (phase 0) of all of the action potentials in the ventricles; the isoelectric ST segment corresponds to the plateau (phase 2), while the T wave is inscribed during ventricular repolarization (phase 3). The isoelectric segment between the T wave and the P wave of the subsequent cardiac cycle, called the TP segment, is inscribed during ventricular diastole (phase 4). |
The ST Segment: Plateau of the Ventricular Action Potential
Following inscription of the QRS complex, the ECG normally returns to, or very nearly to, its baseline, where it remains until repolarization generates a T wave. This isoelectric phase, called the ST segment, corresponds to the plateau (phase 2) of the ventricular action potentials (Fig. 15-11), when there are no potential differences at the body surface because all regions of the ventricle are depolarized. The fact that the normal ECG is at the baseline during both the ST segment and the TP segment (between the T wave and the P wave of the subsequent cardiac cycle) might seem to be counterintuitive because the ST segment is recorded when the ventricles are fully depolarized, whereas the TP segment occurs when the ventricles are fully repolarized and at their resting potential. The reason that the record is at the baseline at both times is that there are no potential differences when all regions of the ventricles are depolarized and when they are all at their resting potential.
When the ST segment is displaced relative to the TP segment, it is not possible to determine whether the abnormality is due to abnormal potential differences in the resting ventricles (during the TP segment), abnormal potential differences during depolarization (during the ST segment), or both. By convention, the TP segment is assumed to represent the baseline (“zero” potential), so that both are described as ST segment shifts.
The T Wave: Ventricular Repolarization
Repolarization of the ventricles generates the T wave (Fig. 15-11). Unlike the sharp deflections of the QRS complex, which are due to rapid changes in the direction followed by the wave of depolarization as it is propagated over the ventricles, the T wave is broad because repolarization is a slower, non-propagated process. Local factors and heterogeneities in the delayed rectifier potassium channels have a major influence on repolarization, and are the main reason why the sequence of ventricular repolarization differs from that of depolarization (see below).
Stay updated, free articles. Join our Telegram channel

Full access? Get Clinical Tree


