An example of the electrocardiographic pattern of acute anterior myocardial infarction described by deWinter et al is presented, and its implications is discussed.
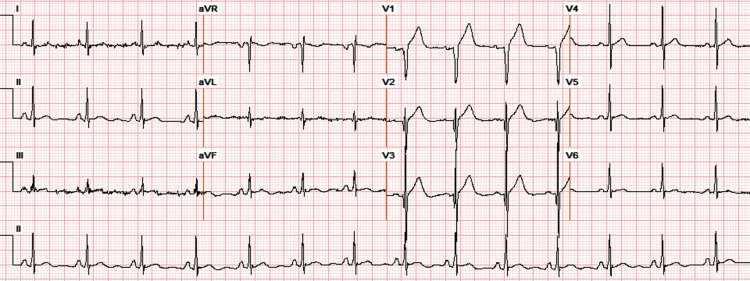
A 50-year-old man with a history of diabetes, smoking, and hypertension presents with chest pain that has been ongoing for one and a half hours. The presenting electrocardiogram (ECG) ( Figure 1 ) shows sinus rhythm, poor precordial R-wave progression, and peaked and ample T waves in leads V 2 through V 4 , along with upsloping ST depression in those leads. ST depression of a different morphology (horizontal) is seen in the inferior and lateral leads, and 2-mm ST elevation is seen in lead aVR. Multiple ECGs performed over the course of the next hour show a similar, static pattern, without the occurrence of precordial ST elevation.

Transradial coronary arteriography performed 70 minutes after the first ECG shows a subtotal proximal occlusion of the left anterior descending (LAD) coronary artery, along with Thrombolysis In Myocardial Infarction grade 2 coronary flow. This is successfully treated with 1 drug-eluting stent, after which the patient’s chest pain fully resolves. An ECG performed 30 minutes after coronary stenting shows normalization of the T-wave amplitude in leads V 2 to V 4 and resolution of all ST depressions ( Figure 2 ). The troponin I level peaks at over 80 ng/ml, whereas the creatine kinase level peaks at 2,514 units/L. Echocardiography performed the next day shows anteroseptal akinesis with an overall left ventricular ejection fraction of 40%.