The relative incidence of long-term adverse effects between low-osmolar contrast media (LOCM) and iso-osmolar contrast media (IOCM) after coronary angiography is still unclear. We analyzed cardiology patients undergoing coronary angiography from January 2006 to July 2013 using either LOCM (iohexol, iopromide) or IOCM (iodixanol) at a single institution. For each contrast medium, primary (all-cause mortality, n = 6,992) and secondary outcomes (long-term renal injury and cardiovascular events beyond 90 days, n = 2,792) were recorded. Inverse probability weighing (IPW) was applied to minimize the selection bias between groups. Unadjusted all-cause mortality was significantly lower for LOCM versus IOCM (hazard ratio [HR] 0.28, 95% CI 0.23 to 0.34). After multivariate Cox regression or IPW, all-cause mortality became comparable and lost statistical significance. Chronic kidney disease subgroup had higher mortality risk when receiving LOCM compared with IOCM (regression adjusted HR 1.80, 95% CI 0.95 to 3.42; IPW-adjusted HR 1.57, 95% CI 0.99 to 2.48). In conclusion, after coronary angiography, patients receiving LOCM had comparable overall long-term mortality compared with IOCM after adjustment. LOCM tended to induce higher long-term mortality than IOCM in chronic kidney disease cohorts.
Low-osmolar contrast media (LOCM) and iso-osmolar contrast media (IOCM) are frequently used in clinical practice. Contrast induced nephropathy (CIN) is formally defined within a 48∼72–hour window after contrast media (CM) exposure. Long-term morbidity and mortality after CM administration is increasingly recognized and may be associated with CIN, although the mechanism is unclear. In human studies, CIN has been shown to evolve to persistent renal damage and increased mortality, both for LOCM at 6 to 8 months and IOCM at 3 months. Little work however has been done to directly compare the long-term adverse effects of LOCM against IOCM and as such, clear evidence regarding the long-term benefit of using more expensive IOCM is lacking. We sought to compare the long-term adverse outcomes between IOCM and LOCM in a large retrospective population undergoing coronary angiography. Inverse probability weighing (IPW) was performed to balance large sets of covariates in this study.
Methods
We conducted this retrospective cohort study in a university-affiliated, tertiary teaching hospital in Nanjing, People’s Republic of China. The study was approved by the institutional review board.
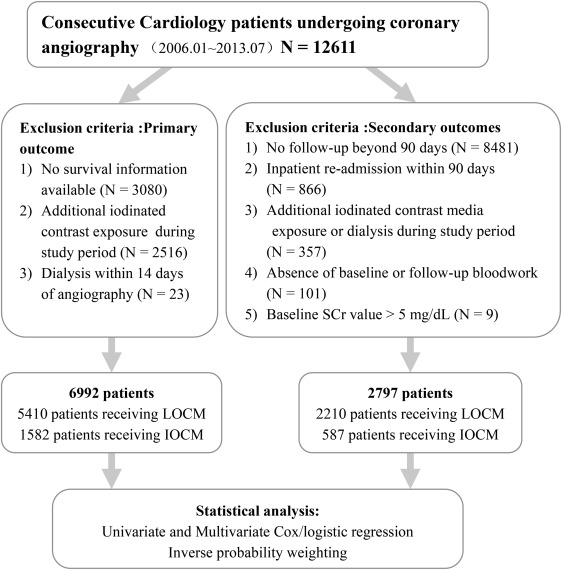
Consecutive patients undergoing coronary angiography in the cardiology department of our hospital from January 2006 to July 2013 were reviewed. Patients who had previous exposure to iodinated CM 1 year before coronary angiography or any subsequent postangiography CM exposure for the study duration were excluded. Additional exclusion criteria for primary outcome analysis (all-cause mortality) and secondary outcomes (long-term kidney injury and cardiovascular events beyond 90 days) were listed in Figure 1 .
Patients’ demographic information, clinical diagnosis, medications, and laboratory results were extracted from the electronic medical record and Picture Archiving and Communication System (Neusoft Co., Ltd, Shenyang, China). Mortality information was retrieved from the database of the Municipal Public Security Bureau of Nanjing, China.
Three CM were used in the study. LOCM included iopromide (Ultravist 370; Bayer healthcare, Guangzhou, China) and iohexol (Omnipaque 350; GE healthcare, Shanghai, China) with IOCM being represented by iodixanol (Visipaque 320; GE healthcare). Institutional practice is to reserve IOCM for patients with relevant co-morbidity including advanced age with LOCM being used for the remaining majority. Total administered CM dose varied with the specific procedures and was recorded after each examination. An intraarterial route of administration was used in all patients in keeping with standard coronary angiographic technique. Intravenous hydration with 0.9% saline solution at 1.5 ml/kg per hour, for 8 hours before and 8 hours after angiography was routinely used except where there was contraindication for volume expansion such as congestive heart failure.
Patient related variables accounted for in covariate analysis included: age, gender, Charlson Comorbidity Index (CCI), health insurance category (self-pay, partial covered, full covered), history of diabetes mellitus, hypertension, chronic kidney disease (CKD), and coronary heart disease. CKD was defined as baseline serum creatinine (SCr) ≥1.7 mg/dl for men and ≥1.5 mg/dl for women. Inpatient medications included: angiotensin-converting enzyme inhibitors or angiotensin receptor blocker, statin, β blocker, aspirin, diuretics (thiazide, loop diuretics, spironolactone), metformin, and aminophylline. Inpatient laboratory work included: baseline preangiography SCr, follow-up SCr (at clinical follow-up beyond 90 days), hemoglobin level, and proteinuria. Additional variables included contrast volume, percutaneous coronary intervention (PCI), and days of follow-up.
The primary outcome was all-cause mortality at study end, September 23, 2014. Secondary outcomes included biochemical renal impairment and cardiovascular events beyond 90-days of coronary angiography. The presence of significant long-term kidney injury was defined as an increment of SCr ≥0.5 mg/dl or a relative increase of ≥25% over the baseline at clinical follow-up beyond 90 days.
Cardiovascular events included new diagnoses of acute myocardial infarction, congestive heart failure, and stroke beyond 90 days of contrast injection.
For primary outcome (all-cause mortality), propensity scores were calculated by modeling the probability of receiving IOCM based on 19 variables (age, gender, time to study end, contrast volume, PCI, health insurance, angiotensin-converting enzyme inhibitors or angiotensin receptor blocker, statin, β blocker, aspirin, diuretics, metformin, aminophylline, CCI, diabetes mellitus, hypertension, cardiac function, CKD, and coronary heart disease; Table 1 ). A restricted cubic spline with 5 knots was applied for each of the continuous variables during propensity score estimation. An additional 4 variables were considered for the analysis of secondary outcomes that included follow-up interval (days from admission for angiography to first routine clinical follow-up), basal SCr level, hemoglobin level, proteinuria. The Student t test or Mann–Whitney U test was applied for normally distributed or skewed data to examine the difference between groups. Categorical data were compared using the chi-square test and Fisher’s exact test.
| Variable | Unadjusted full data | IPW adjusted data | ||||
|---|---|---|---|---|---|---|
| LOCM (n = 5410) | IOCM (n = 1582) | SMD ∗ | LOCM (n = 5247) | IOCM (n = 1464) | SMD ∗ | |
| Age (years) | 59 (52-68) | 74 (65-79) | 1.12 | 61 (53-71) | 63 (54-71) | 0.06 |
| Women | 2998 (55.4%) | 737 (46.6%) | 0.18 | 2797 (53.3%) | 742 (50.7%) | 0.05 |
| Time to study end (days) | 1519 (949-2174) | 910 (620-1337) | 0.84 | 1425 (868-2055) | 1418 (831-1972) | 0.01 |
| Contrast volume ≥ 150 ml | 512 (9.5%) | 146 (9.2%) | 0.04 | 161 (3.1%) | 58 (4.0%) | 0.05 |
| Percutaneous coronary intervention | 838 (15.5%) | 523 (33.1%) | 0.40 | 1007 (19.2%) | 333 (22.7%) | 0.09 |
| Health insurance | ||||||
| Self-pay | 425 (7.9%) | 125 (7.9%) | 0.00 | 419 (8.0%) | 112 (7.7%) | 0.01 |
| Partial coverage | 4908 (90.7%) | 1426 (90.1%) | 0.02 | 4748 (90.5%) | 1327 (90.6%) | 0.00 |
| Full coverage | 77 (1.4%) | 31 (2.0%) | 0.04 | 80 (1.5%) | 25 (1.7%) | 0.02 |
| Medications | ||||||
| ACE-I/ARB | 2642 (48.8%) | 974 (61.6%) | 0.25 | 2686 (51.2%) | 787 (53.8%) | 0.05 |
| Statin | 4438 (82.0%) | 1469 (92.9%) | 0.32 | 4412 (84.1%) | 1284 (87.7%) | 0.10 |
| Beta-blocker | 3559 (65.8%) | 1070 (67.6%) | 0.04 | 3484 (66.4%) | 1026 (70.1%) | 0.08 |
| Aspirin | 5251 (97.1%) | 1510 (95.4%) | 0.08 | 5054 (96.3%) | 1415 (96.7%) | 0.02 |
| Diuretics | 534 (9.9%) | 486 (30.7%) | 0.54 | 742 (13.8%) | 250 (17.1%) | 0.09 |
| Metformin | 1730 (32.0%) | 593 (37.5%) | 0.12 | 1731 (33.0%) | 517 (35.3%) | 0.05 |
| Aminophylline | 34 (0.6%) | 36 (2.3%) | 0.14 | 58 (1.1%) | 19 (1.3%) | 0.02 |
| Comorbidities | ||||||
| Charlson comorbidity index | 0 (0-1) | 1 (0-2) | 0.67 | 1 (0-1) | 1 (0-1) | 0.05 |
| Diabetes mellitus | 2191 (40.5%) | 848 (53.6%) | 0.26 | 2262 (43.1%) | 656 (44.8%) | 0.03 |
| Hypertension † | ||||||
| Normal/high normal | 1793 (33.1%) | 370 (23.4%) | 0.22 | 1646 (31.4%) | 445 (30.4%) | 0.02 |
| Grade 1 | 401 (7.4%) | 99 (6.3%) | 0.05 | 374 (7.1%) | 106 (7.2%) | 0.00 |
| Grade 2 | 1197 (22.1%) | 381 (24.1%) | 0.05 | 1181 (22.5%) | 297 (20.3%) | 0.05 |
| Grade 3 | 2019 (37.3%) | 732 (46.3%) | 0.18 | 2046 (39.0%) | 616 (42.1%) | 0.06 |
| Cardiac function (class III-IV) ‡ | 387 (7.2%) | 317 (20.0%) | 0.37 | 541 (10.3%) | 176 (12.0%) | 0.05 |
| Chronic kidney disease | 182 (3.4%) | 188 (11.9%) | 0.32 | 278 (5.3%) | 93 (6.4%) | 0.05 |
| Coronary heart disease | 4736 (87.5%) | 1447 (91.5%) | 0.13 | 4621 (88.1%) | 1292 (88.3%) | 0.01 |
∗ Standardized mean differences are the absolute difference in means or percentage divided by an evenly weighted pooled SD.
† Normal/high normal: below 139 mm Hg systolic and/or below 89 mm Hg diastolic; grade 1: 140 to 159 mm Hg systolic and/or 90 to 99 mm Hg diastolic; grade 2: 160 to 179 mm Hg systolic and/or 100 to 109 mm Hg diastolic; grade 3: above 180 mm Hg systolic and/or above 110 mm Hg diastolic.
‡ Patients are classified according to the New York Heart Association (NYHA) functional classification.
IPW was performed using a marginal structural model which was further stabilized by truncating weights at the 1st and 99th percentile. As the survival analysis requires integer weights, stabilized weights were rounded to the nearest integers for the primary outcome, compared with noninteger weights for the secondary outcomes. Standardized mean difference was examined for each covariate to verify balance between IOCM and LOCM cohorts.
Kaplan–Meier curves were used to assess event free survival and the significant differences between groups were compared using the log-rank test for unadjusted and adjusted outcomes. A Cox proportional hazards regression model or logistic regression model was used to evaluate the influence of each variable on primary outcome or secondary outcomes, respectively. Variables were first analyzed using univariate regression; those with p <0.1 were further analyzed using multivariate regression. After comparing overall outcomes for LOCM versus IOCM, the hazard ratio (HR) for LOCM versus IOCM was analyzed in high-risk subgroups identified by multivariate Cox regression with a stepwise method. All statistical analyses were performed with R version 3.3.0 (R Development Core Team, Vienna, Austria).
Results
A total of 12,611 consecutive patients were initially identified. Of these, 6,992 patients were finally included for primary outcome analysis (LOCM: 5,410 patients, IOCM: 1,582 patients). About 2,797 patients were included for secondary outcomes (LOCM: 2,210 patients, IOCM: 587 patients; Figure 1 ).
Before IPW, most covariates between LOCM and IOCM were unbalanced (standardized mean difference >0.1; Table 1 ): patients with IOCM were older, prone to have more co-morbidities, and poorer baseline laboratory tests (SCr, urine protein, hemoglobin level; data not shown). After IPW, the standardized mean differences of most covariates between groups decreased dramatically (<0.1) and lost statistical significance (p >0.05; Table 1 ).
Unadjusted all-cause mortality for LOCM was significantly lower than IOCM (HR 0.28, 95% CI 0.23 to 0.34). There were 10 covariates were identified as independent risk factors after using multivariate Cox regression, which were age, gender, time to study end, contrast volume, aspirin, diuretics, CCI, diabetes mellitus, cardiac function, and CKD. The adjusted HR increased to 0.90 with 95% CI of 0.69 to 1.17 when the data were adjusted for the aforementioned 10 covariates. The IPW method produced a much higher adjusted HR of 1.25 (95% CI 0.95 to 1.65) compared with unadjusted value ( Figure 2 ). These trends were cleared demonstrated by unadjusted ( Figure 3 ) and adjusted ( Figure 3 ) survival curves: patients receiving LOCM had significantly lower survival rate than IOCM; however, this significance disappeared when multivariate Cox regression and IPW were applied.


