Global longitudinal strain (GLS) is used to evaluate left ventricular (LV) performance after chemotherapy. Differentiating between reduction in GLS due to clinical change and normal temporal variability in measurement remains a challenge. We quantified interobserver, test-retest variability of GLS by expert observers in relation to variability of GLS quantified for clinical assessment by sonographers in our laboratory. We examined the temporal variability of GLS in 30 patients with normal LV ejection fraction (LVEF >53%) undergoing chemotherapy in the absence of change in medications and clinical symptoms in up to 5 sequential echocardiograms. GLS was quantified using EchoPAC (GE Healthcare, Milwaukee, Wisconsin) and 2-dimensional biplane LVEF was measured from 4- and 2- chamber views. Interobserver test-retest variability of GLS measured in 10 random patients by 2 expert readers was calculated using a one-way analysis of variance. Square root of mean squared error provided the SEM for temporal variability. Baseline LVEF was 59.3 ± 5.1% and remained relatively unchanged over 12 months, p = 0.87. Temporal variability of GLS measured by sonographers was 1.28% and similar to interobserver test-retest variability of GLS measured by expert observers, 1.12% (p = 0.17). Maximum detectable difference in GLS measured by expert observers was similar to that derived from sequential measurements of GLS (3.2% vs 3.6%, respectively). Temporal variability of GLS among clinically stable patients is 1.28% and similar to interobserver test-retest variability of 1.12% measured by expert observers. In conclusion, a reduction in strain >3.2% during sequential echocardiograms under these conditions may be significant.
Chemotherapy with potentially cardiotoxic agents including anthracycline-based agents and trastuzumab can result in myocardial dysfunction. Myocardial changes may occur well before the onset of clinical symptoms. Chemotherapy-related cardiac dysfunction has been defined as a decrease in left ventricular ejection fraction (LVEF) of >10% to a value <53% confirmed by repeated cardiac imaging 2 to 3 weeks later, and subclinical LV dysfunction has been defined as a relative decrease in global longitudinal strain (GLS) by >15% confirmed by repeated cardiac imaging 2 to 3 weeks later. Repeated measurement of GLS and LVEF by different observers are subject to interobserver and intraobserver variability as well as interobserver test-retest variability. We sought to evaluate the interobserver, intraobserver and test-retest variability, along with temporal variablity of GLS in patients undergoing chemotherapy with trastuzumab when GLS measurements were performed by expert observers.
Methods
This is a retrospective analysis of data from 30 consecutive female patients with a history of breast cancer who underwent chemotherapy with trastuzumab and echocardiography in our laboratory from June 2011 to December 2015. Patients were included if they satisfied the following criteria: (1) at least 3 sequential echocardiograms, including a baseline echocardiogram before treatment with each performed at 3-month intervals; (2) all echocardiography studies performed with Vivid 7 or E9 (GE Healthcare, Milwaukee, Wisconsin) ultrasound systems; (3) images acquired with a high frame rate for speckle strain analysis; (4) normal LVEF at every study (defined as LVEF ≥53%); (5) no new medications added or removed between the time that strain measurements were performed; and (6) clinically stable between the time that strain measurements were performed. Exclusion criteria consisted of the following: (1) treatment with any other chemotherapy in addition to trastuzumab ; (2) baseline diagnosis of coronary artery disease; (3) more than mild valvular heart disease; (4) hospitalization for any reason; and (5) suboptimal tracking of more than 2 myocardial segments. The study was approved by the Institutional Review Board at the Cleveland Clinic.
Echocardiograms were performed for clinical purposes, and GLS was measured by sonographers and verified by physicians; briefly, apical 2- and 4-chamber and triplane acquisitions were obtained in each patient with optimization of image quality, sector size, depth, and the number of heart beats during acquisition. For LVEF, 2-dimensional (2D) biplane measurements were performed by manual contouring of the 4- and 2-chamber views either online or offline with EchoPAC (GE Healthcare). For GLS, apical 3-, 2-, and 4-chamber grayscale images were obtained at a high frame rate (40 to 80 frames/s) with commercially available equipment (Vivid 7 or E9; GE Healthcare). GLS was quantified offline with EchoPAC (GE Healthcare) and verified by a physician. GLS was measured for 3-, 2-, and 4-chamber views separately, and all 18 myocardial segments were averaged to obtain the GLS. Absolute values of GLS are in percentage. Segments that were inadequately tracked were excluded from the analysis.
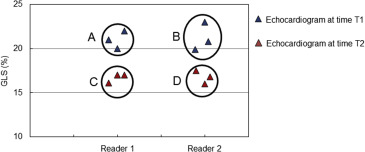
Interobserver and intraobserver variability and interobserver test-retest variability of GLS was tested among 10 patients using a method of SEM calculation by Eliasziw et al ( Figure 1 ). For interobserver and intraobserver variability, 3 independent highly trained expert observers (SK, PC, and BT) blinded to the others’ results and their own previous results measured GLS from echocardiograms performed in 10 unique patients who were drawn from the larger cohort of patients included in this study. Each observer obtained 2 measurements of GLS for each individual patient. Observer variability was expressed as interobserver and intraobserver standard error of measurement (SEM inter , SEM intra ).
For interobserver test-retest variability, 2 independent measurements of GLS for each of 10 patients by observer 1 from echocardiogram performed at one given time point was compared with 2 independent measurements of GLS for these same 10 patients made by a second observer from an echocardiogram performed 3 months later. The interobserver test-retest variability expressed as SEM test-retest provides an estimate of the expected variability in EF in an echocardiography laboratory where the measurements might be performed by different sonographers or physicians at different time points during the follow-up period.
To ascertain if there was a significant temporal variability of clinically measured hemodynamic and echocardiographic parameters including heart rate (HR), systolic blood pressure (SBP), diastolic blood pressure (DBP), LVEF, GLS, left atrial volume, LV end-diastolic volume (LVEDV), deceleration time (DT) and E/e′ measured at various points in time, we used a linear mixed model with unstructured covariance for random factors. Individual hemodynamic and echocardiographic parameters were considered dependent variables, time (in months) as a fixed factor, and patients’ ID as random factor. Interobserver and intraobserver variability of GLS measured by trained expert readers in a subset of echocardiograms from 10 patients was quantified by a 2-way analysis of variance (ANOVA). Interobserver variability includes both the variability among measurements of observers and the variability within measurements of observers. Interobserver test-retest variability of GLS measured by trained expert readers was also calculated with 2-way ANOVA. This measure consists of variability within observers, among observers, and over time. One-way ANOVA was performed to obtain the mean squared error for GLS over the 5 different time points at which it was measured. The SEM given by the square root of the mean squared error represents temporal variability of GLS across the 5 time points over which it is measured. Levene’s test was used to test for differences in the SEM between GLS measurements made by expert readers and clinical GLS measurements over the 5 time points by sonographers and physicians for clinical purposes.
Results
Thirty women receiving trastuzumab were included with a mean age of 57.1 ± 11.3 years. Medications initiated before chemotherapy included β blockers ( carvedilol or metoprolol ) in 11 patients; angiotensin-converting enzyme inhibitors ( lisinopril and ramipril ) in 5 patients and statins in 4 patients ( Table 1 ). None of the patients received insulin or antiplatelet medications including aspirin and clopidogrel (Bristol-Myers Squibb, Bridgewater, New Jersey). There were no changes of medications in any individual patient between visits for echocardiographic monitoring. LVEF (2D biplane and 3D) and GLS measurements were performed for routine clinical use in all 30 patients for at least 3 consecutive time points (3, 6, and 9 months of treatment with trastuzumab ). There were 16 patients with an echocardiogram at 12 months of treatment with trastuzumab and 11 patients with echocardiograms at 12 and 15 months of treatment.
| Age (y) | 56.5 ± 9.7 |
| Body Mass Index (kg/m2) | 27.9 ± 4.2 |
| Hypertension | 12 (40%) |
| Hyperlipidemia | 5 (17%) |
| Beta blocker | 11 (37%) |
| Angiotensin converting enzyme inhibitor | 5 (17%) |
| Statin | 4 (13%) |
LV dimensions, wall thickness, and mass were within normal limits in most patients included in the study ( Table 2 ). A majority of patients had a normal DT and LV filling pressure as judged by E/e′ ( Table 1 ). Baseline LVEF (2D biplane) was within normal limits (54.9% to 67.2%). Mean LVEF measured at 3, 6, 9, 12, and 15 months (59.3 ± 5.1%, 59.6 ± 3.7%, 58.6 ± 3.5%, 59.3 ± 3.7%, and 59.7 ± 4%, respectively) remained relatively unchanged (p = 0.87; Figure 2 ). Although 3D LVEF had a p value of 0.06, there was no clear trend toward a sustained increase or decrease across the time points during which measurements were made. Other echocardiographic parameters including 3D LVEF, left ventricular end diastolic volume index (LVEDVI), left ventricular end systolic volume index (LVESVI), left atrial volume index (LAVI), DT, and E/e′ were relatively unchanged over the course of the 15-month period during which patients underwent sequential monitoring with echocardiography ( Table 3 ). HR during echocardiography was different between the different studies; however, there was no specific pattern with respect to the variation in HR. Both SBP and DBP were similar across the 5 different time points.
| Mean (n=30) | SD | |
|---|---|---|
| Heart Rate (bpm) | 79.3 | 8.9 |
| Inter-ventricular Septum diameter (cm) | 1 | 0.2 |
| Posterior Wall diameter (cm) | 0.9 | 0.2 |
| Left Ventricular End Diastolic Volume Index (ml) | 46.6 | 4.5 |
| Left Ventricular End Systolic Volume Index (ml) | 17.7 | 3.4 |
| Left Ventricular Ejection Fraction (%) 2D-Biplane | 59.3 | 5.1 |
| Global Longitudinal Strain (%) | -19.1 | 1.8 |
| Left Ventricular Mass Index (gm/m 2 ) | 74.9 | 17.6 |
| Left Atrial Volume Index (ml) | 25.1 | 3.3 |
| Deceleration Time (msec) | 211.3 | 36.7 |
| E/A | 1.1 | 0.4 |
| E/e’ | 7.5 | 2.7 |
| Time (Months) | 3 (n=30) | 6(n=30) | 9(n=30) | 12(n=16) | 15(n=11) | P -value |
|---|---|---|---|---|---|---|
| Heart Rate (BPM) | 79 (75-83) | 73 (69-77) | 69 (65-73) | 71 (67-75) | 67(63-72) | 0.01 |
| Systolic blood pressure (mm Hg) | 125 (119-132) | 126(120-133) | 127(121-133) | 129 (123-136) | 132 (125-139) | 0.47 |
| Diastolic blood pressure (mm Hg) | 73 (67-77) | 76 (71-80) | 74 (70-78) | 76 (71-80) | 71 (66-76) | 0.48 |
| 3D Left Ventricular Ejection Fraction (%) | 58 (57-59) | 60 (59-62) | 58 (57-60) | 60 (58-61) | 59 (56-61) | 0.06 |
| Global Longitudinal Strain (%) | -19.1±1.8 | -19.2±1.8 | -19.7±2.2 | -19.6±1.9 | -18.9±1.2 | 0.42 |
| LV End diastolic Volume Index (ml/m2) | 47 (43-50) | 49 (45-52) | 47 (43-50) | 47 (44-51) | 45 (41-49) | 0.31 |
| Left Atrial Volume Index (ml/m 2 ) | 25 (23-27) | 27 (25-29) | 25(23-27) | 26 (24-28) | 24 (22-27) | 0.48 |
| Deceleration Time (msec) | 211 (195-228) | 208 (192-225) | 204 (188-221) | 193 (176-210) | 211 (191-232) | 0.53 |
| E/e’ | 7.5 (8.6-8.5) | 7.4 (6.4-8.4) | 7.8 (6.8-8.8) | 7.2 (6.2-8.2) | 7.2 (6.1-8.3) | 0.76 |
Stay updated, free articles. Join our Telegram channel

Full access? Get Clinical Tree


