FIGURE 17.1. Color-flow duplex image and velocity spectra of a greater than 70% diameter-reducing stenosis in a femoroperoneal saphenous vein bypass based on peak systolic velocity (PSV) at the stenosis of 499 cm/s and end-diastolic velocity of 79 cm/s. Note the tissue bruit in the surrounding perigraft tissue caused by wall vibrations.
The concept of duplex ultrasound surveillance with preemptive revision of asymptomatic graft stenosis remains controversial, in part because of the varied threshold criteria for intervention and the success of secondary interventions. Graft occlusion despite duplex surveillance, termed primary occlusion, has a reported incidence of 5% and is associated with technical defects related to the bypass graft procedure, such as residual stenosis or low graft flow velocity (GFV), or the lack of adherence to a surveillance protocol, especially failure to undergo early (<1 month) testing.10 Clinical trials have identified high-risk groups for unheralded graft failure that may benefit from increased surveillance, including women, small-diameter saphenous vein conduits, redo bypasses, and grafts with stenosis on the first or 30-day duplex scan.5,7
The progression of myointimal graft stenosis typically occurs without ischemic limb symptoms, especially in the physically inactive patient. Thrombosis of bypasses performed for claudication typically results in the pain-free walking distance returning to prerevascularization levels, but when critical limb ischemia (CLI) was the indication for bypass grafting, graft thrombosis produces “limb-threatening” ischemia in the majority of patients, with a high likelihood of amputation unless patency can be restored. Compared to elective repair of a duplex-identified graft stenosis, the success of catheter-directed thrombolysis or surgical thrombectomy to restore patency in an occluded graft is associated with reduced long-term patency.1 A successful infrainguinal graft surveillance program has the outcome features of a low (<5%) incidence of primary graft occlusion, a high (>80%) assisted primary patency rate, reduced need for redo bypass grafting, and, in CLI patients, improved limb salvage.2,7
The components of graft surveillance testing include a clinical assessment of the patient for symptoms of limb ischemia, measurement of the ankle-brachial systolic pressure index (ABI), and lower limb duplex ultrasound imaging. The Society for Vascular Surgery (SVS) and American Heart Association (AHA) guidelines for infrainguinal bypass surveillance recommend that testing begin in the immediate postoperative period and be conducted every 6 months thereafter for at least 2 years (level of evidence: A).10,11 Testing should include duplex imaging along the entire length of the graft with measurement of PSV and calculation of Vr across all lesions. More frequent testing is appropriate if a graft abnormality is identified, using serial duplex imaging to identify progression to greater than 70% DR stenosis. This guideline is contrary to a European multicenter, randomized controlled clinic trial (Vein Graft Surveillance Trial [VGST]), which found no clinical benefit for routine duplex testing after infrainguinal vein bypass based on similar graft patency, amputation rates, and quality-of-life assessments.12 Limitations of the VGST included recruitment of patients with patent bypasses at 6 weeks or later after operation, resulting in exclusion of early graft failures that account for 10% or more of primary occlusions, and the use of low-threshold duplex interpretation criteria (doubling of PSV, graft PSV <45 cm/s) to identify the “at-risk” bypass graft.
The efficacy of duplex graft surveillance requires appropriate testing methods and interpretation criteria, along with successful and durable repairs of identified stenotic lesions. Duplex testing in the early postoperative period (1 to 4 weeks) will identify a stenosis in approximately one-third of patients, and this finding is predictive of a graft revision for progressive stenosis or thrombosis within 6 months.1,5,6,12,13 Failure to intervene on grafts with lesions having velocity spectral features consistent with greater than 70% stenosis is associated with a high (>80%) thrombosis rate.1,8 Assessment of graft patency based on the presence of pedal pulses and measurement of ABI is an insensitive technique to detect the “failing” stenotic bypass. Adherence to a duplex surveillance protocol that begins immediately after the procedure, when coupled with timely repair of greater than 70% stenosis and assessment of low PSV (<45 cm/s) grafts, should result in an annual failure rate of less than 3% per year after infrainguinal vein bypass and less than 5% per year after prosthetic bypass grafting.1,5,12–14 Duplex testing is noninvasive, less expensive, and more accurate than graft imaging using magnetic resonance (MR) or computed tomography (CT) angiographic techniques. Whether graft surveillance imparts a favorable outcome to the patient depends on several factors, including the accuracy of testing in detecting graft-threatening lesions, the success of graft repair, and patient compliance with an ongoing surveillance program to identify new lesions. For patients who require bypass grafting for CLI, postoperative diligence in monitoring functional graft patency is felt to be the cornerstone for long-term limb salvage.
GRAFT SURVEILLANCE METHODOLOGY
Vascular laboratory testing after lower limb bypass grafting is used to verify improvement in limb perfusion and the patient’s functional activity. During the patient interview, the vascular technologist should ask about maximum walking distance and any functional limb limitation, the location and character of exercise-induced pain, and recent medical events or hospitalizations. A focused physical examination of the limbs should be performed, including inspection of the foot for signs of ischemia (dependent rubor, ulcer, gangrene), edema, or cyanosis. In patients with recent procedures, nonhealed surgical sites that can interfere with duplex scanning should also be documented. Any unresolved or new symptoms or signs of limb ischemia can be evaluated based on hemodynamic data obtained from physiologic testing and duplex imaging. A review of operative reports for graft type, anastomotic sites, and other concomitant procedures (endarterectomy, angioplasty) on inflow or outflow arteries is extremely useful and helps to minimize examination time. Prior vascular testing results should be available for comparison, so any graft abnormality can be quickly located and assessed for progression or resolution. It is helpful to include a schematic diagram of the arterial bypass graft in the final report that documents any prior or new graft abnormalities identified by duplex scanning (Fig. 17.2). Finally, a useful quality measure is review of the patient’s medications to verify that antiplatelet and statin therapy is prescribed, whenever appropriate.
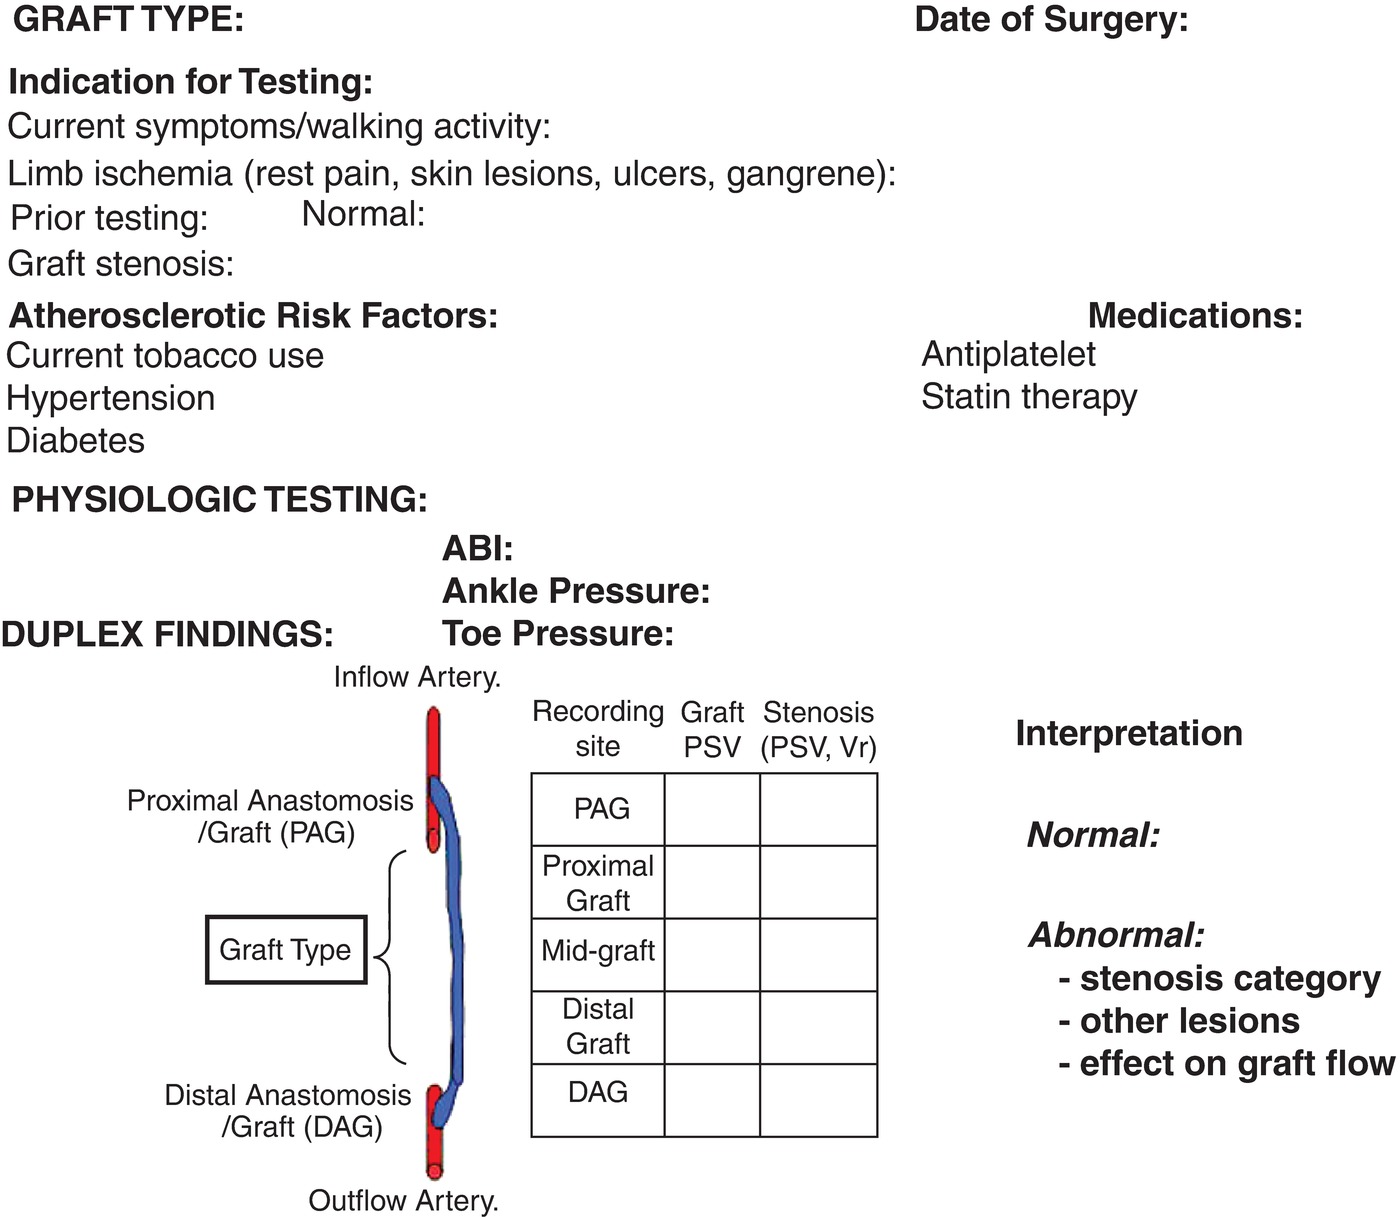
FIGURE 17.2. Essential clinical and test data to be included in the duplex graft surveillance report.
Arterial Bypass Graft Testing
Lower extremity bypass graft evaluation should include measurement of the resting ABI, toe pressure, and duplex ultrasound imaging of the entire graft including inflow and outflow arteries to the ankle level. Measurement of segmental pressures or pulse volume recordings is not recommended. Linear (5- to 7-MHz) and curved (3- to 5-MHz) array transducers should be available to image both superficial and anatomically tunneled bypass grafts and the aortoiliac segment if necessary. If open wounds are present, transducer or wound covers can be used to scan over these areas. To obtain complete graft imaging, a variety of scanning windows (anterior, medial, lateral, posterior) are necessary, including requiring the patient to rotate the leg from side to side or assume a prone position for imaging grafts to the below-knee popliteal or peroneal artery.
Color Doppler imaging is used to verify graft patency and survey the entire bypass, including anastomotic sites, for aneurysms, stenosis, or lumen defects. Serial duplex velocity spectra are recorded in normal appearing proximal, mid, and distal graft segments to calculate the average peak systolic GFV, as well as at sites of stenosis to classify the DR based on measurement of PSV and the Vr across the stenosis. The technologist imaging and interpretation skills necessary to perform bypass graft surveillance include an ability to differentiate normal versus abnormal color Doppler flow patterns at anastomoses and vein valve sites, an understanding of how graft diameter alters PSV values, recognition of common abnormalities (wound fluid collections, graft mural thrombus), and the ability to identify patent side branches with arteriovenous fistula flow after in situ saphenous vein bypass grafting. Testing should include sufficient image archiving to allow the physician’s final interpretation to confirm normal versus abnormal duplex findings, and when a stenosis is identified, determine its severity and impact on graft flow and distal limb or foot perfusion.
Knowledge of the arterial bypass graft type is important to accurate testing because duplex imaging requirements and interpretation criteria may vary. Autogenous vein bypasses may be constructed using the saphenous (great, small), arm (cephalic, basilic), or femoral veins. The in situ great saphenous vein arterial bypass is located superficially in its normal subcutaneous plane, except near the anastomotic sites. Surgeons attempt to ligate all saphenous vein side branches with an in situ graft, but finding a residual patent branch with arteriovenous flow after operation is not uncommon. When identified, the location of patent side branches and their influence on distal graft flow and limb perfusion pressure (the extent of blood flow “steal” from the bypass graft) should be determined by recording graft velocity proximal and distal to the branch. Endovascular saphenous vein harvest is now commonplace, and these conduits may be used in a reversed or in a nonreversed configuration. The in situ and nonreversed saphenous vein conduits require valve lysis, and this graft technique exposes the vein to possible valvulotome injury or incomplete valve leaflet incision. It is important to document any residual valve site stenosis along the entire vein bypass length, especially on the first postoperative examination, because these regions of “mild-to-moderate” stenosis defined by a PSV in the 180 to 250 cm/s range are often the precursor of a future critical (>70%) stenosis. At the valve sites in small-caliber (<3 mm diameter) reversed saphenous vein grafts, a functional stenosis (PSV > 180 cm/s, Vr < 2) may be present if the valve leaflets do not lie completely against the vein wall or are sclerotic (“frozen valve”).
Prosthetic conduits (Dacron-polyester; polytetrafluoroethylene [PTFE]) are generally easily imaged, with a polyester graft appearing as a corrugated or rippled vessel interface and a PTFE graft appearing as a smooth, double-lined wall conduit (Fig. 17.3). These graft conduits may have external rings to support the graft lumen and prevent compression. The caliber of prosthetic grafts is typically uniform (6, 7, or 8 mm in diameter), and thus, the PSV should not change significantly (<20 cm/s) along the length of the graft. On transverse imaging, the graft lumen should be circular and mural thrombus should not be visualized.
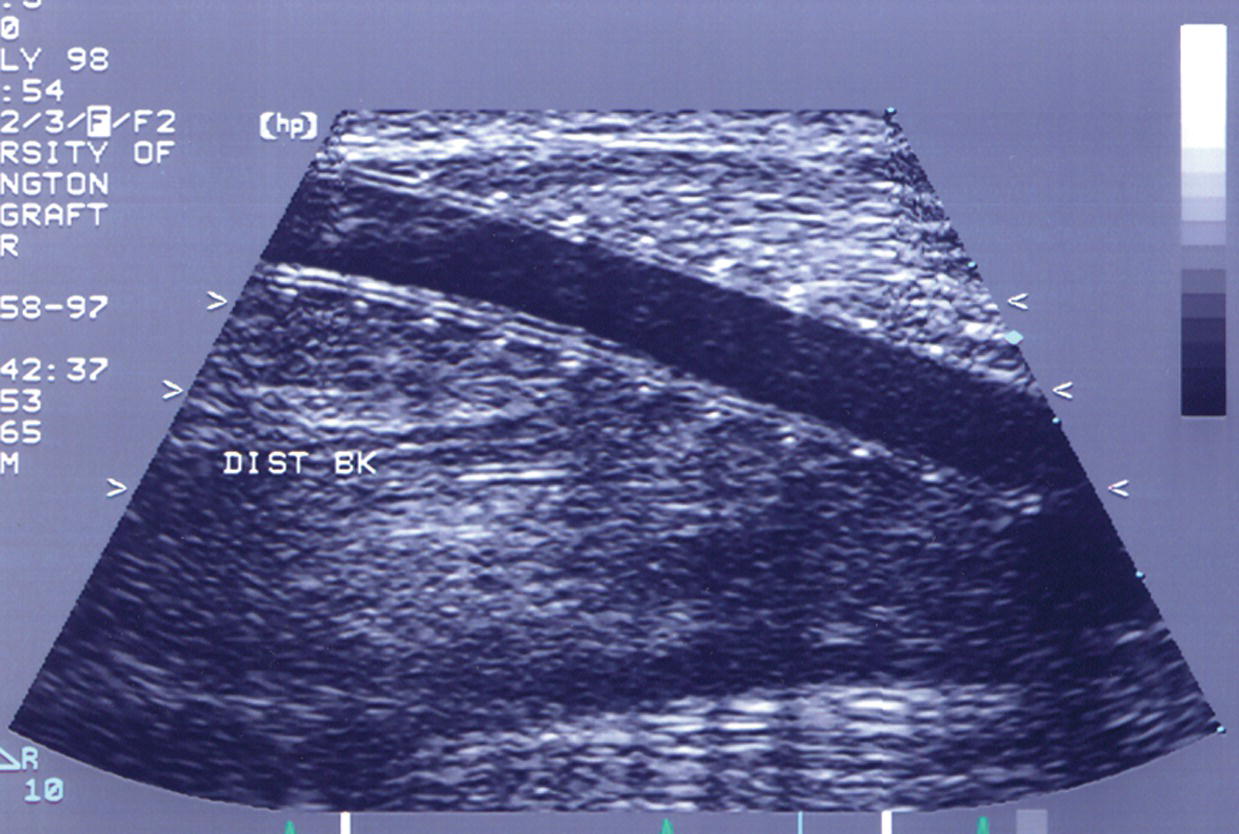
FIGURE 17.3. Longitudinal B-mode image of a ringed polytetrafluorethylene (PTFE) bypass graft. The graft wall shows the characteristic double line, and the rings are apparent as equally spaced dots along the length of the graft.
Duplex Ultrasound Imaging Protocol
Begin the duplex ultrasound evaluation at the inflow artery, which for lower limb bypass grafts is usually the common femoral artery. A more distal graft origin (deep femoral, superficial femoral, popliteal) may have been selected to shorten the vein conduit length. Image the proximal anastomosis graft (PAG) segment for abnormalities (stenosis, aneurysm, mural thrombus) and record inflow velocity spectra to verify the acceleration time (normal <180 ms). Damping of the inflow artery velocity waveform suggests a proximal occlusive lesion and should prompt interrogation of the aortoiliac segment. Color-flow Doppler imaging of anastomotic regions commonly identifies disturbed flow conditions evident by color aliasing and spectral broadening in the pulsed Doppler spectral waveforms. Use real-time B-mode and power Doppler imaging to assess the lumen caliber and presence of mural thrombus. The PSV in the proximal graft segment depends on lumen diameter and propagated flow turbulence produced by the anastomotic configuration and any stenosis, if present; thus, PSV in the proximal graft may be higher or lower than that recorded from the inflow artery.15
Perform color-flow mapping of the bypass graft using a longitudinal scan plane, reserving transverse imaging for any sites of graft abnormality. Careful imaging and pulsed Doppler spectral analysis is advised for graft segments showing color-flow turbulence and lumen caliber reduction. Image the entire length of the bypass graft to the extent possible to identify sites of intrinsic or extrinsic stenosis. It is useful to divide the graft into three segments (proximal, middle, and distal) to facilitate study interpretation regarding sites of graft stenosis and communication with the referring physician. Record velocity spectra for measurement of PSV from normal-appearing graft segments (proximal, mid, distal) to determine the mean or average GFV (Fig. 17.4).
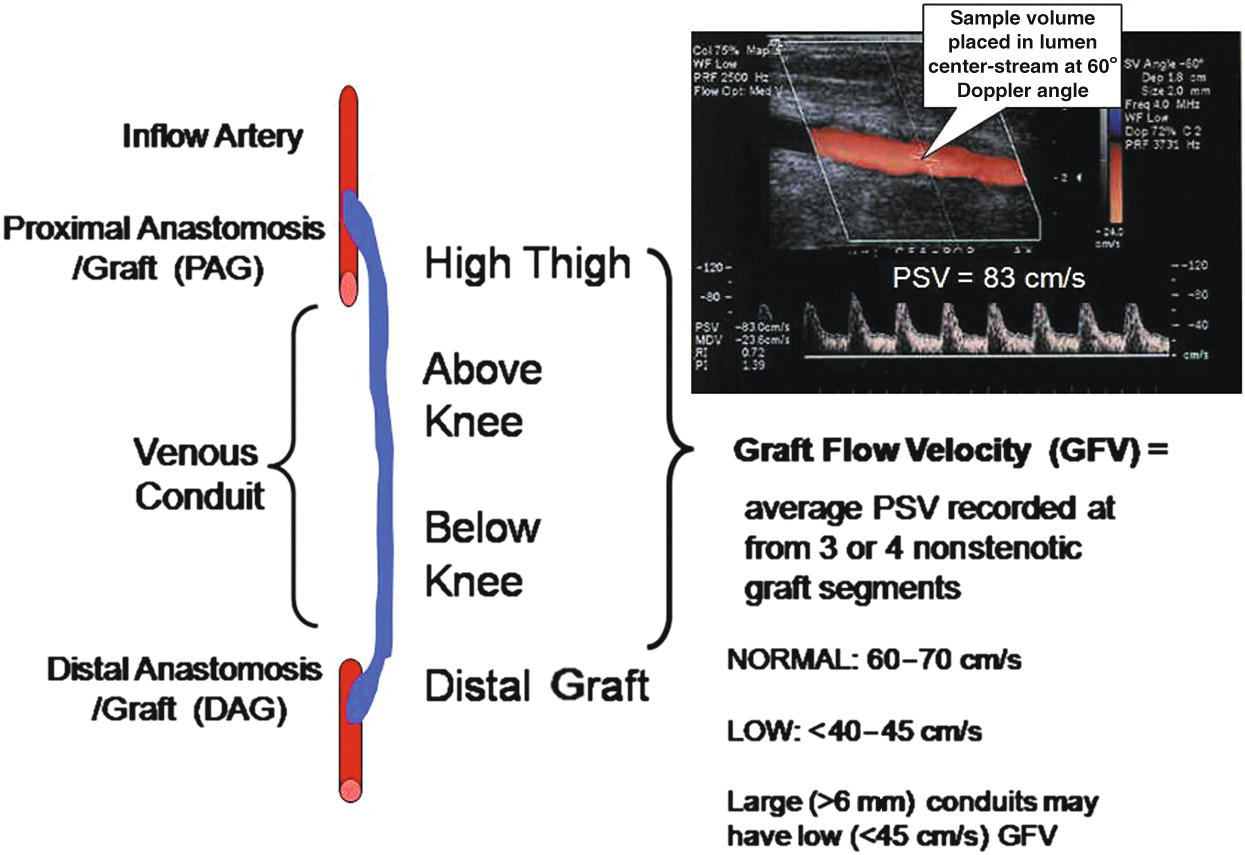
FIGURE 17.4. Schematic diagram depicts sites of duplex imaging and calculation of mean or average graft flow velocity (GFV).
When real-time color-flow Doppler imaging locates a stenosis, the pulsed Doppler sample volume is “walked through” the stenotic region to measure PSV proximal to and at the site of maximum flow disturbance. These PSV values recorded proximal to and within the “color-flow jet” are used to calculate a Vr at the stenosis and estimate the DR in three categories (<50%, 50% to 70%, and >70%). Vr is calculated by dividing the maximum PSV at the site of stenosis (PSVmax) by the PSV proximal to the stenosis (PSVprox):

Stay updated, free articles. Join our Telegram channel

Full access? Get Clinical Tree


