FIGURE 18.1. Peripheral angioplasty surveillance testing protocol and study interpretation criteria.
Duplex Testing Protocol
The patient should rest for at least 10 minutes prior to testing to ensure a resting state with pulse and blood pressure at baseline levels. Approximately 30 minutes of examination time should be allotted with testing conducted in a warm (70°F to 74°F) room to minimize vasoconstriction. Duplex scanning is generally performed with the patient supine and the lower limb externally rotated with the knee slightly bent. Prone or lateral decubitus positions can be used to image the popliteal artery, tibioperoneal trunk, and peroneal arteries. A multifrequency 5- to 8-MHz linear array transducer is appropriate for most lower extremity arterial mapping studies and allows the examiner to optimize vessel imaging at varying tissue depths.
The examination begins at the level of the common femoral artery (CFA) to document the presence of normal, multiphasic velocity spectra, indicating that there is no proximal inflow (aortoiliac) occlusive disease (Fig. 18.2). If the CFA velocity waveform is monophasic and has a damped configuration or the acceleration time (i.e., systolic upstroke) is prolonged (>180 ms), duplex imaging of the aortoiliac segment should be performed to characterize the occlusive lesion. Duplex mapping then proceeds from the CFA distally with assessment of the SFA and deep femoral artery origins, imaging the length of the SFA, assessment of the angioplasty or stented site, and recording of ankle-level tibial artery velocity waveforms. Changes in spectral waveform pulsatility from the CFA, to popliteal, to distal tibial arteries are diagnostic of interval development of occlusive disease. When the tibial artery velocity spectral waveforms and ABI are normal, the extent of duplex imaging can be limited to scanning of the treated site to confirm normal (PSV < 180 cm/s) or abnormal hemodynamics. The technologist should provide sufficient duplex images and segmental velocity spectral waveforms for complete study interpretation.
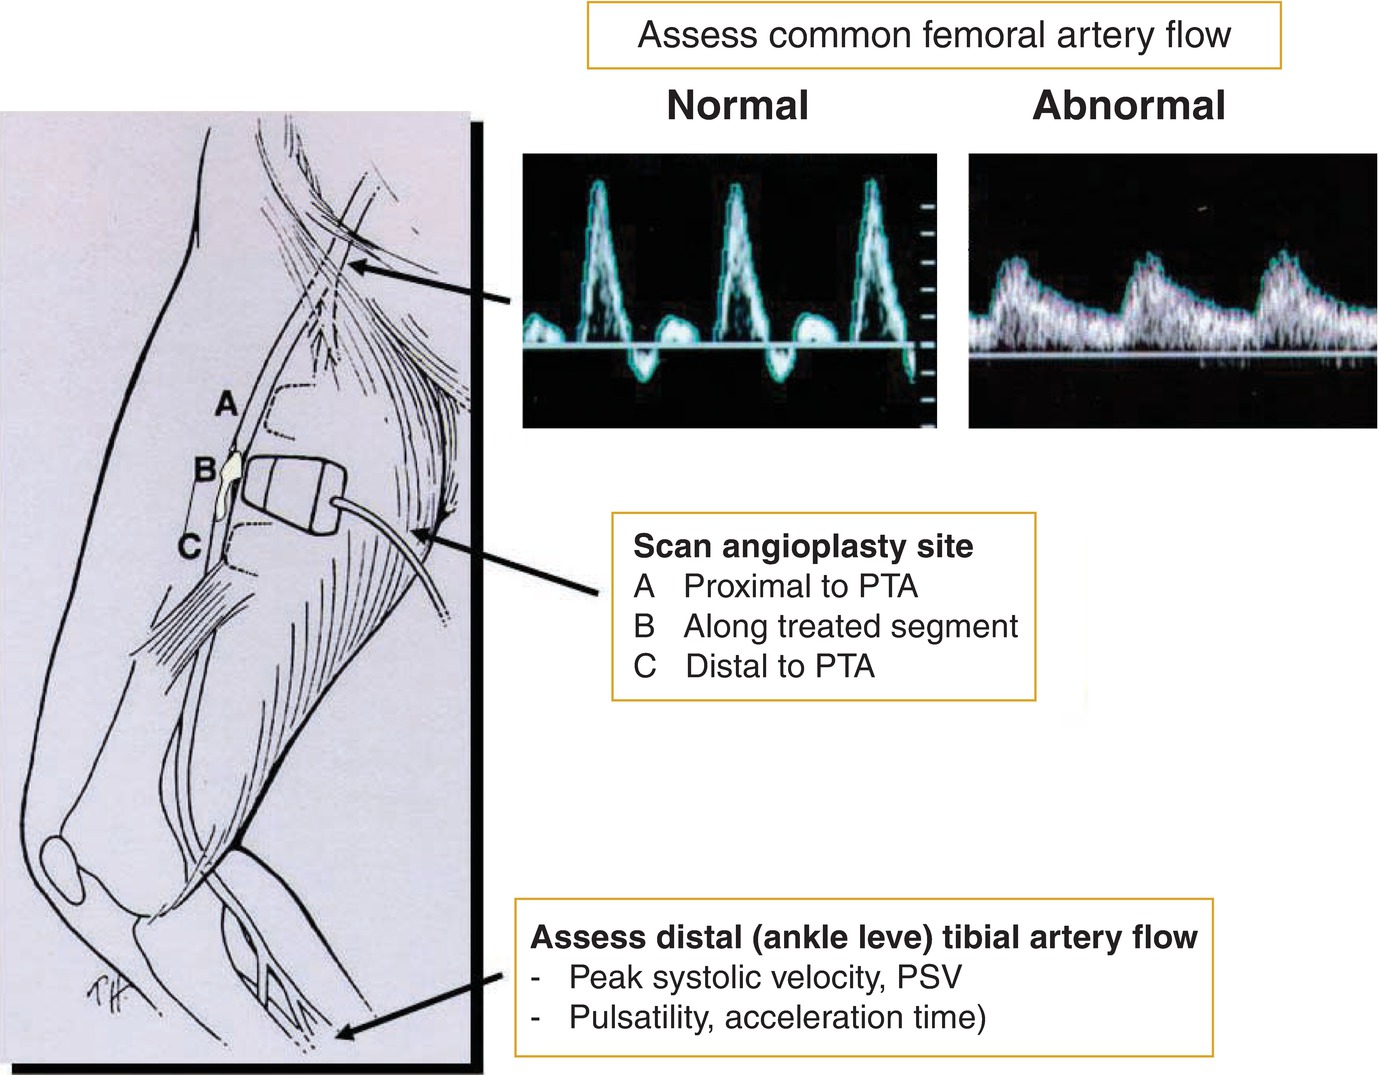
FIGURE 18.2. Schematic diagram depicts sites of duplex scanning, including common femoral artery, angioplasty site, and assessment of distal tibial artery flow. (PTA, percutaneous transluminal angioplasty; PSV, peak systolic velocity.)
Direct imaging of the endovascular repair includes color flow images and pulsed Doppler spectral waveforms proximal to, throughout, and distal to the treated segment. B-mode imaging (transverse and sagittal scan planes) is used to define vessel and stent diameters as well as to assess the lumen for myointimal stenosis, thrombus, or native artery atherosclerotic plaque. Color or power Doppler imaging is used to identify changes in lumen caliber, sites of stenosis, high-velocity flow jets, and turbulent flow. Pulsed Doppler spectral waveforms are recorded using a Doppler angle of 60 degrees or less relative to the vessel or stent wall, and the sample volume is “walked through” the region of stenosis to measure PSV proximal to (PSVprox) and at the site of stenosis (PSVmax). These values are used to calculate the velocity ratio (Vr) of the stenosis (Vr = PSVmax/PSVprox), as illustrated in Figure 18.3. At the site of stenosis, end-diastolic velocity (EDV) should also be measured. The values of PSVmax, Vr, and EDV at the stenosis are used to classify stenosis severity. Power Doppler imaging, which is independent of Doppler angle, is useful to demonstrate lumen caliber when low flow velocity conditions are encountered, such as downstream from a high-grade stenosis.
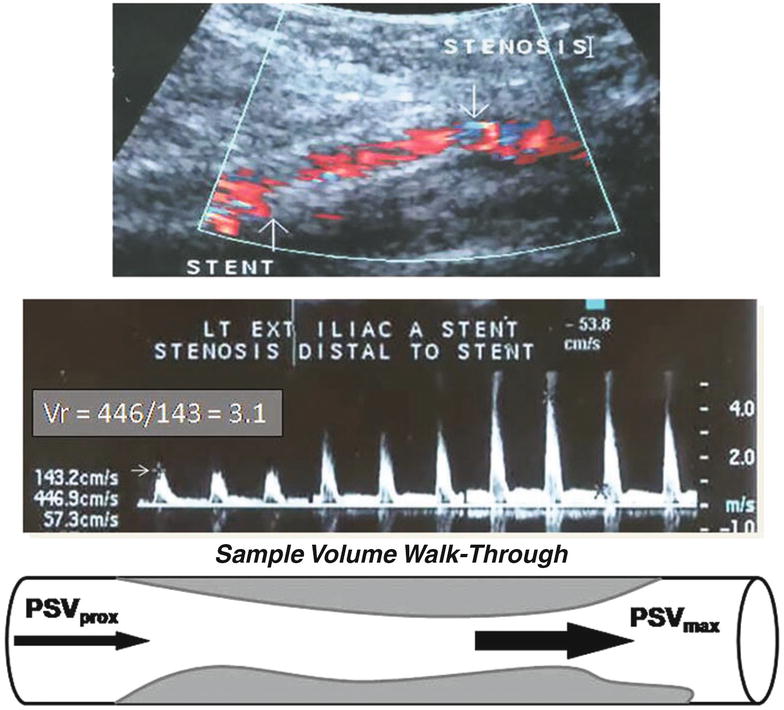
FIGURE 18.3. Color duplex images of a distal external iliac artery stent stenosis (top) and velocity spectral waveform (middle) show a “walk-through” of the pulsed Doppler sample volume along the stenosis for calculation of the velocity ratio (Vr) based on the recording sites shown in the schematic diagram (bottom). (Vr = PSVmax/PSVprox; PSV, peak systolic velocity.)
Knowledge of the type of endovascular intervention is important for the vascular technologist to perform accurate duplex surveillance. The artery segment treated (aorta, iliac, CFA, SFA, popliteal, tibial, bypass graft) and the type of intervention performed are important factors to consider in testing and study interpretation. Required scanning and interpretation skills include the ability to discern normal versus abnormal segmental pulsed Doppler spectral waveforms, recognition of stent and stent-graft B-mode ultrasound characteristics, and color flow Doppler patterns within stents and arterial stenoses. Recording duplex ultrasound findings on a schematic diagram of the lower limb arteries assists in producing a final study interpretation. Prior test results should be available to allow for the diagnosis of stenosis progression. In the majority of patients, duplex scanning can provide sufficient information to identify significant angioplasty or stent site stenosis and aid in a decision to proceed with reintervention.
TEST INTERPRETATION
The recommended duplex velocity spectral waveform criteria for grading angioplasty site and stent stenosis detailed in Figure 18.1 and Table 18.1 are based primarily on threshold PSV and Vr values.1,8,14–18 The stenosis categories range from normal or less than 50% stenosis to moderate (50% to 70%) stenosis, severe (>70% to 80%) stenosis, or occlusion. Duplex-predicted stenosis severity should be correlated with ABI and toe systolic pressures and with observed changes from prior testing. Test interpretation in limbs treated for CLI indicates whether adequate foot perfusion has been achieved (i.e., toe pressure >30 mm Hg). A normal study interpretation should state that no stenosis was identified at the angioplasty or stent site, and an appropriate increase in ABI has occurred relative to prior or preprocedural testing. A stenotic lesion immediately proximal or distal to the endovascular treatment site should be interpreted as a “new” treatment site abnormality rather than atherosclerotic disease progression.
TABLE 18.1 Duplex Velocity and Spectral Waveform Criteria for Grading Lower Extremity Angioplasty Site and Stent Stenosis
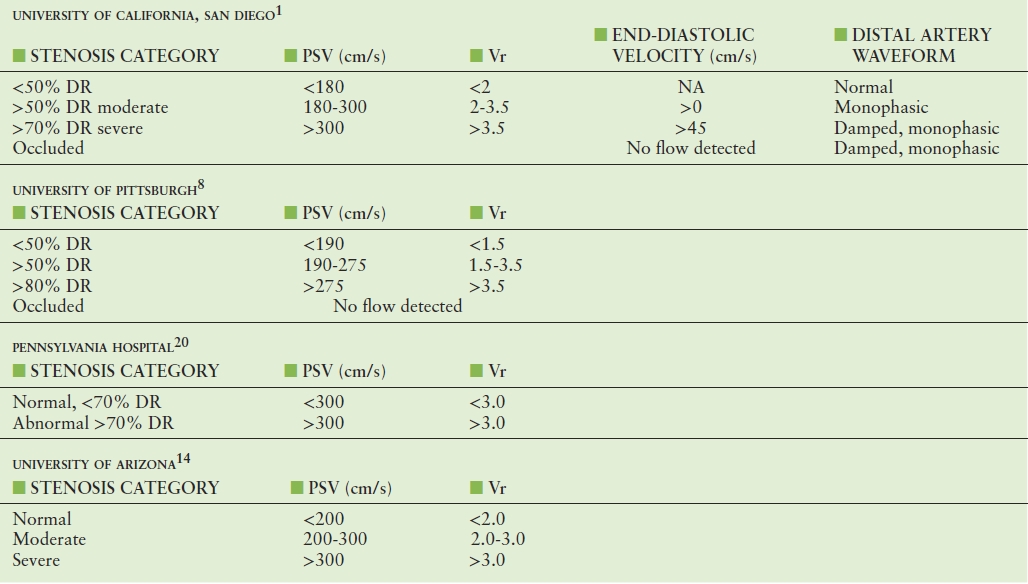
The velocity criteria recommended for classification of stenosis severity are based on measurements of PSV and Vr. A Vr > 2.0 at the stenotic site is generally regarded as indicating a greater than 50% DR when associated with color Doppler findings of lumen reduction, a focal velocity increase, and turbulent flow. The duplex criteria for grading stenosis shown in Table 18.1 from multiple vascular groups indicate substantial agreement on PSV and Vr thresholds for greater than 50% DR. The University of Pittsburgh group reported a positive predictive value of greater than 95% for greater than 50% or greater than 80% in-stent stenosis after femoropopliteal angioplasty for TASC B and C lesions.8,15 For patients who developed recurrent symptoms and a decrease in ABI of greater than 0.15, the angioplasty site stenosis had a mean PSV of 360 cm/s and Vr of 3.6, exceeding the threshold for severe stenosis in both sets of criteria. The University of Arizona group preferred to report stenosis severity as moderate (PSV 200-300 cm/s, Vr 2.0-3.0 > 2.0) or severe (PSV > 300 cm/s, Vr > 3.0).
In general, PSV values for grading in-stent stenoses are higher than for de novo atherosclerotic stenoses where a value greater than 200 cm/s is a widely accepted threshold for greater than 50% stenosis. Stent angioplasty also changes artery wall compliance and produces abnormal, nonuniform wall shear stress at stent end points, which potentiates the development of myointimal hyperplasia and may account for observed differences in duplex velocity criteria.19 At the University of California, San Diego Vascular Laboratory, the same duplex interpretation criteria are used for grading both lower limb arterial bypass graft stenosis and angioplasty site stenosis, including the intervention threshold criteria of PSV > 300 cm/s and Vr > 3.5.1 Use of the same criteria after open or endovascular intervention improves the reliability of study interpretation among vascular laboratory physicians, the diagnosis of disease progression, and clinical decision-making regarding the surveillance schedule and reintervention.
Endovascular treatment failure may develop in a variety of forms: a focal severe stenosis, diffuse or multiple stenoses, low flow velocity, or thrombotic occlusion. The finding of diffuse greater than 50% in-stent stenosis (Fig. 18.4) can be associated with moderately elevated PSV values (200 to 300 cm/s) along the SFA stent length and a decreased ABI producing recurrent limb ischemia. Figure 18.5 shows angiogram and duplex scan images of a patient with recurrent claudication (ABI = 0.85) after SFA balloon angioplasty. In this case, a focal greater than 70% stenosis was identified by duplex testing; after stent angioplasty of the lesion, the duplex scan images indicate “normal” treatment site patency (ABI = 1.1, PSV = 100 cm/s). An important diagnostic feature of angioplasty failure is the development of a damped, low-velocity spectral waveform at the distal (above ankle) tibial artery recording site.
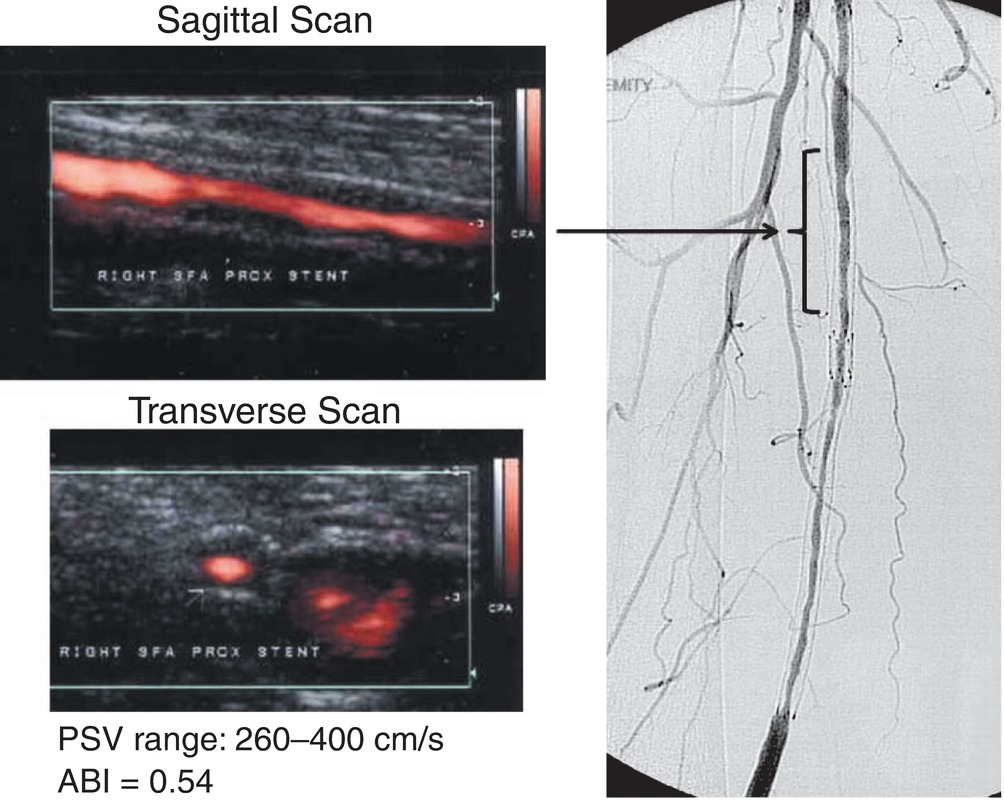
FIGURE 18.4. Power Doppler images (sagittal, transverse) and angiogram of a superficial femoral artery stent with diffuse in-stent stenosis. Peak systolic velocity (PSV) ranged from 260 to 400 cm/s within the stent. Measured ankle-brachial index was 0.54.
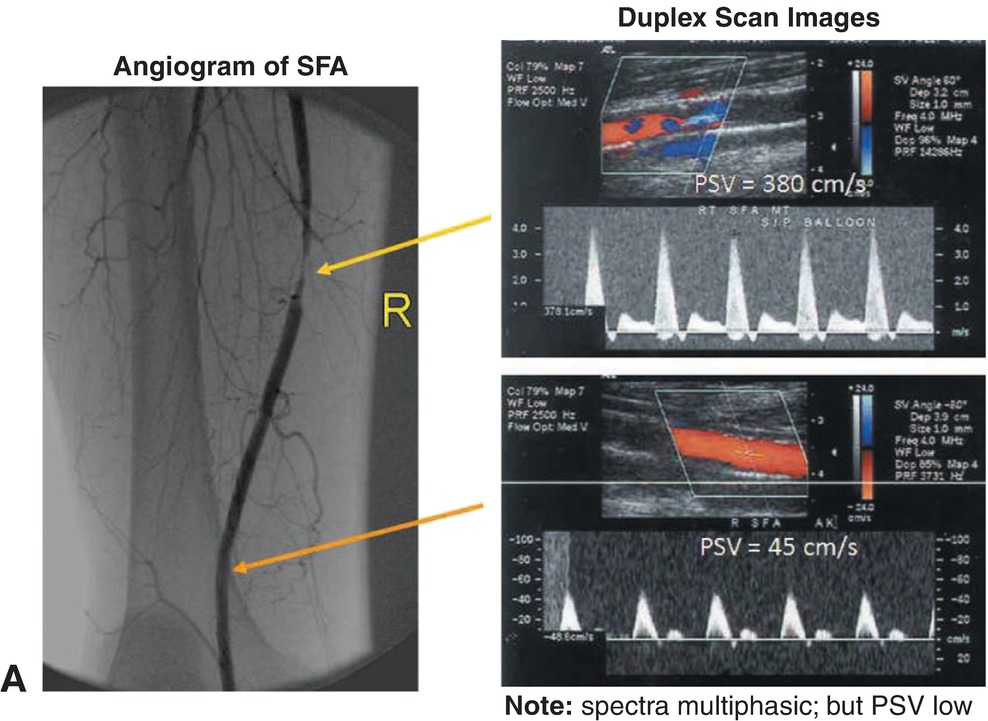
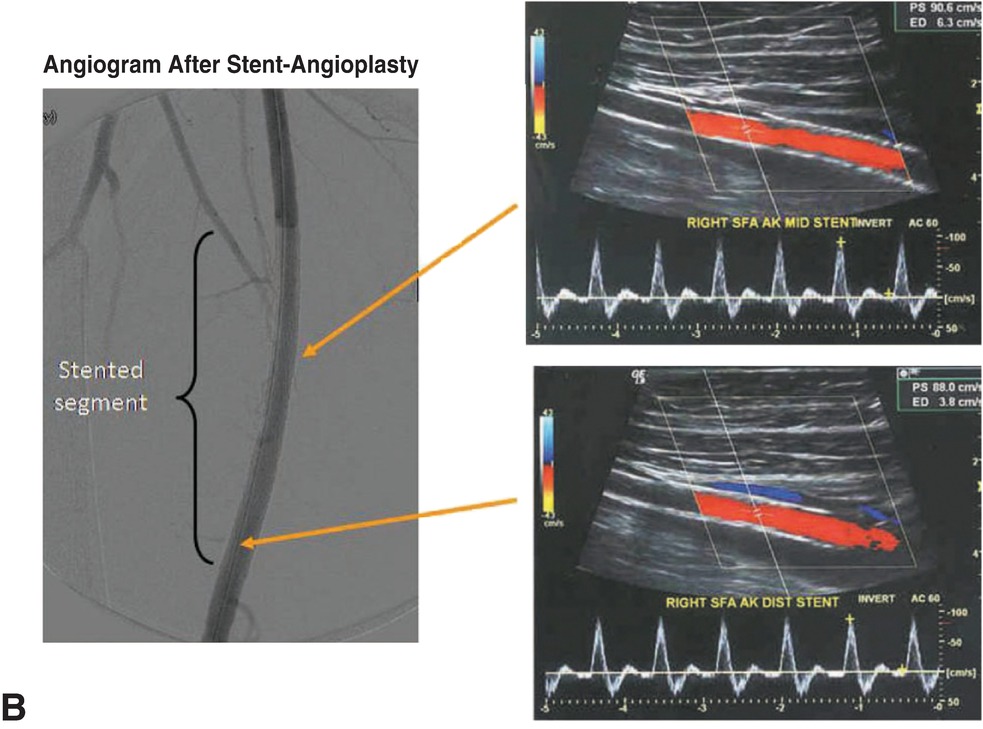
FIGURE 18.5. Angiogram and duplex scan images of a percutaneous transluminal angioplasty (PTA) site restenosis in a superficial femoral artery. A,>70% diameter reduction (DR) stenosis (PSV = 380, Vr = 5, end-diastolic velocity >0) and low popliteal artery PSV of 45 cm/s. B,After reintervention with stent angioplasty, duplex scan demonstrates no stenosis (PSV = 100 cm/s). Ankle-brachial index increased from 0.85 to 1.10. (PSV, peak systemic velocity. SFA, superficial femoral artery.)
The incidence of endovascular intervention failure is highest in the first 6 months after the procedure.5,6 The finding of a residual stenosis in the moderate category (50% to 70% DR) on the initial postprocedure study is a risk factor for failure.3,6,12,14 In this situation, study interpretation should include a recommendation for repeat testing in 6 to 8 weeks to detect stenosis progression (Fig. 18.6). The ultimate value of surveillance testing is to identify a “failing” endovascular treatment site before thrombosis occurs. In the medically fit patient, the development of a greater than 70% angioplasty or stent site stenosis should be considered as an indication for reintervention. However, in the majority of patients, the initial duplex surveillance study will be normal (<50% DR), and a protocol for follow-up testing in 6 months is appropriate. The patient should also be instructed to return sooner if symptoms of limb ischemia develop.
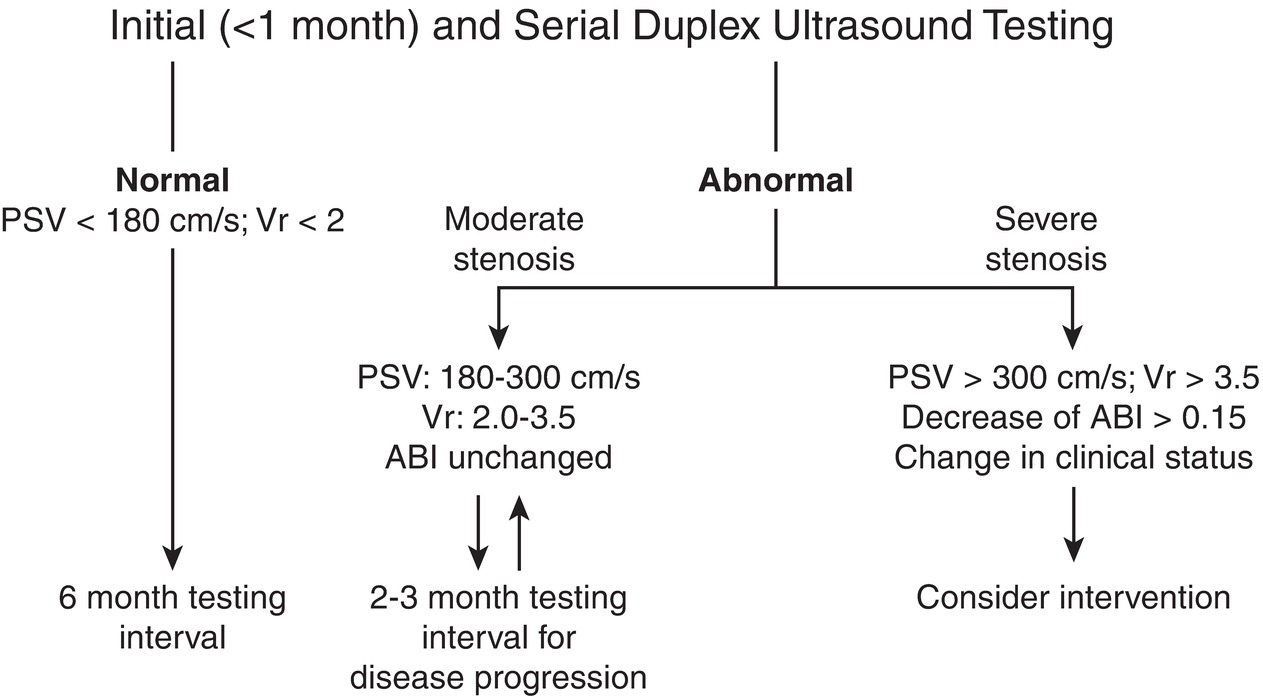
FIGURE 18.6. A general outpatient surveillance algorithm after infrainguinal endovascular arterial procedures.
Stay updated, free articles. Join our Telegram channel

Full access? Get Clinical Tree


