It is unclear if surgical exposure confers a risk advantage compared with a percutaneous approach for patients undergoing endovascular procedures requiring large-bore femoral artery access. From the randomized controlled Placement of Aortic Transcatheter Valve trials A and B and the continued access registries, a total of 1,416 patients received transfemoral transcatheter aortic valve replacement, of which 857 underwent surgical, and 559 underwent percutaneous access. Thirty-day rates of major vascular complications and quality of life scores were assessed. Propensity matching was used to adjust for unmeasured confounders. Overall, there were 116 major vascular complications (8.2%). Complication rates decreased dramatically during the study period. In unadjusted analysis, major vascular complications were significantly less common in the percutaneous access group (35 [6.3%] vs 81 [9.5%] p = 0.032). However, among 292 propensity-matched pairs, there was no difference in major vascular complications (22 [7.5%] vs 28 [9.6%], p = 0.37). Percutaneous access was associated with fewer total in-hospital vascular complications (46 [16%] vs 66 [23%], p = 0.036), shorter median procedural duration (97 interquartile range [IQR 68 to 166] vs 121 [IQR 78 to 194] minutes, p <0.0001), and median length of stay (4 [IQR 2 to 8] vs 6 [IQR 3 to 10] days, p <0.0001). There were no significant differences in quality of life scores at 30 days. Surgical access for large-bore femoral access does not appear to confer any advantages over percutaneous access and may be associated with more minor vascular complications.
Although sheath sizes for transfemoral transcatheter aortic valve replacement (TF-TAVR) access are decreasing, they continue to be many folds larger than standard coronary artery catheters. Two femoral artery access strategies are routinely used during TF-TAVR; one approach is to surgically expose the femoral or iliac artery, and the second is “fully percutaneous” access with deployment of suture closure devices before placement of the large-bore catheter. Broadly, there are few data to determine optimal access method for large-caliber catheter-based procedures. A single-center TAVR study suggested no difference in immediate major vascular injury but shorter lengths of stay for patients undergoing a percutaneous approach. However, no multicenter studies have compared in-hospital and intermediate-term outcomes or QoL to inform decisions regarding strategies for access during such procedures. Therefore, we sought to use detailed data from the Placement of Aortic Transcatheter Valve (PARTNER) trial to understand differences in outcomes and QoL after large-bore catheter access performed using open surgical versus percutaneous strategies.
Methods
The study population was derived from patients with severe symptomatic aortic stenosis who were enrolled in either cohort A, cohort B, or the continued access registries of the PARTNER I trial and subsequently underwent TAVR. For the purposes of this study, only patients who actually underwent a TF procedure as part of the PARTNER trials were included. All patients had an Edwards Lifesciences Sapien valve implanted through a 22Fr or 24Fr catheter from the femoral artery.
The primary end point for this analysis was 30-day major vascular complications defined according to a modified version of the Valve Academic Research Consortium criteria as described in the PARTNER trial protocol. They included: (1) any thoracic aortic dissection; (2) access site or access-related vascular injury (dissection, stenosis, perforation, rupture, arteriovenous fistula, pseudoaneurysm, hematoma, irreversible nerve injury, or compartment syndrome) leading to either death, need for significant blood transfusions (≥4 units), unplanned percutaneous (endovascular stent), or surgical intervention, or irreversible end-organ damage; (3) distal embolization (noncerebral) from a vascular source requiring surgery or resulting in amputation or irreversible end-organ damage; or (4) left ventricular perforation. All events were adjudicated by an independent clinical events committee per PARTNER trial protocols.
Disease-specific health status, including symptoms, functional status, and QoL, was assessed by the Kansas City Cardiomyopathy Questionnaire (KCCQ) and the Short Form-12 (SF-12) Health Survey (surveys included in the supplement). The KCCQ is a 23-item self-administered questionnaire that addresses specific health domains pertaining to heart failure. Values range from 0 to 100, with higher scores indicating lower symptom burden and better QoL. A KCCQ summary score >75 corresponds roughly to New York Heart Association functional class I and scores of 60 to 75, 45 to 60, and <45 correspond to New York Heart Association functional classes II, III, and IV, respectively. The KCCQ has undergone previous reliability and validity testing in patients with severe aortic stenosis.
The SF-12 is a 12- item self-administered questionnaire cross validated for the assessment of physical and mental health; higher scores indicate better health. The SF-12 is scaled such that the US population mean equals 50 with a SD of 10, and differences of ∼2 points are considered clinically meaningful.
We first analyzed raw statistics with simple comparisons and trends over time based on open surgical versus percutaneous femoral access. However, baseline patient characteristics differed between surgical and percutaneous access groups. To address possible confounding due to these differences, we adopted propensity score–based matching using multivariate logistic regression and variables listed in Supplementary Material . Variables were retained based on a p value of 0.05, using bagging (bootstrap aggregation) with automated forward stepwise analysis of 500 resampled data sets. Variables appearing in at least 50% of analyses were considered reliably statistically significant. We then forced the addition of specific that might be related to unrecorded selection factors including: date of each TF-TAVR procedure, institution trial entry date, and institution-specific patient sequence number. To account for missing values for some variables in multivariate modeling, we performed fivefold multiple imputation using a Markov chain Monte Carlo technique. In all, 114 variables were incorporated into a semisaturated propensity model (see Supplementary Material ), with a C-statistic of 0.88.
We then calculated the probability of each patient being in the surgical access group—the propensity score—with this model. Surgical access cases were matched one-to-one to percutaneous access cases using a greedy matching strategy. Surgical access cases whose propensity scores deviated more than 0.10 from those of percutaneous access cases were considered unmatched. Surgical access patients were matched across the entire spectrum of propensity scores ( Supplementary Tables 1 and 2 , Supplementary Figure 1 ). Using the propensity-matched cohort, we analyzed comparisons of our primary and secondary end points based on femoral access method. Continuous data are presented as mean ± SD, or equivalent 15th, 50th (median), and 85th percentiles when the distribution is skewed; comparisons were made using the Wilcoxon rank-sum nonparametric tests. Categorical data are summarized using frequencies and percentages; comparisons were made using the chi-square test or Fisher’s exact test when the frequency was <5. Uncertainty is expressed by 68% confidence limits equivalent to ±1 SE.
QoL measures were compared only in propensity-matched patients; 270 of the 292 matched pairs had QoL measures available. Within-group comparisons were performed using paired t tests, and between-group comparisons were performed by anlaysis of covariance, adjusting for baseline values.
Data for this as-treated analysis were from a July 2013 locked data extract provided to the PARTNER Publications Office by Edwards Lifesciences. Data analysis was performed by investigators at Cleveland Clinic, with no sponsor involvement in the study proposal and design for this substudy, analysis, interpretation, or the decision to publish. The PARTNER trial and continued access registries were approved by the institutional review board at each participating site, and all patients provided written informed consent.
All analyses were performed using SAS statistical software (SAS version 9.2; SAS, Inc., Cary, North Carolina) and R software version 2.15.3.
Results
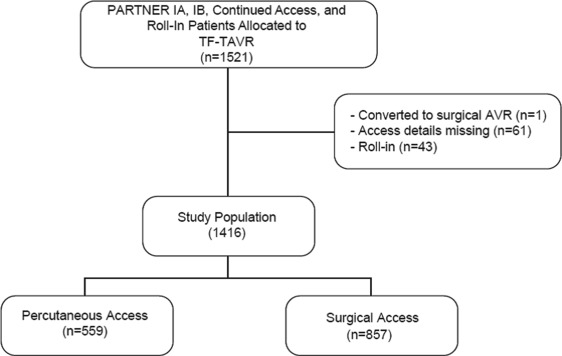
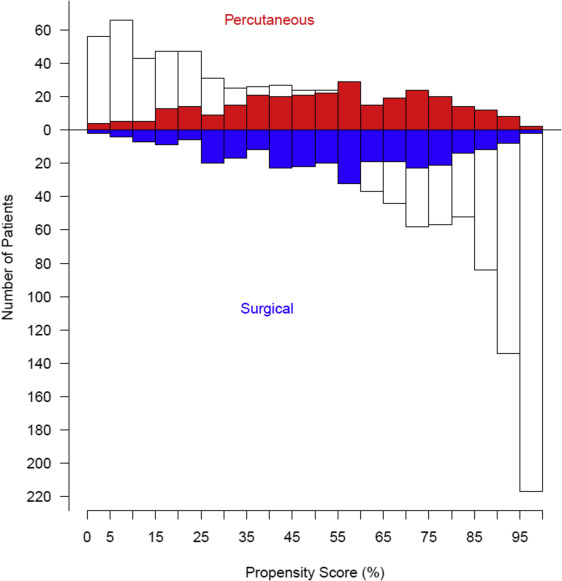
A total of 1,416 patients who underwent TF-TAVR from April 2007 to February 2012 were included in this analysis ( Figure 1 ). Propensity matching yielded a total of 292 well-matched patient pairs, 52% of potential matches ( Figure 2 ). The percutaneous and open surgical patients demonstrate multiple baseline differences ( Table 1 ). Notably, a larger percentage of patients who received percutaneous access had significant peripheral arterial disease, documented frailty, and had larger valves implanted, requiring the larger size sheath. Conversely, fewer patients who underwent percutaneous access had “normal” iliac arteries, defined as >8 mm without calcification or tortuosity.
| Characteristic | Percutaneous (n=559) | Surgical (n=857) | P | ||
|---|---|---|---|---|---|
| n ∗ | No. (%) or Mean ± SD | n ∗ | No. (%) or Mean ± SD | ||
| Age (years) | 559 | 85 ± 7.8 | 857 | 84 ± 7.6 | 0.10 |
| Men | 559 | 327 (58%) | 857 | 461 (54%) | 0.08 |
| Body mass index (kg/m 2 ) | 557 | 27 ± 5.5 | 855 | 28 ± 7.2 | 0.74 |
| STS score | 557 | 11 ± 4.05 | 857 | 11 ± 4.03 | 0.24 |
| Logistic EuroScore | 545 | 24 ± 14 | 825 | 26 ± 17 | 0.08 |
| Aortic Valve area (cm 2 ) | 537 | 0.65 ± 0.18 | 817 | 0.66 ± 0.20 | 0.38 |
| Aortic Valve mean gradient (mmHg) | 545 | 44 ± 14 | 830 | 45 ± 15 | 0.51 |
| Implanted Sapien Valve Size (mm) | 543 | 846 | 0.01 | ||
| 23 | 260 (48%) | 469 (55%) | |||
| 26 | 283 (52%) | 377 (45%) | |||
| New York Heart Association class | 559 | 857 | 0.06 | ||
| I | 0 (0%) | 1 (0.12%) | |||
| II | 29 (5.2%) | 36 (4.2%) | |||
| III | 284 (51%) | 384 (45%) | |||
| IV | 246 (44%) | 436 (51%) | |||
| Hypertension | 559 | 497 (89%) | 854 | 767 (90%) | 0.59 |
| Diabetes Mellitus | 559 | 215 (38%) | 855 | 326 (38%) | 0.90 |
| Chronic Obstructive Pulmonary Disease | 559 | 224 (40%) | 857 | 401 (47%) | 0.01 |
| Oxygen-dependent | 559 | 64 (11%) | 857 | 118 (14%) | 0.20 |
| Smoker | 559 | 260 (47%) | 855 | 355 (42%) | 0.06 |
| Renal disease | 559 | 91 (16%) | 857 | 168 (20%) | 0.11 |
| Systolic Cardiomyopathy | 557 | 107 (19%) | 853 | 133 (16%) | 0.08 |
| Atrial fibrillation | 559 | 117 (21%) | 856 | 178 (21%) | 0.95 |
| Coronary artery disease | 559 | 441 (79%) | 855 | 601 (70%) | <0.01 |
| Myocardial infarction | 551 | 127 (23%) | 852 | 205 (24%) | 0.66 |
| Percutaneous coronary intervention | 558 | 216 (39%) | 853 | 283 (33%) | 0.03 |
| Coronary artery bypass grafting | 559 | 220 (39%) | 855 | 301 (35%) | 0.11 |
| Balloon aortic valvuloplasty | 551 | 124 (23%) | 855 | 161 (19%) | 0.09 |
| Cerebrovascular disease including carotid disease | 559 | 166 (30%) | 855 | 285 (33%) | 0.15 |
| Peripheral arterial disease | 559 | 315 (56%) | 857 | 399 (47%) | <0.01 |
| Normal iliac artery | 557 | 328 (59%) | 857 | 701 (82%) | <0.01 |
| Iliofemoral disease | 559 | 310 (55%) | 857 | 394 (46%) | <0.01 |
| Calcified Ascending Aorta | 559 | 30 (5.4%) | 855 | 51 (6.0%) | 0.64 |
| Frailty | 543 | 95 (17%) | 760 | 86 (11%) | <0.01 |
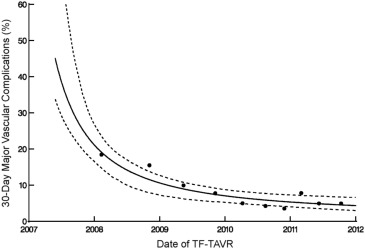
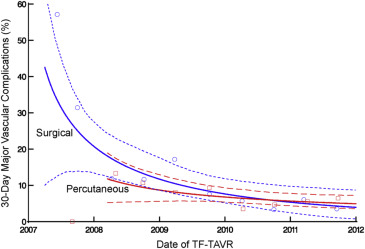
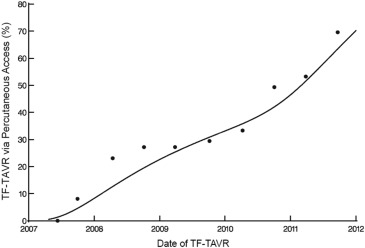
There were 116 major vascular complications at 30 days for an overall event rate of 8%. The incidence of major vascular complications decreased sharply over the course of the 5-year study period from >40% to <10% ( Figure 3 ), and event reductions were noted for both percutaneous and surgical access methods ( Figure 4 ). Of note, percutaneous access was relatively infrequent for the first 3 years of the PARTNER trial, but rapidly adopted over the subsequent study period ( Figure 5 ).
In unadjusted analysis, 30-day major vascular complications were significantly less common in the percutaneous access group (35 [6.3%] vs 81 [9.5%], p = 0.03). However, after propensity score matching, including date of procedure and center experience, there was no significant difference in 30-day major vascular complication rates between percutaneous and surgical access ( Table 2 , Figure 6 ). However, percutaneous access was associated with a reduced total vascular complication rate, shorter median procedural duration, and shorter median length of stay ( Table 2 , Figure 6 ).
| Outcome | Percutaneous (n=292) | Surgical (n=292) | P | ||
|---|---|---|---|---|---|
| n ∗ | No. (%) or 15th/50th/85th percentiles | n ∗ | No. (%) or 15th/50th/85th percentiles | ||
| 30-day major vascular complications | 292 | 22 (7.5%) | 292 | 28 (9.6%) | 0.37 |
| 30-day minor vascular complications | 292 | 19 (6.5%) | 292 | 30 (10%) | 0.10 |
| In-hospital morbidity | |||||
| Total vascular complications | 292 | 46 (16%) | 292 | 66 (23%) | 0.04 |
| Major vascular complications | 292 | 21 (7.2%) | 292 | 27 (9.2%) | 0.37 |
| Minor vascular complications | 292 | 17 (5.8%) | 292 | 27 (9.2%) | 0.12 |
| Access site hematoma | 292 | 9 (3.1%) | 292 | 12 (4.1%) | 0.50 |
| Vascular dissection | 292 | 25 (8.6%) | 292 | 33 (11%) | 0.27 |
| Vascular perforation | 292 | 10 (3.4%) | 292 | 18 (6.2%) | 0.12 |
| Bleeding requiring transfusion | 292 | 9 (3.1%) | 292 | 10 (3.4%) | 0.82 |
| Procedure time (minutes) | 292 | 68/97/166 | 291 | 78/121/194 | <0.01 |
| Fluoroscopy time (minutes) | 280 | 17/25/37 | 280 | 15/22/32 | <0.01 |
| Contrast volume (mL) | 289 | 60/120/245 | 283 | 65/125/211 | 0.92 |
| Post-procedure length of stay (days) | 284 | 2/4/8 | 292 | 3/6/10 | <0.01 |
Stay updated, free articles. Join our Telegram channel

Full access? Get Clinical Tree


