The prevalence and clinical correlates of left ventricular (LV) wall motion abnormalities (WMAs), associated with morbidity and mortality, have not been well-characterized in the population. Framingham Heart Study Offspring Cohort participants (n = 1,794, 844 men, age 65 ± 9 years) underwent cine cardiovascular magnetic resonance for evaluation of LV function. A subset (n = 1,009, 460 men) underwent cardiac multidetector computed tomography for analysis of coronary artery calcium. The presence of coronary heart disease and heart failure (CHD-HF) were assessed in relation to the presence of WMAs. WMAs were present in 117 participants (6.5%) and were associated with male gender, elevated hemoglobin A1c, LV mass, LV end-diastolic volume, and lower LV ejection fraction. Of the 1,637 participants without CHD-HF, 68 (4.2%) had WMAs. In this group, WMAs were associated with obesity, hypertension, and Framingham coronary heart disease risk score in the age- and gender-adjusted analyses and were associated with male gender and hypertension on multivariate analysis. Most subjects with WMAs were in the greatest coronary artery calcium groups. The presence of coronary artery calcium greater than the seventy-fifth percentile and Agatston score >100 were associated with a greater than twofold risk of WMAs in the age- and gender-adjusted analysis but were no longer significant when additionally adjusted for CHD-HF. Previous Q-wave myocardial infarction was present in 29% of the 117 participants with WMAs. In conclusion, in the present longitudinally followed free-living population, 4.2% of the participants without CHD-HF had WMAs. WMAs were associated with the clinical parameters associated with cardiovascular disease risk. Aggressive risk factor modification may be prudent for subjects with WMAs, particularly those free of clinical CHD-HF.
Echocardiographic data have suggested increased morbidity and mortality associated with left ventricular (LV) dysfunction in subjects without known cardiovascular disease. However, analysis of the wall motion abnormalities (WMAs) on the surface echocardiogram might be limited by suboptimal image quality in those with cardiovascular disease risk factors. Thus, the prevalence and clinical correlates of LV WMAs in the general population have not been well-established. Cardiovascular magnetic resonance (CMR) is well-suited for the analysis of LV WMAs, because it can provide excellent endocardial border definition without acoustic window constraints. We hypothesized that CMR would detect LV WMAs in those with and without a history of coronary heart disease (CHD) and heart failure (HF) and that these WMAs would be associated with CHD risk factors, subclinical disease of the ventricle and coronary arteries, and clinically apparent CHD or HF. We thus applied CMR methods to determine the prevalence and clinical correlates of LV WMAs in a community, free-living population.
Methods
A subset (n = 1,794) of 3,539 Framingham Heart Study Offspring Cohort participants who attended the seventh examination cycle (1998 to 2001), were in sinus rhythm, had no contraindication to CMR, and who lived in a state contiguous with Massachusetts were recruited. At each examination every 3 to 4 years, the participants underwent routine medical history, physical examination, anthropometry, and assessment of cardiovascular risk factors. CMR scanning (2002 to 2006) was unable to be completed because of claustrophobia in 13, scanner dysfunction in 7, metallic devices in 10, or miscellaneous reasons in 2. A subset of this cohort (n = 1,009) also underwent cardiac multidetector coronary computed tomography for analysis of coronary arterial calcification. The institutional review boards of Boston University Medical Center and Beth Israel Deaconess Medical Center approved the study, and all participants provided written informed consent.
Supine CMR imaging was performed using a 1.5 T CMR scanner (Gyroscan NT, Philips Medical Systems, Best, The Netherlands) with a 5-element commercial cardiac array coil for radiofrequency signal reception. After localizing scans to determine the position and orientation of the heart within the thorax, end-expiratory breath-hold, electrocardiographic-gated, cine, steady state, free precession images were acquired in 2-chamber, 4-chamber, and contiguous short-axis orientations (temporal resolution 39 ms, repetition time equaled the RR interval, echo time 9 ms, flip angle 60°, field of view 400 mm, matrix size 208 × 256, slice thickness 10 mm, and gap 0).
Quantitative CMR data analysis was performed using dedicated software (EasyVision, version 5.1, Philips Medical Systems) by an observer who was blinded to all clinical data. LV wall motion was analyzed according to a 17-segment model. The global and regional wall motion score were computed using a 5-point scale (1, normal; 2, hypokinetic; 3, akinetic; 4, dyskinetic; 5, aneurysm), with a normal LV segment summation of 17. The wall motion score index was calculated as the total wall motion score divided by the number of segments, with a wall motion score index of ≥19 of 17 (≥1.12) considered abnormal (i.e., ≥2 contiguous segments hypokinetic, and/or 1 segment akinetic or dyskinetic). Any WMAs noted by the reviewer were confirmed by 2 additional reviewers. Quantitative measures of the LV ejection fraction and LV mass were obtained by manually tracing the epicardial and endocardial LV borders, as previously described. The LV end-diastolic and end-systolic volumes were computed using the summation of disks method. The LV ejection fraction was computed as follows: (end-diastolic volume − end-systolic volume)/end-diastolic volume. The LV mass was determined by summing the myocardial wall volume and multiplying by the myocardial density (1.05 g/ml). The LV mass was indexed to the body surface area. The LV mass index, relative wall thickness (2 × diastolic inferolateral wall thickness/LV end-diastolic dimension), LV mass/LV end-diastolic volume ratio, and LV ejection fraction were tabulated.
Multidetector coronary computed tomography was conducted in the Framingham Heart Study Offspring Cohort contemporaneous to CMR, as previously described. An 8-slice multidetector coronary computed tomographic scanner (LightSpeed Ultra, General Electric, Milwaukee, Wisconsin) was used for image acquisition using prospective electrocardiographic triggering (initiated at 50% of the RR interval) during a single breath hold. Contiguous 2.5-mm-thick slices were acquired. A field of view of 35 mm was used for image reconstruction. The presence and amount of coronary arterial calcification was analyzed by an experienced reader using a dedicated workstation (Aquarius, TeraRecon, San Mateo, California). A calcified lesion was defined as an area of ≥3 connected pixels with an attenuation >130 Hounsfield units. A modified Agatston score was calculated by multiplying the area of each lesion with a weighted attenuation score dependent on the maximal attenuation in the lesion, and gender-specific greater than the seventy-fifth percentile values were used, as previously established.
The participants underwent routine physical examination, anthropometry, and laboratory assessment of cardiovascular disease risk factors at examination 7, as previously described. Hypertension was defined as systolic pressure ≥140 mm Hg or diastolic pressure ≥90 mm Hg or the use of antihypertensive medications. The plasma glucose, total and high-density lipoprotein cholesterol, and hemoglobin A1c levels were measured from morning blood samples after an 8-hour fast. Diabetes mellitus was defined as a fasting glucose level of ≥126 mg/dl or the use of oral hypoglycemic medication or insulin. To account for a history of elevated cholesterol and/or statin therapy, we used the total cholesterol level and total/high-density lipoprotein cholesterol ratio averaged for examinations 1 to 7. Dyslipidemia was defined as total cholesterol of ≥200 mg/dl or the use of lipid-lowering therapy. The Framingham risk score was computed using gender-specific equations that incorporated age, gender, history of smoking, presence of diabetes, systolic and diastolic blood pressures, fasting serum total cholesterol level, and high-density lipoprotein cholesterol level.
Pathologic Q waves in a coronary artery distribution were adjudicated by a physician committee who reviewed the 12-lead electrocardiograms performed at each examination. Previous cardiovascular disease events were confirmed by review of all available data, including hospital records, by a 3-physician end point committee, as previously described. A history of CHD and HF (CHD-HF) was defined by the occurrence of any one of the following events: recognized or unrecognized myocardial infarction, angina, coronary insufficiency, or congestive HF.
The participants were categorized by the presence or the absence of each CHD-HF and WMAs. Descriptive statistics for all covariates have been presented as either percentages or the mean ± SD. The group differences were evaluated using 2-sample t tests and analysis of covariance for continuous measures and the chi-square test and logistic regression analysis for categorical variables. Age- and gender-adjusted and multivariate adjusted logistic regression models (incorporating age, gender, obesity, history of hypertension, diabetes, dyslipidemia, smoking history, and Framingham risk score) were constructed to assess the association of the covariates to the presence or absence of a WMA. Furthermore, to assess the gender-dependent cardiac anatomic differences, gender-specific multivariate analysis of covariance models were constructed to evaluate the differences in CMR measures with WMAs and also for groups with and without CHD-HF. All analyses were performed using Statistical Analysis Systems, version 8.0 (SAS Institute, Cary, North Carolina). A p value <0.05 was considered statistically significant.
We had full access to, and take full responsibility for, the integrity of the data, and all of us have read and agreed to the report as written.
Results
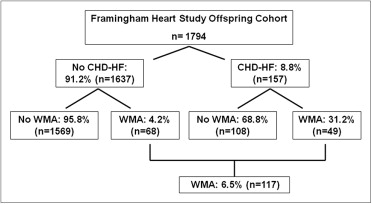
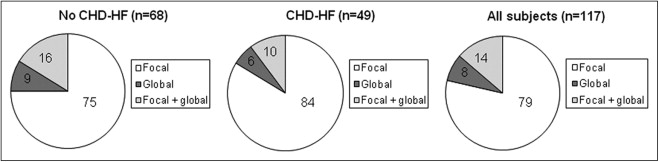
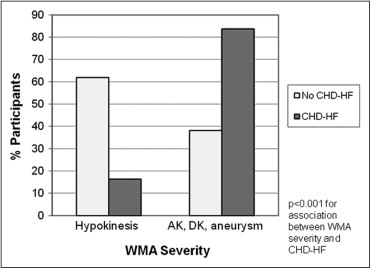
Of the 1,794 participants (844 men, age 65 ± 9 years) who completed CMR scanning with analyzable data, WMAs were present in 117 (6.5%), including 68 (58% of the 117) free of CHD-HF ( Figure 1 ). The WMAs were predominantly focal in those with and without CHD-HF. The participants with CHD-HF had a greater prevalence of WMAs in all regions (p <0.001 vs without CHD-HF). The characteristics of WMAs are presented in Figure 2 . The regional distribution of WMAs was similar between those with and without CHD-HF, with the exception of a greater prevalence of lateral WMAs in the participants with CHD-HF (82% vs 59% in those without CHD-HF, p = 0.009). The participants without CHD-HF had a greater prevalence of hypokinesis, and those with CHD-HF had a greater prevalence of akinesis, dyskinesis, or aneurysm (p <0.001; Figure 3 ).
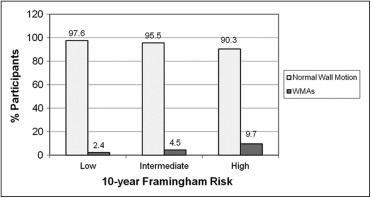
The clinical characteristics of the participants without CHD-HF are listed in Table 1 . Of these participants, those with WMAs were older and more likely to be men, to be obese (body mass index >30 kg/m 2 ), to have a history of hypertension and diabetes, and to have a greater hemoglobin A1c, total cholesterol/high-density lipoprotein ratio, and Framingham risk score (all p <0.02). The proportion of participants with WMAs significantly increased across increasing tertiles of 10-year Framingham risk score groups (p <0.001, Figure 4 ). In the age- and gender-adjusted models, WMAs were associated with obesity, hypertension, and a greater Framingham risk score ( Table 2 ). After adjusting for age, gender, obesity, hypertension, diabetes, dyslipidemia, and a history of smoking, hypertension and male gender were associated with a twofold and nearly fourfold increased risk of a WMA, respectively (p = 0.011 and p <0.001, respectively; Table 2 ). In further analysis (data not shown) adjusted for age, gender, and antihypertensive treatment, a history of hypertension at examination 1 (1971 to 1975) was not associated with the presence of WMAs (odds ratio [OR] 0.92, 95% confidence interval [CI] 0.40 to 2.13, p = 0.844). However, any history of hypertension was associated with a twofold risk of WMAs (OR 2.26, 95% CI 1.08 to 4.71, p = 0.030).
| Characteristic | WMA | p Value | |
|---|---|---|---|
| No (n = 1,569) | Yes (n = 68) | ||
| Age (years) | 64 ± 9 | 67 ± 10 | 0.006 |
| Men | 44% | 77% | <0.001 |
| Obesity ⁎ | 31% | 50% | 0.001 |
| Body mass index (kg/m 2 ) | 27.7 ± 4.9 | 29.8 ± 5.9 | 0.006 |
| Waist/hip ratio | 0.9 ± 0.1 | 1.0 ± 0.1 | <0.001 |
| Hypertension | 49% | 77% | <0.001 |
| Systolic blood pressure (mm Hg) | 124 ± 18 | 130 ± 17 | 0.011 |
| Diastolic blood pressure (mm Hg) | 74 ± 9 | 77 ± 11 | 0.052 |
| Diabetes mellitus | 8% | 16% | 0.013 |
| Hemoglobin A1c (%) | 5.5 ± 0.8 | 5.8 ± 1.0 | 0.013 |
| Dyslipidemia † | 79% | 82% | 0.509 |
| Average total cholesterol/high-density lipoprotein ‡ | 4.2 ± 1.2 | 4.5 ± 1.3 | 0.018 |
| Other cardiovascular disease § | 3% | 4% | 0.600 |
| Any history of tobacco use | 60% | 68% | 0.195 |
| Framingham risk score | 7.4 ± 4.0 | 9.1 ± 4.3 | 0.001 |
| Left ventricular mass (g) | 103 ± 28 | 140 ± 37 | <0.001 |
| Left ventricular mass index (g/m 2 ) | 54 ± 11 | 68 ± 14 | <0.001 |
| Left ventricular mass/height 2.7 (g/m 2.7 ) | 25 ± 5 | 32 ± 7 | <0.001 |
| Left ventricular end-diastolic volume (ml) | 123 ± 29 | 161 ± 38 | <0.001 |
| Relative wall thickness | 0.27 ± 0.05 | 0.27 ± 0.05 | 0.666 |
| Left ventricular mass/left ventricular end-diastolic volume (g/ml) | 0.84 ± 0.16 | 0.88 ± 0.18 | 0.055 |
| Left ventricular ejection fraction (%) | 68.0 ± 5.7 | 54.7 ± 8.8 | <0.001 |
⁎ Body mass index >30 kg/m 2 .
† Total cholesterol ≥200 mg/dl or receiving lipid-lowering therapy.
‡ Average total cholesterol/high-density lipoprotein averaged for examinations 1 to 7.
§ Claudication, cerebrovascular accident, or transient ischemic attack.
| Model | OR | 95% CI | p Value |
|---|---|---|---|
| Age- and gender-adjusted model | |||
| Obesity | 1.98 | 1.21–3.25 | 0.007 |
| Hypertension | 2.59 | 1.42–4.73 | 0.002 |
| Diabetes mellitus | 1.82 | 0.91–3.61 | 0.089 |
| Dyslipidemia | 1.10 | 0.57–2.12 | 0.772 |
| Smoker, ever | 1.21 | 0.72–2.05 | 0.475 |
| Framingham risk score | 1.10 | 1.01–1.20 | 0.027 |
| Multivariate model | |||
| Age | 1.02 | 0.99–1.06 | 0.122 |
| Male gender | 3.69 | 2.07–6.58 | <0.001 |
| Obesity | 1.64 | 0.98–2.74 | 0.058 |
| Hypertension | 2.23 | 1.20–4.14 | 0.011 |
| Diabetes mellitus | 1.36 | 0.68–2.74 | 0.387 |
| Dyslipidemia | 0.96 | 0.50–1.87 | 0.913 |
| Smoker, ever | 1.14 | 0.67–1.94 | 0.628 |
The CMR correlates of WMAs among participants without CHD-HF included increased LV mass (raw and indexed for body surface area, height, and height 2.7 ), increased LV end-diastolic volume, and lower LV ejection fraction, in age-adjusted gender-specific analyses (all p <0.001; Table 3 ). The LV mass/LV end-diastolic volume ratio and relative wall thickness did not correlate with the presence of WMAs in those without CHD-HF.
| Characteristic | Men | Women | ||||
|---|---|---|---|---|---|---|
| No WMAs (n = 682) | WMA (n = 52) | p Value | No WMA (n = 887) | WMA (n = 16) | p Value | |
| Left ventricular mass (g) | 126 ± 24 | 150 ± 33 | <0.001 | 85 ± 16 | 108 ± 29 | <0.001 |
| Left ventricular mass index (g/m 2 ) | 61 ± 10 | 70 ± 12 | <0.001 | 48 ± 7 | 60 ± 15 | <0.001 |
| Left ventricular mass/height 2.7 (g/m) | 28 ± 5 | 33 ± 7 | <0.001 | 23 ± 4 | 30 ± 7 | <0.001 |
| Left ventricular end-diastolic volume (ml) | 143 ± 27 | 166 ± 38 | <0.001 | 107 ± 19 | 142 ± 33 | <0.001 |
| Relative wall thickness | 0.29 ± 0.05 | 0.28 ± 0.05 | 0.296 | 0.26 ± 0.05 | 0.25 ± 0.05 | 0.603 |
| Left ventricular mass/left ventricular end-diastolic volume (g/ml) | 0.90 ± 0.17 | 0.92 ± 0.18 | 0.618 | 0.80 ± 0.13 | 0.76 ± 0.13 | 0.070 |
| Left ventricular ejection fraction (%) | 67 ± 6 | 55 ± 9 | <0.001 | 69 ± 6 | 55 ± 7 | <0.001 |
The clinical characteristics of the CHD-HF group are listed in Table 4 . The participants with CHD-HF had a greater wall motion score index than those without CHD-HF (1.67 ± 0.44 vs 1.47 ± 0.39, p <0.001). WMAs were associated with male gender and elevated hemoglobin A1c on univariate analysis. On multivariate-adjusted analysis, male gender and history of diabetes each conferred a threefold increased risk of WMAs (OR 3.07, 95% CI 1.16 to 8.13, p = 0.024, and OR 2.87, 95% CI 1.03 to 7.96, p = 0.043, respectively). However, obesity, hypertension, and Framingham risk score were not associated with the presence of WMAs. WMAs were also associated with elevated LV mass, LV mass index, LV mass/height 2.7 , and LV end-diastolic volume and with decreased relative wall thickness, LV mass/LV end-diastolic volume, and LV ejection fraction ( Table 4 ). In age-adjusted linear regression analyses, these relations persisted in men ( Table 5 ). However, in women, WMAs were only associated with elevated LV end-diastolic volume and decreased LV ejection fraction. Among all participants, no significant differences were found between the groups with and without WMAs with respect to dyslipidemia, tobacco use, or a history of other cardiovascular disease, including cerebrovascular accident, transient ischemic attack, or claudication.
| Characteristic | WMAs | p Value | |
|---|---|---|---|
| No (n = 108) | Yes (n = 49) | ||
| Age (years) | 70 ± 8 | 69 ± 8 | 0.643 |
| Men | 63% | 86% | 0.004 |
| History of coronary heart disease | 94% | 90% | 0.520 |
| History of heart failure | 11% | 18% | 0.225 |
| History of Q-wave myocardial infarction | 17% | 69% | <0.001 |
| Obesity ⁎ | 53% | 45% | 0.360 |
| Body mass index (kg/m 2 ) | 29.3 ± 4.5 | 29.1 ± 5.0 | 0.774 |
| Waist/hip ratio | 1.0 ± 0.1 | 1.0 ± 0.0 | 0.227 |
| Hypertension | 79% | 84% | 0.469 |
| Systolic blood pressure (mm Hg) | 131 ± 19 | 126 ± 19 | 0.111 |
| Diastolic blood pressure (mm Hg) | 72 ± 9 | 73 ± 11 | 0.565 |
| Diabetes mellitus | 23% | 35% | 0.130 |
| Hemoglobin A1c (%) | 5.9 ± 1.0 | 6.7 ± 1.9 | 0.028 |
| Dyslipidemia † | 89% | 96% | 0.152 |
| Average total cholesterol/high-density lipoprotein ‡ | 5.0 ± 1.5 | 5.2 ± 1.1 | 0.245 |
| Other cardiovascular disease § | 17% | 16% | 0.958 |
| Any history of tobacco use | 65% | 78% | 0.111 |
| Framingham risk score | 11.0 ± 3.1 | 11.2 ± 3.0 | 0.720 |
| Left ventricular mass (g) | 118 ± 32 | 138 ± 28 | <0.001 |
| Left ventricular mass index (g/m 2 ) | 60 ± 14 | 70 ± 15 | <0.001 |
| Left ventricular mass/height 2.7 (g/m 2.7 ) | 29 ± 7 | 33 ± 7 | 0.002 |
| Left ventricular end-diastolic volume (ml) | 132 ± 32 | 169 ± 34 | <0.001 |
| Relative wall thickness | 0.29 ± 0.06 | 0.25 ± 0.05 | <0.001 |
| Left ventricular mass/left ventricular end-diastolic volume (g/ml) | 0.90 ± 0.15 | 0.83 ± 0.18 | 0.016 |
| Left ventricular ejection fraction (%) | 68.9 ± 5.7 | 52.0 ± 9.5 | <0.001 |
Stay updated, free articles. Join our Telegram channel

Full access? Get Clinical Tree


