The development of significant intraventricular gradients (IVGs) during exercise has been described anecdotally in athletes. However, the prevalence and clinical effect of this observation are unclear. In addition, the most appropriate exercise technique (upright vs semisupine) for eliciting IVGs also remains unknown. The present study had 2 main aims: (1) to identify the prevalence of exercise IVGs in athletes whose preparticipation cardiovascular screening result for sports practice, according to the European Society of Cardiology guidelines, was positive; and (2) to evaluate the influence of performing exercise echocardiography, as described, on the detection of IVGs. We enrolled 139 consecutive athletes (135 amateurs and 4 professionals, mean age 22 ± 9.9 years; 30 women) who underwent treadmill exercise echocardiography. In each athlete, the IVG was evaluated by continuous wave Doppler during 5 conditions: left lateral decubitus at rest; upright at rest; upright at peak treadmill exercise; upright in the recovery phase; and left lateral decubitus in the recovery phase. All patients had normokinetic regional wall motion at rest and during exercise. According to the detection of IVG during treadmill echocardiography (IVG was considered significant if >30 mm Hg at rest or >50 mm Hg during/after exercise), 2 groups were identified: a group (n = 52), with significant IVG and a group (n = 87) without significant IVG. The IVG was greater in the upright position, both at rest (only 2 athletes from group with IVG) and after exercise (52 athletes, all from group with IVG). The IVG was lower in the recovery phase in the left lateral decubitus position (55 ± 15 mm Hg in 30 athletes, all from group with IVG) than in the upright position in the recovery phase (95 ± 35 mm Hg in 52 athletes, all from group with IVG) and at peak exercise (66 ± 24 mm Hg in 41 athletes from group with IVG). We observed systolic anterior movement of the mitral valve in 33 of the 52 athletes in the group with IVG and in none of the athletes in the group without IVG. In conclusion, in athletes, exercise-induced symptoms and/or ischemia-like electrocardiographic signs are often associated with significant IVG, developing in the absence of wall motion abnormalities. IVG was more evident during post-treadmill upright imaging.
The aim of the present study was to identify the prevalence of exercise-induced intraventricular gradients (IVGs) during upright exercise stress echocardiography in athletes with positive screening according to the guidelines from the European Society of Cardiology, who also had normal echocardiographic findings at rest. Another aim was to evaluate the influence of performing exercise echocardiography, as described, on the detection and magnitude of IVG.
Methods
The present study included 139 consecutive athletes (135 amateurs and 4 professionals, mean age 22 ± 9.9 years, range 9 to 56; 30 women). The athletes practiced the following sports: 58 athletics (49 running), 51 soccer, 7 tennis, 5 basketball, 5 handball, 5 swimming, and 8 other kinds of sports.
All athletes had positive findings on the preparticipation cardiovascular screening for sports practice. Of the 139 athletes, 112 complained of symptoms (i.e., chest pain, dizziness, or syncope) and 11 had had positive exercise electrocardiographic treadmill test results. Of the 27 asymptomatic athletes, 4 had history of sudden death in the family, 3 had slight mitral valve prolapse without mitral regurgitation, 17 had changes on the electrocardiogram, and 3 showed ventricular premature beats on the electrocardiogram.
All studied athletes had normal findings on the at rest echocardiogram, which did not reveal left ventricular hypertrophy or significant valvular pathologic features. At the moment of inclusion in the present study, no athletes were taking medication.
The Ethics Committee at Garcia de Orta Hospital approved the study. All athletes or their parents gave informed consent for the study.
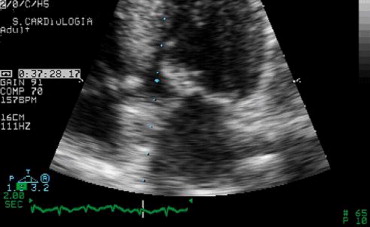
After complete echocardiographic evaluation, which also included determination of the left ventricular outflow tract index, left ventricular mass index, relative left ventricular wall thickness, left ventricular end-diastolic volume index, and IVG, all athletes stood upright while the IVG was sought before exercise. They then underwent stress echocardiography with 2-dimensional and Doppler echographic evaluation until the peak exercise level had been reached. Exercise stress echocardiography, as performed by us, included wall motion imaging during (rather than after) the entire treadmill exercise protocol and, in this group of patients, pulsed, continuous, and color Doppler evaluation from an apical window. Mitral valve motion was also assessed, for the development of systolic anterior movement of the mitral valve (SAM) ( Figure 1 ). After exercise, the athletes were maintained in the orthostatic position while we searched for an IVG or SAM of the mitral valve. When IVG was present, and at the moment it began to decrease, we laid the athletes supine and searched again for the presence of an IVG. The completed examinations were stored on videotape and partially on optical disk. An IVG was considered significant if >30 mm Hg at rest or >50 mm Hg during/after stress testing at the end of systole (telesystolic peak) ( Figure 2 ). The presence or absence of a significant IVG divided the patients into 2 groups.

The results are expressed as the mean ± SD for continuous variables, and frequency and percentage for categorical variables. The variables were compared between groups using the Student t test or Mann-Whitney U test, as appropriate. The chi-square test was used for qualitative variables. The results of the statistical tests were considered significant if the observed p value was <0.05.
Results
Of the group of 137 athletes, 52 (37.4%) developed IVG (group 1) and 87 (62.6%) did not (group 2), using the previously defined criteria for significant IVG.
The clinical and demographic data are listed in Table 1 . Figure 3 underscores the importance of the presence of symptoms or positive exercise electrocardiographic treadmill test results. The details of the exercise test results are listed in Table 2 , and the details of the echocardiographic findings in Tables 3, 4, and 5 . Of the 52 athletes with IVG, 33 (63%) developed SAM ( Figure 1 ), which was associated with significant IVG during exercise ( Figures 2 and 4 ). In the latter group of athletes, IVG was present in all of them ( Figure 5 ) in the recovery phase in the upright position. In 7 of these athletes, IVG was only present at this moment of the study. None of the athletes exhibited segmental wall abnormalities.
| Variable | IVG | p Value | |
|---|---|---|---|
| Yes | No | ||
| Age (years) | 24.4 ± 12 | 20.8 ± 8.4 | 0.140 |
| Men (%) | 92.3% | 72.4% | 0.005 |
| Body surface area (m 2 ) | 1.75 ± 0.17 | 1.68 ± 0.21 | 0.065 |
| Asymptomatic (%) | 3/52 (5.7%) | 24/87 (28.8%) | 0.002 |
| Variable | IVG | p Value | |
|---|---|---|---|
| Yes | No | ||
| Heart rate (beats/min) | |||
| Baseline | 81.4 ± 15.7 | 83.6 ± 12.8 | 0.331 |
| Peak | 177 ± 14 | 175 ± 10 | 0.219 |
| Systolic blood pressure (mm Hg) | |||
| Baseline | 120 ± 14 | 117 ± 14 | 0.169 |
| Peak | 164 ± 20 | 153 ± 20 | 0.001 |
| Duration (seconds) | 765 ± 107 | 751 ± 145 | 0.58 |
| Heart rate × blood pressure | 29,110 ± 3,383 | 26,661 ± 3,874 | <0.001 |
| Symptoms during exercise test | 19/52 (36.5%) | 14/87 (16.1%) | 0.006 |
| Variable | IVG | p Value | |
|---|---|---|---|
| Yes | No | ||
| Left ventricle telediastolic diameter index (mm/m 2 ) | 26.4 ± 2 | 28.5 ± 2.5 | <0.001 |
| Fractional shortening (%) | 39.8 ± 5.3 | 37.7 ± 4.5 | 0.008 |
| Interventricular septum index (mm/m 2 ) | 5.25 ± 0.66 | 5.1 ± 0.62 | 0.165 |
| Posterior wall index (mm/m 2 ) | 4.85 ± 0.55 | 4.64 ± 0.56 | 0.094 |
| Left ventricular mass index (g/m 2 ) | 78.66 ± 11.39 | 78.57 ± 13.56 | 0.654 |
| Relative left ventricular wall thickness | 0.37 ± 0.04 | 0.33 ± 0.03 | <0.001 |
| Variable | IVG | p Value | |
|---|---|---|---|
| Yes | No | ||
| Left ventricular outflow tract index (mm/m 2 ) | 10.7 ± 0.85 | 11.62 ± 0.93 | <0.001 |
| Ejection fraction (%) | 67.4 ± 4.8 | 66.8 ± 5.2 | 0.496 |
| Left ventricular diastolic volume index (ml/m 2 ) | 47.55 ± 9.17 | 55.02 ± 9.02 | <0.001 |
| Variable | IVG | p Value | |
|---|---|---|---|
| Yes | No | ||
| Maximal velocity of E wave of mitral flow (cm/s) | 94.4 ± 8.5 | 91.6 ± 9.6 | 0.086 |
| Maximal velocity of A wave of mitral flow (cm/s) | 51.6 ± 10.1 | 51.3 ± 8.1 | 0.81 |
| Deceleration time (ms) | 160.8 ± 9 | 163.8 ± 11.6 | 0.14 |
| Isovolumic relaxation time (ms) | 71 ± 11.7 | 73.8 ± 11 | 0.049 |
Stay updated, free articles. Join our Telegram channel

Full access? Get Clinical Tree


