Few studies have examined long-term effects of statin therapy on kidney diseases. The objective of this study was to determine the association of statin use with incidence of acute and chronic kidney diseases after prolonged follow-up. In this retrospective cohort study, we analyzed data from the San Antonio area military health care system from October 2003 through March 2012. Statin users were propensity score matched to nonusers using 82 baseline characteristics including demographics, co-morbidities, medications, and health care utilization. Study outcomes were acute kidney injury, chronic kidney disease (CKD), and nephritis/nephrosis/renal sclerosis. Of the 43,438 subjects included, we propensity score matched 6,342 statin users with 6,342 nonusers. Statin users had greater odds of acute kidney injury (odds ratio [OR] 1.30, 95% confidence interval [CI] 1.14 to 1.48), CKD (OR 1.36, 95% CI 1.22 to 1.52), and nephritis/nephrosis/renal sclerosis (OR 1.35, 95% CI 1.05 to 1.73). In a subset of patients without co-morbidities, the association of statin use with CKD remained significant (OR 1.53, 95% CI 1.27 to 1.85). In a secondary analysis, adjusting for diseases/conditions that developed during follow-up weakened this association. In conclusion, statin use is associated with increased incidence of acute and chronic kidney disease. These findings are cautionary and suggest that long-term effects of statins in real-life patients may differ from shorter term effects in selected clinical trial populations.
The 2013 American College of Cardiology/American Heart Association cholesterol guidelines have broadened the scope of statin therapy because of their proven beneficial cardiovascular effects. With broader application, previously underrecognized adverse events are likely to become apparent. Two large population-based studies demonstrated an association between kidney dysfunction and statin use. However, several randomized control trials (RCT) have not confirmed this association. A position paper from an international lipid expert panel supports the use of statins in patients with kidney diseases; however, it acknowledges that statins may be associated with increased risk of acute renal failure and proteinuria. Whereas, RCTs are the gold standard to establish efficacy of medications, they may underestimate adverse events. The objective of this study was to examine the association of statin use with the risk of kidney disease after prolonged follow-up in a military health care system in which patients have similar health care access and standards.
Methods
This retrospective cohort study was approved by the Institutional Review Boards at the Brooke Army Medical Center and VA North Texas Health Care System. We analyzed data from Tricare Prime or Plus enrollees in the San Antonio area. The database and study population have been described elsewhere. Briefly, data were extracted from October 1, 2003, to March 1, 2012, and encompassed outpatient and inpatient medical records, medical benefit claims data, laboratory data performed within military facilities, and pharmacy data regardless of dispensing pharmacy location or affiliation.
The study was divided into a baseline period (October 1, 2003, to September 30, 2005), used to describe baseline characteristics, and a follow-up period (October 1, 2005, to March 1, 2012), used to ascertain outcomes. Study participants were 30- to 85-years old, had ≥1 outpatient visit during the baseline period, had ≥1 visit during the follow-up period, and received ≥1 prescription medication during the baseline period. All patients were enrolled in the system during both the study baseline and follow-up periods with no missing data.
Exclusion criteria were (1) patients with trauma or burns (based on International Classification of Diseases, Ninth Revision, Clinical Modification [ICD-9-CM] codes) ; (2) patients who began statin therapy after September 30, 2005, (end of the baseline period) to allow for the creation of statin user and nonuser groups with equal periods of follow-up; and (3) patients who received statins for <90 days.
Statin users filled statin prescriptions for a cumulative period of ≥90 days from October 1, 2004, to September 30, 2005. Nonusers did not receive a statin throughout the entire study period. High- and low-to-moderate intensity statin use was defined according to the 2013 American College of Cardiology/American Heart Association cholesterol guidelines with modification to include simvastatin 80 mg in the high-intensity group, which was widely used during the study period.
Outcomes were defined using prespecified diagnosis groups of kidney diseases, using ICD-9-CM codes, as identified by the Agency for Healthcare Research and Quality Clinical Classifications Software (AHRQ-CCS). Our prespecified outcomes were (1) acute and unspecified kidney injury (AKI): AHRQ-CCS category 157; (2) chronic kidney disease (CKD): AHRQ-CCS category 158; and (3) nephritis/nephrosis/renal sclerosis: AHRQ-CCS category 156 ( Appendix A ). The AHRQ-CCS has been previously validated and has been widely used in health care research. The use of ICD-9 codes to ascertain outcomes of CKD has been widely used in calculating Charlson Comorbidity Index using Deyo’s method.
We identified the following 2 main cohorts: (1) overall cohort: This cohort included all patients who met the study criteria. From this cohort, we created a “propensity score (PS)–matched overall cohort” using 82 baseline characteristics ( Appendix B ) including demographics, co-morbidities, Charlson Comorbidity Index, presence of renal diseases at baseline, health care utilization, and use of 20 classes of medications ; and (2) healthy cohort: This cohort included patients who used statins for primary prevention and were without severe co-morbidities, as described in a previous study ; hence, we excluded patients with (1) any Charlson Comorbidity Index element (including diabetes and CKD), (2) any cardiovascular diseases, and (3) conditions that might limit life expectancy or physical activity ( Appendix C ). We subsequently created a “PS-matched healthy cohort” of statin users and nonusers.
Our primary analysis examined outcomes in the 2 PS cohorts (PS-matched overall cohort and PS-matched healthy cohort). We also performed the following secondary analyses: (1) risk of outcomes in a “No-Charlson Comorbidity Subgroup” of the overall cohort: patients with a Charlson Comorbidity Index >0 at baseline were excluded; (2) risk of outcomes in a “Renal Disease Incident Subgroup” of the overall cohort: patients with renal diseases at baseline were excluded; (3) risk of outcomes in the “High-Intensity Statin users Subgroup” of the overall cohort: we restricted statin users to those who used a high-intensity statin therapy at any point during the study period and examined the risk of outcomes in comparison to nonusers; (4) risk of outcomes in a “Four-year Statin users Subgroup” of the overall cohort: in this analysis, we restricted statin users to those who used statins for ≥4 years and examined the risk of outcomes in comparison to nonusers; (5) risk of outcomes in the healthy cohort; (6) risk of outcomes in each of PS-matched overall cohort and PS-matched healthy cohort adjusting for other diseases/conditions that may have developed during the follow-up period such as incident diabetes mellitus, hypertension requiring antihypertensive medications, and the number of coronary or arterial revascularization procedures during follow-up period; and (7) time-to-event analysis of outcomes in PS-matched overall cohort using Cox proportional hazard analysis.
We also performed the following sensitivity analyses: (1) dose-response in the overall cohort: we compared the risks of outcomes between high-intensity statin users and low-to-moderate intensity statin users from the overall cohort; and (2) dose-response in the healthy cohort: we compared the risks of outcomes between high-intensity statin users and low-to-moderate intensity statin users from the healthy cohort.
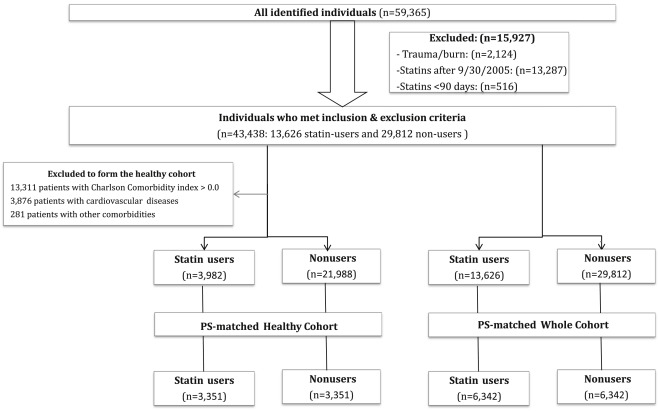
Baseline characteristics of the groups were compared using the chi-square analysis for categorical variables and unpaired 2-tailed Student t test for continuous variables. A logistic regression model was used to create the PS and perform the nearest number matching to achieve 1:1 matching and balance between groups at p >0.05 ( Figure 1 ), as described previously. For the PS-matched analyses, we calculated the odds ratios (OR) using conditional logistic regression because the cohorts were matched with no statistically significant imbalances. We calculated the number needed to be exposed for 1 additional person to be harmed according to a published formula. For secondary and sensitivity analyses, we used separate logistic regression models for each outcome, in which the outcome was the dependent variable, statin use (or high-intensity statin use) was the independent variable, and adjusted for propensity score. Risk of outcome was represented as OR and 95% confidence interval (CI). A 2-tailed p value of ≤0.05 was considered to be statistically significant. Statistical analyses were performed using Stata version 12 (College Station, Texas) and SPSS version 19 (Armonk, New York).
Results
A total of 43,438 patients met inclusion and exclusion criteria (13,626 statin users and 29,812 nonusers; Figure 1 ). Statin users were older, had more co-morbidities, and used more health care; a full description of this cohort was previously described. The mean duration of follow-up was 6.19 ± 0.64 years (median follow-up 6.42 years; interquartile range 6.21 to 6.48 years). Simvastatin was most commonly prescribed (73.5%), followed by atorvastatin (17.4%), pravastatin (7%), and rosuvastatin (1.7%). Mean cumulative duration of statin use was 4.65 ± 1.82 years. Approximately, 38% (n = 5,214) of statin users were prescribed high-intensity statins.
We matched 6,342 pairs of statin users and nonusers in the PS-matched overall cohort and 3,351 pairs in the PS-matched healthy cohort with no significant differences in characteristics between the treatment arms ( Tables 1 and 2 ). In the PS-matched overall cohort, statin users had statistically significant greater OR for AKI, CKD, and nephritis/nephrosis/renal sclerosis. In the PS-matched healthy cohort, statin users were more likely to have CKD compared to healthy nonusers but not AKI and nephritis/nephrosis/renal sclerosis ( Table 3 ).
| Variable | Statin user | P value | |
|---|---|---|---|
| No (n = 6,342) | Yes (n = 6,342) | ||
| Age (years) | 56.0 ± 12.0 | 55.7 ± 12.4 | 0.1 |
| Women | 2,856 (45.0%) | 2,924 (46.1%) | 0.2 |
| Alcohol-related disorders | 83 (1.3%) | 78 (1.2%) | 0.7 |
| Substance-related disorders | 24 (0.4%) | 22 (0.3%) | 0.8 |
| Smoker ∗ | 534 (8.4%) | 509 (8.0%) | 0.4 |
| Overweight/obese † | 993 (15.7%) | 960 (15.1%) | 0.4 |
| Diabetes mellitus | 743 (11.7%) | 789 (12.4%) | 0.2 |
| Diabetes mellitus with complications | 220 (3.5%) | 247 (3.9%) | 0.2 |
| Heart valve disorder | 402 (6.3%) | 403 (6.4%) | 0.97 |
| Hypertension | 3,766 (59.4%) | 3,707 (58.5%) | 0.3 |
| Hypertension with complications and secondary hypertension ‡ | 176 (2.8%) | 181 (2.9%) | 0.8 |
| Hypertension with complications | 171 (2.7%) | 175 (2.8) | 0.9 |
| Secondary hypertension | 8 (0.1%) | 11 (0.2%) | 0.5 |
| Acute myocardial infarction | 20 (0.3%) | 25 (0.4%) | 0.5 |
| Coronary atherosclerosis and other heart disease | 277 (4.4%) | 314 (5.0%) | 0.1 |
| Dysrhythmia | 874 (13.8%) | 887 (14.0%) | 0. 8 |
| Cerebrovascular disease | 128 (2.0%) | 125 (2.0%) | 0.9 |
| Peripheral and visceral atherosclerosis | 153 (2.4%) | 169 (2.7%) | 0.4 |
| Aortic, peripheral, and visceral artery aneurysms | 39 (0.6%) | 54 (0.9%) | 0.1 |
| Aortic and peripheral arterial embolism or thrombosis | 12 (0.2%) | 14 (0.2%) | 0.9 |
| Chronic obstructive pulmonary disease and bronchiectasis ‡ | 734 (11.6%) | 742 (11.7%) | 0.8 |
| Chronic obstructive pulmonary disease | 721 (11.4%) | 740 (11.7%) | 0.6 |
| Bronchiectasis | 19 (0.3%) | 4 (0.1%) | 0.003 |
| Asthma | 375 (5.9%) | 366 (5.8%) | 0.7 |
| Nephritis, nephrosis, renal sclerosis, and chronic kidney disease | 88 (1.4%) | 93 (1.5%) | 0.8 |
| Acute and unspecified renal failure | 65 (1.0%) | 78 (1.2%) | 0.3 |
| Rheumatoid arthritis and related disease; systemic lupus erythematosus and connective tissue disorders | 172 (2.7%) | 156 (2.5%) | 0.4 |
| Number of inpatient admissions during baseline period | 0.25 ± 0.75 | 0.26 ± 0.77 | 0.8 |
| Number of outpatient medical encounters during baseline period | 31.67 ± 36.76 | 31.81 ± 40.63 | 0.8 |
| Number of encounters for immunization during baseline period | 0.48 ± 1.60 | 0.49 ± 3.71 | 0.8 |
| Charlson comorbidity total score § | 0.64 ± 1.23 | 0.66 ± 1.25 | 0.3 |
| Medications at baseline | |||
| Beta-blocker | 1,099 (17.3%) | 1,123 (17.7%) | 0.6 |
| Diuretic | 1,740 (27.4%) | 1,718 (27.1%) | 0.7 |
| Angiotensin converting enzyme inhibitor/ Angiotensin receptor blocker | 2,137 (33.7%) | 2,141 (33.8%) | 0.96 |
| Calcium channel blocker | 987 (15.6%) | 1,001 (15.8%) | 0.8 |
| Proton pump inhibitor | 2,009 (31.7%) | 2,030 (32.0%) | 0.7 |
| Aspirin | 1,835 (28.9%) | 1,890 (29.8%) | 0.3 |
| Non-steroidal anti-inflammatory drug | 3,729 (58.8%) | 3,702 (58.4%) | 0.6 |
| Selective serotonin reuptake inhibitor | 1,059 (16.7%) | 1,067 (16.8%) | 0.9 |
| Systemic corticosteroid | 257 (4.1%) | 249 (3.9%) | 0.8 |
| Cytochrome p450 ¶ | 386 (6.1%) | 414 (6.5%) | 0.3 |
| Non-statin lipid lowering drug | 373 (5.9%) | 391 (6.2%) | 0.5 |
| Antiplatelet agent (other than aspirin) | 101 (1.6%) | 112 (1.8%) | 0.5 |
∗ Diagnosis was defined as ICD-9-CM codes 3051 and V1582.
† Diagnosis is based on selected ICD-9-CM diagnosis codes from category 56 of the Agency of Health Research and Quality-Clinical Classification Software (other nutritional; endocrine; and metabolic disorders) related to overweight, obesity and hyperalimentation (codes: 2780, 27800, 27801, 27802, 27803, 2781, 2788, and 7831).
‡ Each of the disease category of “Hypertension with complications and secondary hypertension” and “Chronic obstructive pulmonary disease and bronchiectasis” was introduced into our propensity score as a single variable since each of them was designated as a separate disease category by the Agency of Health Research and Quality-Clinical Classification Software. The subdivisions of these disease categories were not included as separate variables in creating the propensity score.
§ Charlson comorbidity total score was calculated using Deyo et al method.
¶ Medications that inhibit the Cytochrome p450 system as identified in an FDA warning.
| Variable | Statin user | P value | |
|---|---|---|---|
| No (n =3,351) | Yes (n =3,351) | ||
| Age (years) | 53 ± 11 | 53 ± 11 | 0.7 |
| Women | 1,285 (38.3%) | 1,314 (39.2) | 0.5 |
| Charlson comorbidity score | 0 | 0 | 0 |
| Smoker | 241 (7.2%) | 237 (7.1%) | 0.9 |
| Alcohol-related disorders | 29 (0.9%) | 31 (0.9%) | 0.9 |
| Overweight/obese † | 493 (14.7%) | 455 (13.6%) | 0.2 |
| Hypertension | 1,704 (50.9%) | 1,678 (50.1%) | 0.5 |
| Acute kidney injury | 5 (0.1%) | 5 (0.1%) | 1.0 |
| Asthma | 102 (3.0%) | 96 (2.9%) | 0.7 |
| Osteoarthritis, arthropathy, and back disorder | 1,534 (45.8%) | 1,548 (46.2%) | 0.8 |
| Sprains, strains, and trauma-related joint disorders | 596 (17.8%) | 603 (18.0%) | 0.9 |
| Rehabilitation care; fitting of prostheses; and adjustment of devices | 506 (15.1%) | 544 (16.2%) | 0.2 |
| Number of inpatient admissions during baseline period | 0.08 ± 0.3 | 0.08 ± 0.3 | 0.8 |
| Number of outpatient medical encounters during baseline period | 21.1 ± 22.7 | 21.1 ± 19.1 | 0.9 |
| Number of encounters for immunization during baseline period | 0.40 ± 1.1 | 0.42 ± 1.14 | 0.4 |
| Receiving immunization and screening for infectious disease | 643 (19.2%) | 670 (20.0%) | 0.4 |
| Medications at baseline | |||
| Beta-blocker | 428 (12.8%) | 459 (13.7%) | 0.3 |
| Diuretic | 728 (21.7%) | 742 (22.1%) | 0.7 |
| Angiotensin converting enzyme inhibitor/ Angiotensin receptor blocker | 886 (26.4%) | 899 (26.8%) | 0.7 |
| Calcium channel blocker | 384 (11.5%) | 395 (11.8%) | 0.7 |
| Aspirin | 777 (23.2%) | 826 (24.6%) | 0.2 |
| Non-steroidal anti-inflammatory drug | 1,911 (57.0%) | 1,926 (57.5%) | 0.7 |
| Non-statin lipid lowering drug | 194 (5.8%) | 217 (6.5%) | 0.3 |
| Oral hypoglycemic agent | 16 (0.5%) | 16 (0.5%) | 1.0 |
| Cytochrome p450 ‡ | 182 (5.4%) | 193 (5.8%) | 0.6 |
| Selective serotonin reuptake inhibitor | 441 (13.2%) | 456 (13.6%) | 0.6 |
| Systemic steroid | 63 (1.9%) | 72 (2.1%) | 0.5 |
∗ Full description of characteristics of this cohort was previously published. .
† Diagnosis is based on selected ICD-9-CM diagnosis codes from category 56 of the Agency of Health Research and Quality-Clinical Classification Software (other nutritional; endocrine; and metabolic disorders) related to overweight, obesity and hyperalimentation (codes: 2780, 27800, 27801, 27802, 27803, 2781, 2788, and 7831).
‡ Medications that inhibit the Cytochrome p450 system as identified in an FDA warning. .
| Variable | Statin-user | Odds Ratio | 95%CI | P value | NNEH | |
|---|---|---|---|---|---|---|
| No | Yes | |||||
| Primary analyses | ||||||
| Propensity score-matched overall cohort (6,342 nonusers and 6,342 statin users) | ||||||
| Acute and unspecified renal failure | 419 (6.6%) | 533 (8.4%) | 1.30 | 1.14 – 1.48 | <0.001 | 55 |
| Chronic kidney disease | 654 (10.3%) | 858 (13.5%) | 1.36 | 1.22 – 1.52 | <0.001 | 31 |
| Nephritis; nephrosis; renal sclerosis | 111 (1.8%) | 149 (2.3%) | 1.35 | 1.05 – 1.73 | 0.02 | 163 |
| Propensity score-matched healthy cohort (3,351 nonusers and 3,351 statin users) | ||||||
| Acute and unspecified renal failure | 127 (3.8%) | 157 (4.7%) | 1.25 | 0.98 – 1.59 | 0.07 | n/a |
| Chronic kidney disease | 193 (5.8%) | 287 (8.6%) | 1.53 | 1.27 – 1.85 | <0.001 | 36 |
| Nephritis; nephrosis; renal sclerosis | 18 (0.5%) | 25 (0.7%) | 1.39 | 0.76 – 2.56 | 0.3 | n/a |
| Secondary analyses | ||||||
| No-Charlson comorbidity subgroup (24,366 nonusers and 5,761 statin users) | ||||||
| Acute and unspecified renal failure | 394 (1.6%) | 429 (7.4%) | 1.39 ∗ | 1.15 – 1.67 | 0.001 | |
| Chronic kidney disease | 515 (2.1%) | 748 (13.0%) | 1.72 ∗ | 1.48 – 2.00 | <0.001 | |
| Nephritis; nephrosis; renal sclerosis | 73 (0.3%) | 53 (0.9%) | 1.17 ∗ | 0.73 – 1.88 | 0.5 | |
| Renal Disease Incident subgroup (29,599 nonusers and 12,685 statin users) | ||||||
| Acute and unspecified renal failure | 670 (2.3%) | 1,770 (14.0%) | 1.35 ∗ | 1.19 – 1.54 | <0.001 | |
| Chronic kidney disease | 893 (3.0%) | 2,606 (20.5%) | 1.49 ∗ | 1.33 – 1.66 | <0.001 | |
| Nephritis; nephrosis; renal sclerosis | 134 (0.5%) | 624 (4.9%) | 1.42 ∗ | 1.11 – 1.80 | 0.005 | |
| High-intensity statin users versus nonusers in of the overall cohort (29,812 nonusers and 5,214 statin users) | ||||||
| Acute and unspecified renal failure | 739 (2.5%) | 1,094 (21.0%) | 1.44 ∗ | 1.24 – 1.66 | <0.001 | |
| Chronic kidney disease | 999 (3.4%) | 1,523 (29.2%) | 1.33 ∗ | 1.17 – 1.51 | <0.001 | |
| Nephritis; nephrosis; renal sclerosis | 187 (0.6%) | 558 (10.7%) | 2.21 ∗ | 1.74 – 2.81 | <0.001 | |
| Four-year statin users versus nonusers in the overall cohort (29,812 nonusers and 9,322 4-years statin users) | ||||||
| Acute and unspecified renal failure | 739 (2.5%) | 1,694 (18.2%) | 1.35 ∗ | 1.18 – 1.54 | <0.001 | |
| Chronic kidney disease | 999 (3.4%) | 2,544 (27.3%) | 1.51 ∗ | 1.35 – 1.69 | <0.001 | |
| Nephritis; nephrosis; renal sclerosis | 187 (0.6%) | 760 (8.2%) | 1.41 ∗ | 1.14 – 1.74 | 0.002 | |
| Healthy cohort (21,988 nonusers and 3,982 statin users) | ||||||
| Acute and unspecified renal failure | 316 (1.4%) | 225 (5.7%) | 1.39 ∗ | 1.12 – 1.73 | 0.003 | |
| Chronic kidney disease | 379 (1.7%) | 413 (10.4%) | 1.77 ∗ | 1.48 – 2.11 | <0.001 | |
| Nephritis; nephrosis; renal sclerosis | 54 (0.2%) | 34 (0.9%) | 1.37 ∗ | 0.80 – 2.34 | 0.3 | |
| Propensity score-matched overall cohort adjusting for other diseases during follow-up period (6,342 nonusers and 6,342 statin users) | ||||||
| Acute and unspecified renal failure | 419 (6.6%) | 533 (8.4%) | 1.12 † 1.06 ‡ | 1.05 – 1.37 0.92 – 1.21 | 0.009 0.43 | |
| Chronic kidney disease | 654 (10.3%) | 858 (13.5%) | 1.27 † 1.17 ‡ | 1.13 – 1.41 1.04 – 1.31 | <0.001 0.007 | |
| Nephritis; nephrosis; renal sclerosis | 111 (1.8%) | 149 (2.3%) | 1.13 † 1.05 ‡ | 0.88 – 1.45 0.82 – 1.36 | 0.35 0.69 | |
| Propensity score-matched healthy cohort adjusting for other diseases during follow-up period (3,351 nonusers and 3,351 statin users) | ||||||
| Acute and unspecified renal failure | 127 (3.8%) | 157 (4.7%) | 1.18 † 1.07 ‡ | 0.93 – 1.50 0.84 – 1.37 | 0.18 0.57 | |
| Chronic kidney disease | 193 (5.8%) | 287 (8.6%) | 1.14 † 1.34 ‡ | 1.19 – 1.75 1.11 – 1.63 | <0.001 0.003 | |
| Nephritis; nephrosis; renal sclerosis | 18 (0.5%) | 25 (0.7%) | 1.10 † 1.08 ‡ | 0.60 – 2.05 0.58 – 2.01 | 0.75 0.81 | |
Stay updated, free articles. Join our Telegram channel

Full access? Get Clinical Tree


