CHAPTER 10
Stage C: Cardiorenal Syndrome
“Which comes first? The chicken, or the egg?”
The Cardiorenal Syndrome: Definition and Characteristics
Cardiorenal syndrome (CRS) can be defined as a disorder of the heart and kidneys with acute or chronic dysfunction of one organ associated with acute or chronic dysfunction of the other.1 One or more of three specific features are usually present: heart failure with coexisting renal disease (cardiorenal failure), worsening renal function (developing during the treatment of acute decompensated heart failure), and/or diuretic resistance.2
THE CARDIORENAL SYNDROME CLASSIFICATION BY SUBTYPES
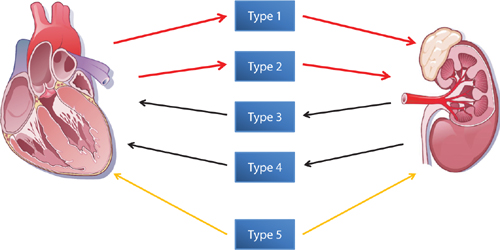
Ronco et al. categorized CRS into 5 subtypes depending on the primary dysfunctional organ and chronicity of the syndrome (Table 10.1, Figure 10.1).1 Renal dysfunction is the primary organ involvement in types 3 and 4, which are designated as “renocardiac” syndromes. Management and prognosis can depend on which organ is determined as the primary cause of the syndrome. Forman and coworkers reported a 27% incidence of cardiorenal syndrome in patients hospitalized for heart failure.3 Worsening renal function (WRF) was defined as an increase in serum creatinine of > 0.3 mg/dL from baseline. A history of heart failure or diabetes, admission creatinine > 1.5 mg/dL, and systolic blood pressure > 160 mm Hg predicted higher risk of WRF. WRF was associated with increased in-hospital mortality, complications, and duration of hospitalization.3
TABLE 10.1 Subtype classification of CRS.1
TYPE 1 ACUTE CARDIORENAL SYNDROME | Rapid worsening of cardiac function leading to acute kidney injury. |
TYPE 2 CHRONIC CARDIORENAL SYNDROME | Chronic abnormalities in cardiac function causing progressive chronic kidney disease. |
TYPE 3 ACUTE RENOCARDIAC SYNDROME | Abrupt and primary worsening of kidney function leading to acute cardiac dysfunction. |
TYPE 4 CHRONIC RENOCARDIAC SYNDROME | Primary chronic kidney disease contributing to decreased cardiac function, ventricular hypertrophy, diastolic dysfunction, and/or increased risk of adverse cardiovascular events. |
TYPE 5 SECONDARY CARDIORENAL SYNDROME | Presence of combined cardiac and renal dysfunction due to acute or chronic systemic disorders.4 |
FIGURE 10.1 The 5 subtypes of CRS identified by Ronco et al. The interaction between the heart and kidneys may occur as a result of either primary cardiac dysfunction (red arrows) or renal dysfunction (black arrows) or both (gold arrows).1 Source: Adapted with permission from Ronco et al., J Am Coll Cardiol. 2008;52(19):1527-1539.
Measuring Renal Function
The National Kidney Foundation has divided renal function and impairment into 5 progressive stages based on estimated glomerular filtration rate (eGFR) (Table 10.2). In this system, chronic kidney disease (CKD) is defined as a reduction of glomerular filtration rate (GFR) < 60 mL/min/1.73 m2 for at least 3 months and includes Stages 3, 4, and 5.54 Stages 1 and 2 refer to normal or only mildly reduced eGFR.
TABLE 10.2 Stages of chronic kidney disease (CKD) from the National Kidney Foundation.5
CKD STAGES | eGFR | DESCRIPTION OF REDUCTION IN GFR |
1 | ≥ 90 | Normal (no dysfunction) |
2 | 60–89 | Mild |
3 | 30–59 | Moderate |
4 | 15–29 | Severe |
5 | < 15 | Kidney failure |
Historically, GFR was measured by 24-hour urine collection and blood measurements of a filtered marker such as creatinine. Currently, estimated GFR (eGFR) may be calculated from validated equations for adults derived from a single measurement of a blood-level marker, typically creatinine or cystatin C (Table 10.3). Estimated GFR is corrected for body surface area and expressed compared to the average-sized man as mL/min/1.73 m2. In 2011, 92% of laboratories reporting eGFR used the 4-variable MDRD equation.6
TABLE 10.3 Common equations derived using endogenous filtration markers to calculate eGFR in adults. Abbreviations: BUN, blood urea nitrogen; CCr, creatinine clearance; Cr, creatinine; CysC, cystatin C; eGFR, estimated GFR; SCr, serum creatinine (mg/dL); SCys, serum cystatin C (mg/L).
EQUATION NAME (EGFR UNITS) | VARIABLES | VALIDATION MARKERS |
SCr, age, body mass, gender | CCr from 24-hr urine collection | |
Original Modification of Diet in Renal Diseaseb (MDRD) – 6 variables8(mL/min/1.73 m2) | SCr, age, race (black or non-black), gender, BUN, albumin levels | 24-hr urinary clearance of constantly infused 125I-iothalamate |
SCr, age, race (black or non-black), gender | 24-hr urinary clearance of constantly infused 125I-iothalamate | |
Chronic Kidney Disease Epidemiology Collaborationd (CKD-EPI)10 (mL/min/1.73 m2) | SCr, age, race (black or non-black), gender | Urinary or plasma clearance of insulin or 125I-iothalamate |
SCys, gender | Urinary clearance of 125I-iothalamate | |
SCr, SCys, race (black or non-black), gender | Urinary clearance of 125I-iothalamate |
Legend: Each equation (method) has certain metabolic parameters that affect validity
aCockcroft-Gault Creatinine Clearance: Serum Cr is affected by patient muscle mass and renal tubular secretion.
bOriginal MDRD – 6: Equation is valid when GFR < 60 mL/min/1.73 m2.
cMDRD – 4: Equation is valid when GFR < 60 mL/min/1.73 m2.
dEquation more sensitive to changes in GFR with baseline preserved renal function (GFR > 60 mL/min/1.73 m2).
eCysC production is not dependent on muscle mass and is completely metabolized in the kidney without excretion or reuptake.
fCKD-EPI creatinine-cystatin C: CysC production is not dependent on muscle mass and is completely metabolized in the kidney without excretion or reuptake.
CREATININE VERSUS CYSTATIN C
Creatinine is a low-molecular-weight metabolite (113 Da [Daltons]) derived from the breakdown of skeletal muscle creatine phosphate. This waste product is widely used as a biomarker of kidney function and commonly used to calculate eGFR values. However, estimated creatinine clearance can overestimate true GFR if decreased cellular production reduces serum creatinine significantly (e.g., cachexia, age, malnutrition, female gender, and dietary protein restriction). Failure to take these factors into account can lead to the underdiagnosis of CKD.
Recently, cystatin C has become an alternative marker for eGFR. The relatively large protein molecule (13,250 Da), a cysteine protease inhibitor, is produced at a constant rate by nucleated cells. It is freely filtered by the glomerulus and not secreted, but reabsorbed with complete catabolism by proximal tubules. Therefore, calculated eGFR using serum cystatin C versus creatinine alone may be more reflective of actual renal filtration function.12
Association of Abnormal GFR and Heart Failure Mortality
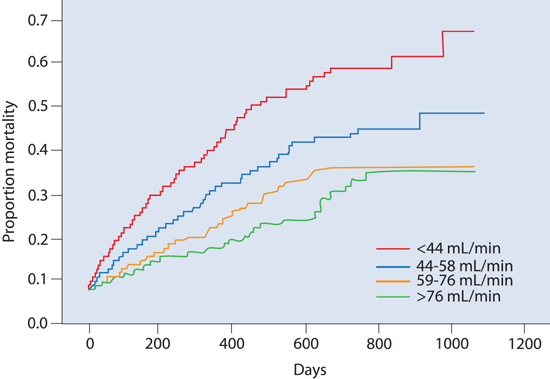
Currently, approximately 26 million adults in the United States have a GFR < 60 mL/min/1.73 m2 (Stages 3–5 CKD).12 Hillege and coworkers13 studied renal function as a predictor for mortality in heart failure in outpatients with a left ventricular ejection fraction (LVEF) ≤ 35% (Figure 10.2). Impaired renal function was independent of impaired LVEF, yet strongly associated with mortality in patients with heart failure and correlated with plasma levels of N-terminal atrial natriuretic peptide (ANP).
FIGURE 10.2 Renal dysfunction associated with increased morbidity and mortality in outpatients with class III/IV heart failure. Kaplan-Meier mortality curves for quartiles of baseline creatinine clearance (GFRc) as shown in the lower right corner. The GFRc was calculated using Cockroft-Gault equation. (NYHA class: III [n = 1138]; III/IV [n = 607]; IV [n = 161].) After a median follow-up of 277 days, 18% of patients had died. Impaired renal function was a stronger predictor of mortality than indices of impaired cardiac function (LVEF and NYHA class) and was also associated with increasing levels of N-terminal ANP. Patients in the lowest quartile of GFRc (< 44 mL/min) had almost 3 times the risk of mortality than patients with the highest renal function (GFRc > 76 mL/min).13 Source: Adapted with permission from Hillege et al., Circulation. 2000;102(2):203-210.
IMPAIRED RENAL FUNCTION IN HOSPITALIZED HEART FAILURE PATIENTS
From the ADHERE database, n = 105,388, Heywood and coworkers calculated GFR using the 4-variable MDRD in hospitalized heart failure patients with a mean serum creatinine of 1.8 ± 1.6 mg/dL. Moderate to severe renal dysfunction (Stage 3-5 CKD) was identified in 59.3% of males and 67.6% of females. In-hospital mortality increased as renal function decreased from normal renal function (Stage 1 CKD) to severe dysfunction (Stage 4 CKD) and kidney failure (Stage 5 CKD) from 1.9% to 7.6% and 6.5%, respectively.14
Factors Affecting GFR
The majority of physiological variables have a predictable effect on GFR (Table 10.4). Changes in central venous pressure have a variable effect discussed below.
TABLE 10.4 Physiological variables affecting GFR.
VARIABLE | ACUTE EFFECT ON GFR |
↑ Mean arterial pressure | ↑ |
↑ Renal blood flow | ↑ |
↑ Central venous pressure | ↓↑ |
↑ Renal sympathetic pre-glomerular vasoconstriction | ↓ |
↑ Renal angiotensin II post-glomerular vasoconstriction | ↑ |
↑ Exogenous nephron toxins | ↓ |
CENTRAL VENOUS PRESSURE (CVP) AND GFR
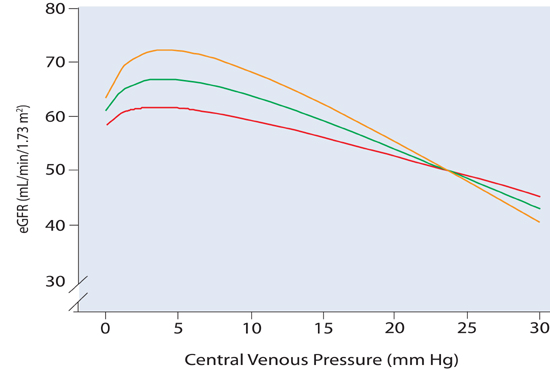
In vitro animal experiments demonstrate that an isolated increase in renal vein pressure (equal to CVP in vivo) leads to worsening GFR.15 In patients with cardiorenal syndrome, however, causality may be uncertain, because a primary change in either (central) venous pressure or kidney function can secondarily affect the other. In patients with cardiovascular disease undergoing right heart catheterization, the relationship between CVP and renal function is bimodal, with worse renal function at both very low and high filling pressures.16 At low levels of CVP (and presumably cardiac output), Damman and coworkers observed a gradual concordant increase in CVP and GFR (Figure 10.3). At CVP > 6 mm Hg, however, renal function decreased as CVP further increased. This effect was more pronounced in patients with a preserved (not decreased) cardiac output. In part, this may relate to a high CVP leading to a decrease in renal vascular pressure gradient (arterial pressure – venous pressure), although CVP may also be a surrogate indicator for a range of neurohumoral and inflammatory processes. When CVP is lowered (during relief of congestion) in individual cases, variable effects on renal function are seen suggesting that the overall inverse association between CVP and GFR can be altered by multiple feedback pathways.15
FIGURE 10.3 Curvilinear relationships between eGFR versus CVP at three different levels of cardiac index (colored lines). Data from right heart catheterization (n = 2577; mean eGFR for all 3 groups = 65 ± 24 mL/min/1.73 m2, with a cardiac index = 2.9 ± 0.81 L/min/m2, and CVP = 5.9 ± 4.3 mm Hg, P < 0.0001). Red line indicates cardiac index < 2.5 L/min/m2; green line indicates cardiac index 2.5 to 3.2 L/min/m2; orange line indicates cardiac index > 3.2 L/min/m2. A very low CVP was associated with a decrease in eGFR in all 3 groups. High CVP was more closely associated with impaired renal function in patients with a higher cardiac index (orange line).16 Source: Adapted with permission from Damman et al., J Am Coll Cardiol. 2009;53(7):582-588.
Management of Heart Failure with Impaired Kidney Function
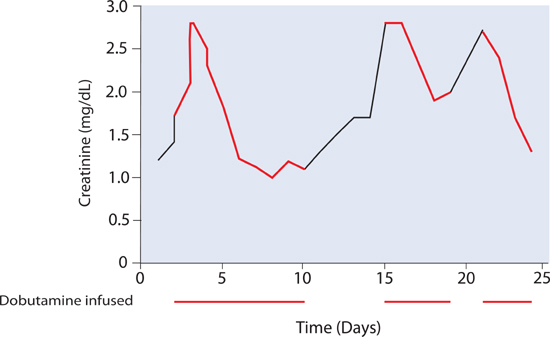
Decompensated cardiac systolic dysfunction may be associated with acute increases in serum creatinine.1,3 Positive intravenous inotropes such as dobutamine may help restore renal function for days to weeks (Figure 10.4). By itself, however, this therapy is a temporary solution, and the requirement for inotropic support may identify a patient in transition from Stage C to Stage D heart failure.
FIGURE 10.4 Example of a patient with recurrent in-hospital renal dysfunction. Infusions of dobutamine (red) improved creatinine levels. However, when the patient was not on inotropic support (black segments), worsening renal function recurred.
TARGET RATES OF FLUID REMOVAL TO PRESERVE RENAL FUNCTION
There is always a risk of worsening renal function during therapeutic fluid removal in the acute heart failure patient. Certain factors may be present at baseline and others need to be assessed after initiation of therapy (List 10.1). When risk factors are present, consider decreasing the diuretic dose or decreasing ultrafiltration fluid removal rates. Although allowing plasma refill from the extravascular space to replenish intravascular volume helps maintain renal function, other clinical factors are also important.17 These considerations may be offset by the need to treat initial volume overload aggressively to avert acute life threatening complications including respiratory failure requiring mechanical ventilation. In high-risk patients, temporary inotropic support may blunt the potential for fluid removal therapy to worsen renal function. As noted above, in the presence of a high initial central venous pressure, therapy that leads to decongestion and lowers CVP alone may lead to improved renal function.18 If renal function worsens despite persistent congestion, reassessing the patient’s circulatory status with right heart catheterization may be useful.
< div class='tao-gold-member'>


