Sinus bradycardia may be more significant in older patients than in a younger group because it could signal important or advanced conduction system and/or cardiac disease potentially modifiable with pacemaker implantation. We evaluated the clinical need for subsequent pacemaker implantation and mortality rate in outpatients >60 years of age with relatively asymptomatic bradycardia (heart rate <55 beats/min without a subsequent pacemaker implantation within 2 weeks) or not (heart rate 60 to 70 beats/min). The 2 groups were matched against pacemaker implantation and death records but without data on indication or cause. Kaplan–Meier survival curves and univariate and multivariable models examined pacemaker implantation and all-cause mortality. The cohort consisted of 470 patients with and 2,090 without asymptomatic bradycardia. Mean follow-up period was 7.2 ± 2.9 years during which 137 patients (5.4%) underwent pacemaker implantation and 748 (29.2%) died. Incidence of pacemaker placement was higher in the bradycardia cohort (9% vs 5%, p <0.001). The higher incidence of pacemaker implantation did not appear in the first 4 years. Univariate analysis showed no increase in mortality in the bradycardia group (hazard ratio 0.87, 95% confidence interval 0.72 to 1.04, p = 0.130), whereas multivariable analysis showed protection (hazard ratio 0.78, 95% confidence interval 0.65 to 0.94, p = 0.010). In conclusion, older patients with asymptomatic bradycardia have a very low rate of pacemaker implantation, annualized to <1% per year. Their higher rate of pacemaker implantation compared to outpatients without bradycardia shows a latency period of approximately 4 years. It has no adverse impact on all-cause mortality and may even be protective.
No studies have evaluated the clinical significance of bradycardia not requiring urgent pacemaker implantation in older outpatients with regard to the need for subsequent pacemaker implantation and its impact on all-cause mortality. The aim of this study was to evaluate the clinical need for subsequent pacemaker implantation and mortality in older outpatients with and without bradycardia.
Methods
The institutional review board of Northwestern University approved the project. This study examined all outpatients at our institution from 1990 through 1995 fulfilling the criteria below and evaluated in the internal medicine or cardiology clinic with a standard 12-lead electrocardiogram at rest. Only outpatients >60 years of age at the time of the tracing were included to limit the study to older patients. If an outpatient had multiple tracings, only the first was used.
To identify a group with relatively asymptomatic bradycardia, an electrocardiographic (ECG) database (MUSE, GE Healthcare Clinical Systems, Milwaukee, Wisconsin) identified all outpatients with a heart rate <55 beats/min at rest. Patients who underwent pacemaker implantation within 2 weeks of the index electrocardiogram were excluded, presuming that the pacemaker was implanted for symptomatic bradycardia (n = 75 excluded). To identify a control group without bradycardia, the ECG database identified all outpatients with a heart rate 60 to 70 beats/min at rest. Patients with missing Social Security numbers (n = 15) or heart rates outside these ranges were excluded.
For each outpatient, we extracted age, gender, Social Security number, date of study, and ECG variables. ECG variables were initially computed automatically and then confirmed or corrected in each case by a cardiologist: heart rate, PR and QT intervals, corrected QT interval by Bazett formula, QRS duration, QRS axis, and T-wave axis. QRS–T-wave angle was calculated as the difference between the QRS and T-wave axes. An abnormal QRS axis was defined as <−30° or >90°. An abnormal QRS-T angle was defined as >90°. In addition, presence of atrial fibrillation or flutter on the baseline tracing was noted.
Pacemaker implantation was determined from 2 sources. First, our internal institutional pacemaker database was matched against each group. Second, to identify patients who had pacemaker implantations elsewhere, we cross-referenced Social Security numbers against registration data by the 3 largest device manufacturers (Boston Scientific, Natick, Massachusetts, Medtronic, Minneapolis, Minnesota, and St. Jude Medical, St. Paul, Minnesota). Vital status was determined from the Social Security Administration Death Master File. Length of pacemaker-free survival was computed as the number of days from electrocardiography to pacemaker implantation, death, or the end of December 2001, whichever occurred first. Length of all-cause survival was computed as the number of days from electrocardiography to death or the end of December 2001, whichever occurred first.
All statistical tests were performed using R 2.12 with missing data (2.6% of 6 affected variables) imputed by multiple imputation package 0.09 to 11.03. Continuous variables are summarized as mean ± SD and were compared using t test. Binary variables are summarized as number (percentage) and were compared using chi-square or Fisher’s exact test. Bradycardia was studied as a binary group variable and using heart rate as a continuous parameter. Kaplan–Meier survival analyses used log-rank test to examine 2 different outcomes: pacemaker implantation and all-cause mortality. All applicable tests were 2-tailed and a p value <0.05 was considered statistically significant.
Univariate Cox proportional hazards models examined each variable presented in Table 1 (bradycardia, heart rate, age, male gender, atrial fibrillation or flutter, PR and corrected QT intervals, QRS width and abnormal axis, and abnormal QRS-T angle) for its impact on pacemaker implantation. Schoenfeld residuals and visual analysis of Kaplan–Meier survival curves tested the assumption of proportional hazards and found that membership in the bradycardia group and heart rate as a continuous variable violated the assumption. Therefore, a landmark analysis was performed after 4 years based on visual separation in survival curves between the bradycardic and nonbradycardic groups after this point. All univariate Cox proportional hazards models for this later period satisfied the assumption of proportional hazards. Multivariable Cox proportional hazards were built by including all univariate predictors.
| Variable | Bradycardia Group | Control Group | p Value |
|---|---|---|---|
| (n = 470) | (n = 2,090) | ||
| Age (years) | 71 ± 7 | 71 ± 7 | NS |
| Men | 293 (64%) | 883 (45%) | <0.001 |
| Heart rate (beats/min) | 50 ± 4 | 65 ± 3 | <0.001 |
| Atrial fibrillation or flutter | 11 (2%) | 80 (4%) | NS |
| PR interval (ms) | 179 ± 37 | 168 ± 30 | <0.001 |
| QRS width (ms) | 100 ± 21 | 94 ± 20 | <0.001 |
| QT interval (ms) | 461 ± 34 | 407 ± 25 | |
| Corrected QT interval (ms) | 419 ± 25 | 424 ± 25 | <0.001 |
| Abnormal QRS axis | 66 (14%) | 283 (14%) | NS |
| Abnormal QRS-T angle | 74 (16%) | 315 (16%) | NS |
| Pacemaker implantation | 40 (9%) | 97 (5%) | 0.001 |
| Death | 131 (28%) | 617 (30%) | NS |
All-cause mortality was studied using pacemaker implantation as a time-dependent variable. Univariate Cox proportional hazards models examined each variable for its impact on all-cause mortality. Schoenfeld residuals and visual analysis of Kaplan–Meier survival curves tested the assumption of proportional hazards and found no significant deviations. Given expected higher heart rates in women, we carried out exploratory multivariable models by adding an interaction term between gender and binary bradycardia or continuous heart rate. Multivariable Cox proportional hazards were built by including all univariate predictors.
Results
The cohort consisted of 2,560 patients, of whom 470 had asymptomatic bradycardia and 2,090 did not. Table 1 presents a comparison of subject characteristics and clinical events between groups. The bradycardia group consisted of 310 patients (66%) with 50 to 54 beats/min, 111 (24%) with 45 to 49 beats/min, 36 (8%) with 40 to 44 beats/min, and 13 (3%) with <40 beats/min. Heart rate was significantly higher in women than in men (63 ± 6 vs 61 ± 7, p <0.001). There were 565 patients (22%) <65 years old, 707 (28%) 65 to 69 years old, 550 (21%) 70 to 74 years old, 415 (16%) 75 to 79 years old, 212 (8%) 80 to 84 years old, 89 (3%) 85 to 89 years old, and 22 (1%) ≥90 years old. Mean follow-up period was 7.2 ± 2.9 years.
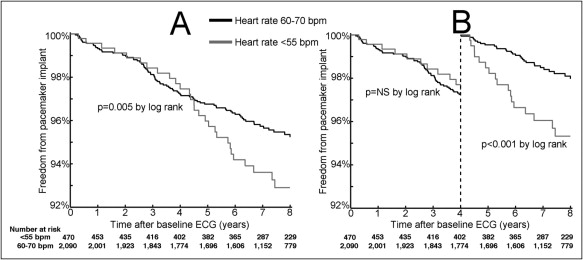
Figure 1 shows the Kaplan–Meier curve for freedom from pacemaker implantation. The higher incidence of pacemaker implantation does not appear in the first 4 years, as shown in the landmark analysis. Table 2 lists univariate and multivariable Cox models for predictors of pacemaker implantation after year 4 using bradycardia grouping. No significant interaction existed between gender and binary bradycardia (hazard ratio 0.55, 95% confidence interval [CI] 0.25 to 1.21, p = 0.14) or continuous heart rate (hazard ratio 1.03, 95% CI 0.99 to 1.09, p = 0.16) and therefore these terms were not kept in the final multivariable models. When multivariable analysis incorporated heart rate as a continuous variable rather than the binary bradycardia classification, it remained a significant predictor with a hazard ratio of 0.67 per 10 beats/min (95% CI 0.50 to 0.91, p = 0.009). Presence of atrial fibrillation or flutter (hazard ratio 2.83, p = 0.017), PR interval (hazard ratio 1.09 per 10 ms, p = 0.006), and QRS width (hazard ratio 1.18 per 10 ms, p = 0.007) also remained significant predictors.
| Variable | Univariate | Multivariable | ||||
|---|---|---|---|---|---|---|
| HR | 95% CI | p Value | HR | 95% CI | p Value | |
| Bradycardia | 2.57 | 1.60–4.13 | <0.001 | 2.14 | 1.30–3.51 | 0.003 |
| Heart rate (per 10 beats/min) | 0.61 | 0.46–0.80 | <0.001 | |||
| Age (per decade) | 1.45 | 1.05–1.98 | 0.022 | NS | ||
| Male gender | 1.91 | 1.18–3.12 | 0.009 | NS | ||
| Atrial fibrillation or flutter | 3.25 | 1.41–7.50 | 0.006 | 2.85 | 1.21–6.72 | 0.016 |
| PR interval (per 10 ms) | 1.15 | 1.08–1.21 | <0.001 | 1.09 | 1.02–1.16 | 0.007 |
| QRS width (per 10 ms) | 1.31 | 1.20–1.43 | <0.001 | 1.18 | 1.04–1.32 | 0.007 |
| Corrected QT interval (per 10 ms) | 1.12 | 1.05–1.19 | <0.001 | NS | ||
| Abnormal QRS axis | 1.78 | 0.99–3.19 | 0.055 | NS | ||
| Abnormal QRS-T angle | 1.89 | 1.07–3.34 | 0.029 | NS | ||
Stay updated, free articles. Join our Telegram channel

Full access? Get Clinical Tree


