We sought to evaluate the prognostic significance of ST-segment elevation (STE) in lead aVR in unselected patients with non-STE acute coronary syndrome (NSTE-ACS). We enrolled 1,042 consecutive patients with NSTE-ACS. Patients were divided into 5 groups according to the following electrocardiographic (ECG) patterns on admission: (1) normal electrocardiogram or no significant ST-T changes, (2) inverted T waves, (3) isolated ST deviation (ST depression [STD] without STE in lead aVR or transient STE), (4) STD plus STE in lead aVR, and (5) ECG confounders (pacing, right or left bundle branch block). The main angiographic end point was left main coronary artery (LM) disease as the culprit artery. Clinical end points were in-hospital and 1-year cardiovascular death defined as the composite of cardiac death, fatal stroke, and fatal bleeding. Prevalence of STD plus STE in lead aVR was 13.4%. Rates of culprit LM disease and in-hospital cardiovascular death were 8.1% and 3.8%, respectively. On multivariable analysis, patients with STD plus STE in lead aVR (group 4) showed an increased risk of culprit LM disease (odds ratio 4.72, 95% confidence interval [CI] 2.31 to 9.64, p <0.001) and in-hospital cardiovascular mortality (odds ratio 5.58, 95% CI 2.35 to 13.24, p <0.001) compared to patients without any ST deviation (pooled groups 1, 2, and 5), whereas patients with isolated ST deviation (group 3) did not. At 1-year follow-up 127 patients (12.2%) died from cardiovascular causes. On multivariable analysis, STD plus STE in lead aVR was a stronger independent predictor of cardiovascular death (hazard ratio 2.29, 95% CI 1.44 to 3.64, p <0.001) than isolated ST deviation (hazard ratio 1.52, 95% CI 0.98 to 2.36, p = 0.06). In conclusion, STD plus STE in lead aVR is associated with high-risk coronary lesions and predicts in-hospital and 1-year cardiovascular deaths in patients with NSTE-ACS. Therefore, this promptly available ECG pattern could be useful to improve risk stratification and management of patients with NSTE-ACS.
In recent years, it has been suggested that evaluation of lead aVR on standard electrocardiogram may improve risk stratification in patients with non–ST-segment elevation acute coronary syndrome (NSTE-ACS) because STE in lead aVR has been associated with a higher rate of left main coronary artery (LM)/3-vessel disease and worse prognosis. However, these findings have been only partly confirmed in a recent large electrocardiographic (ECG) substudy of the Global Registry of Acute Coronary Events (GRACE). Indeed, STE in lead aVR was a marker of LM/3-vessel disease (even if data on the culprit lesion were not reported), but it was not independently associated with in-hospital and 6-month mortality. However, the lower prevalence of STE in lead aVR compared to previous studies (1.5% vs >10%, respectively) may have partly influenced the results of multivariable analysis. Moreover, data regarding longer follow-up have not yet been reported. This topic is relevant because it is well known that patients with NSTE-ACS carry a persistent risk of cardiovascular mortality after discharge. Thus, the role of lead aVR in patients with NSTE-ACS still appears uncertain. Accordingly, the main objectives of the present study were to investigate (1) the predictive value of STE in lead aVR associated with ST depression (STD) in other leads (STD plus STE in lead aVR) for identifying LM disease as the culprit lesion and (2) the role of this ECG pattern in predicting in-hospital and 1-year cardiovascular death.
Methods
Patients admitted to the emergency department and/or to the coronary care unit of St. Orsola/Malpighi Hospital, Bologna University from January 1, 2006 through May 31, 2008 and receiving the initial diagnosis of NSTE-ACS were screened. Inclusion criteria were chest pain within 24 hours plus 1 of the following: (1) STD ≥0.05 mV in any lead, (2) transient (<20 minutes) significant STE in 2 contiguous leads, (3) inverted T waves ≥0.1 mV, (4) positive cardiac biomarkers, and (5) documentation of coronary artery disease.
Of 1,372 screened patients, 75 (5%) had symptom onset >24 hours, 73 (5%) had persistent STE or new-onset left bundle branch block, 45 (3%) had atypical chest pain without signs of coronary artery disease, and 81 (6%) had increased troponin associated with other clinical conditions and without overt signs of myocardial ischemia (35 patients had acute heart failure, 24 tachyarrhythmia, 8 stroke, 8 sepsis, 2 major bleeding, 2 pulmonary embolism, and 2 metastatic malignancy). Twenty-six patients (2%) had other miscellaneous diagnoses, and 30 patients (2%) lacked the qualifying electrocardiogram. Thus, the final cohort of this study included 1,042 patients.
Patients’ files referring to the qualifying episode were carefully reviewed by expert investigators. Demographic data, clinical history, risk factors for coronary artery disease, physical examination and laboratory findings, medications, and cardiac procedures were collected. The following in-hospital adverse events were also recorded: overall mortality, cardiovascular death, recurrence of myocardial infarction (MI), stroke, and bleedings. Events were adjudicated independently by 2 physicians and disagreements were resolved by consensus.
Admission electrocardiogram was collected separately and assessed by investigators blinded to clinical data, angiographic features, and outcome. The 12-lead electrocardiogram was recorded at a standard paper speed of 25 mm/s and calibration of 10 mm/mV. Standard criteria were used for the diagnosis of right bundle branch block and left bundle branch block. ST deviation was measured to the nearest 0.05 mV at 80 and 20 ms after the J point for STD and STE, respectively. STD was considered present if it was ≥0.05 mV in any lead. STE was considered present if it was ≥0.1 mV in 2 contiguous leads. Inverted T waves were considered present if the T wave was biphasic or negative and ≥0.1 mV in 2 contiguous leads. STE in lead aVR ≥0.1 mV was considered significant. Lead aVR was not used to define STD or STE. In patients with ECG confounders (right bundle branch block, left bundle branch block, or ventricular paced rhythm), ST deviation was not measured.
Angiographic data were available for all patients who underwent in-hospital coronary catheterization. All angiograms were independently reviewed by 2 experienced investigators who were blinded to all data. Controversies were resolved by consensus. Number of diseased vessels, culprit lesion, Thrombolysis In Myocardial Infarction flow grade, presence of endoluminal thrombi, and signs of plaque rupture were assessed. Stenosis ≥50% in the lumen of the LM or ≥70% in ≥1 other major epicardial vessel or main branches was considered significant. Culprit artery was defined as the most severe stenosis, presence of Thrombolysis In Myocardial Infarction grade <3 flow, or angiographic signs of endoluminal thrombi and/or plaque rupture.
The main angiographic end point was LM disease as the culprit artery. The study also assessed the association between STE in lead aVR and overall LM or LM/3-vessel disease.
The clinical study end points were cardiovascular death (i.e., composite of cardiac death, fatal stroke, and fatal bleeding) during the index hospitalization and at 1-year follow up. Cardiac death was defined as death from cardiac cause, sudden death, or any death without another known cause. In-hospital recurrence of MI was defined as recurrence of typical clinical symptoms and new ECG changes with an increase of creatine kinase-MB ≥50% of the previous level. Stroke was defined as sudden onset of a focal neurologic deficit lasting >24 hours. Major bleedings were defined as bleeding requiring transfusion or surgery, decrease in hemoglobin of >5 g/dl, and intracranial hemorrhage. Minor bleedings were defined as local hematoma and any other clinically relevant bleeding that did not meet criteria for severity.
Out-of-hospital data concerning vital status of patients and cause of death were obtained by telephone interviews or independently from the Emilia-Romagna Regional Health Agency through analysis of hospital discharge records and municipal civil registries, thus relying on the treating physicians’ diagnoses. One-year follow-up was available for 1,024 patients (98.3%).
Categorical data are expressed as proportions and continuous variables reported as medians and interquartile ranges (twenty-fifth to seventy-fifth percentiles). Patients were divided into 5 groups according to the following ECG patterns: (1) normal electrocardiogram or no significant ST-T change, (2) inverted T waves, (3) isolated ST deviation (i.e., STD without STE in lead aVR or transient STE), (4) STD plus STE in lead aVR, and (5) ECG confounders. For comparisons among groups, Kruskal–Wallis test was used for continuous variables and chi-square test for categorical variables. Multivariable logistic regression analysis was used to identify predictors of LM or LM/3-vessel disease and in-hospital cardiovascular death. The following variables were selected: age, gender, diabetes, smoking status, hypertension, previous stroke, previous MI, previous coronary bypass, previous percutaneous coronary intervention, peripheral artery disease, systolic blood pressure and heart rate on admission, Killip class, cardiac arrest, troponin level, atrial fibrillation on admission, creatinine, and ECG patterns. Three multivariable models were constructed including ECG variables as follows: model 1, any ST-segment deviation (pooled groups 3 and 4) versus no ST-segment deviation (pooled groups 1, 2, and 5); model 2, isolated ST deviation (group 3) or STD plus STE in lead aVR (group 4) versus no ST deviation (pooled groups 1, 2, and 5); model 3, isolated ST deviation (group 3) or STD plus STE in lead aVR (group 4) versus no ST deviation (pooled groups 1 and 2); patients belonging to the fifth group were excluded. The discriminative power of the models was assessed by the mean of the area under the receiver operating characteristic curve (c-statistic).
Kaplan–Meier method was used to analyze the occurrence of events during follow-up and ECG patterns were compared by log-rank Cox-Mantel test. Patients were censored at the time of the last contact.
Multivariable Cox regression analysis was performed to identify predictors of 1-year cardiovascular death. Proportional hazard assumption was checked by “log-minus-log” plotting. To adjust for possible confounding factors, all described variables plus bypass during the index hospitalization were included in multivariable models. A p value <0.05 in 2-tailed tests was considered statistically significant. All analyses were performed with SPSS 15.0 (SPSS, Inc., Chicago, Illinois).
Results
Baseline clinical and laboratory findings and in-hospital management are listed in Table 1 . The median (interquartile range) age of the study population was 76 years (67 to 83), and 669 patients (64%) were men. Overall, 889 patients (85%) had NSTEMI and 153 (15%) unstable angina. Prevalences of study ECG patterns were (1) 28% for normal or no significant ST-T changes (normal electrocardiogram, n = 105; no significant ST-T changes, n = 189), (2) 17% for inverted T waves (n = 172), (3) 27% for isolated ST deviation (isolated STD, n = 248; transient STE, n = 38), (4) 13% for STD plus STE in lead aVR (n = 140), and (5) 15% for ECG confounders (right bundle branch block, n = 61; left bundle branch block, n = 73; pacing, n = 22). As presented in Table 1 , patients with STD plus STE in lead aVR were more likely to have peripheral artery disease, atrial fibrillation, higher heart rate, more advanced Killip class, positive cardiac biomarkers, and higher GRACE risk score on admission than other groups. In contrast, patients with ECG confounders were older, more likely to have previous MI, but less likely to receive clopidogrel treatment and undergo coronary angiography compared to the remaining study population.
| Variable | Normal Electrocardiogram or No Significant ST-T Changes (pattern 1) (n = 294) | Inverted T Waves (pattern 2) (n = 172) | Isolated ST Deviation (pattern 3) (n = 280) | STD + STE in Lead aVR (pattern 4) (n = 140) | ECG Confounders (pattern 5) (n = 156) | p Value |
|---|---|---|---|---|---|---|
| Age (years) | 73 (63–79) | 76 (66–82) | 75 (65–81) | 76 (70–84) | 81 (74–85) | <0.001 |
| Men | 190 (65%) | 106 (62%) | 190 (68%) | 87 (62%) | 96 (62%) | 0.58 |
| Previous myocardial infarction | 103 (35%) | 56 (33%) | 107 (38%) | 45 (32%) | 91 (58%) | <0.001 |
| Previous percutaneous coronary intervention | 78 (27%) | 32 (19%) | 67 (24%) | 27 (19%) | 41 (26%) | 0.21 |
| Previous coronary bypass | 24 (8%) | 12 (7%) | 26 (9%) | 18 (13%) | 22 (14%) | 0.12 |
| Previous stroke | 25 (9%) | 16 (9%) | 30 (11%) | 17 (12%) | 25 (16%) | 0.15 |
| Peripheral artery disease | 52 (18%) | 21 (12%) | 55 (20%) | 43 (31%) | 39 (25%) | 0.001 |
| Diabetes mellitus | 75 (26%) | 29 (17%) | 84 (30%) | 30 (21%) | 46 (30%) | 0.02 |
| Hypercholesterolemia ⁎ | 182 (62%) | 98 (57%) | 154 (55%) | 70 (50%) | 87 (56%) | 0.19 |
| Hypertension † | 222 (76%) | 137 (80%) | 223 (80%) | 113 (81%) | 136 (87%) | 0.07 |
| Smoker | 145 (49%) | 65 (38%) | 132 (47%) | 55 (39%) | 56 (36%) | 0.01 |
| Presenting characteristics | ||||||
| Systolic blood pressure (mm Hg) | 144 (130–160) | 140 (125–160) | 140 (125–160) | 140 (120–160) | 140 (125–170) | 0.07 |
| Heart rate (beats/min) | 77 (63–90) | 77 (65–90) | 81 (68–99) | 90 (79–109) | 87 (73–107) | <0.001 |
| Cardiac arrest | 2 (1%) | 0 | 4 (1%) | 3 (2%) | 1 (1%) | 0.31 |
| Atrial fibrillation | 25 (9%) | 12 (7%) | 28 (10%) | 25 (18%) | 23 (15%) | 0.007 |
| Killip class | <0.001 | |||||
| I | 237 (81%) | 121 (70%) | 192 (69%) | 82 (59%) | 85 (55%) | |
| II | 29 (10%) | 31 (18%) | 47 (17%) | 24 (17%) | 41 (26%) | |
| III | 26 (9%) | 19 (11%) | 39 (14%) | 29 (21%) | 30 (19%) | |
| IV | 2 (1%) | 1 (1%) | 2 (1%) | 5 (4%) | 0 | |
| Laboratory findings | ||||||
| Troponin T (ng/ml) | 0.16 (0.06–0.36) | 0.13 (0.05–0.34) | 0.15 (0.06–0.51) | 0.38 (0.14–1.19) | 0.17 (0.07–0.48) | <0.001 |
| Peak creatine kinase-MB (U/L) | 15 (1–46) | 1 (1–32) | 21 (1–51) | 42 (1–96) | 22 (1–61) | <0.001 |
| Creatinine (mg/dl) | 1.2 (1.0–1.4) | 1.2 (0.9–1.5) | 1.2 (1.0–1.5) | 1.3 (1.1–1.5) | 1.3 (1.1–1.7) | <0.001 |
| GRACE risk score (25th to 75th) | 123 (98–146) | 132 (109–158) | 163 (141–191) | 181 (159–210) | 155 (135–175) | <0.001 |
| Medical treatment within 24 hours | ||||||
| Aspirin | 269 (92%) | 151 (88%) | 255 (91%) | 121 (86%) | 138 (89%) | 0.39 |
| Thienopyridine | 0.009 | |||||
| Clopidogrel | 192 (65%) | 106 (62%) | 170 (61%) | 74 (53%) | 73 (47%) | |
| Ticlopidine | 23 (8%) | 14 (8%) | 18 (6%) | 13 (9%) | 12 (8%) | |
| β Blockers | 246 (84%) | 147 (86%) | 234 (84%) | 113 (81%) | 116 (74%) | 0.06 |
| Angiotensin-converting enzyme inhibitor/angiotensin receptor blocker | 219 (75%) | 130 (76%) | 204 (73%) | 91 (65%) | 113 (72%) | 0.25 |
| Unfractionated heparin/low-molecular-weight heparin | 256 (87%) | 149 (87%) | 241 (86%) | 117 (84%) | 121 (78%) | 0.075 |
| Glycoprotein IIb/IIIa inhibitors | 111 (38%) | 54 (31%) | 96 (34%) | 50 (36%) | 34 (22%) | 0.013 |
| Invasive management ‡ | 221 (75%) | 123 (72%) | 192 (69%) | 103 (74%) | 87 (56%) | 0.001 |
| Coronary angiography | 237 (81%) | 129 (75%) | 210 (75%) | 104 (74%) | 91 (58%) | <0.001 |
| Percutaneous coronary intervention | 156 (66%) | 88 (68%) | 153 (73%) | 71 (68%) | 59 (65%) | 0.53 |
| Coronary bypass | 12 (5%) | 6 (5%) | 17 (8%) | 19 (18%) | 4 (4%) | <0.001 |
⁎ Patients taking lifestyle-modification or drug therapy for treatment of known hypercholesterolemia or total cholesterol level ≥200 mg/dl or low-density lipoprotein level ≥130 mg/dl on admission.
† Patients taking lifestyle-modification or drug therapy for treatment of known hypertension.
‡ Patients undergoing diagnostic catheterization without additional risk-stratification procedures.
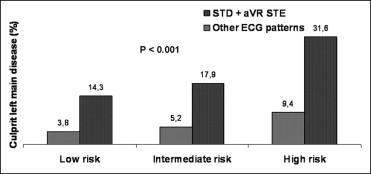
Overall, 771 patients (74%) underwent coronary angiography before discharge. Prevalences of LM disease, LM/3-vessel disease, and distribution of the culprit artery in the study groups are listed in Table 2 . Patients with STD plus STE in lead aVR showed the highest rate of LM or LM/3-vessel disease and were treated more often with coronary bypass. As presented in Figure 1 , for each GRACE risk score tertile, patients with STD plus STE in lead aVR had a higher rate of culprit LM disease compared to patients with no STD plus STE in lead aVR.
| Variable | Normal Electrocardiogram or No Significant ST-T Changes (pattern 1) (n = 220) | Inverted T Waves (pattern 2) (n = 123) | Isolated ST Deviation (pattern 3) (n = 188) | STD + STE in Lead aVR (pattern 4) (n = 92) | ECG Confounders (pattern 5) (n = 78) | p Value |
|---|---|---|---|---|---|---|
| Left main coronary artery disease | 11 (5%) | 5 (4%) | 17 (9%) | 27 (29%) | 10 (13%) | <0.001 |
| 3-Vessel disease | 27 (12%) | 26 (21%) | 45 (24%) | 40 (44%) | 16 (21%) | <0.001 |
| Left main coronary artery/3-vessel disease | 34 (16%) | 27 (22%) | 53 (28%) | 52 (57%) | 21 (27%) | <0.001 |
| Culprit coronary artery | <0.001 | |||||
| 0 | 42 (19%) | 20 (16%) | 21 (11%) | 3 (3%) | 10 (13%) | |
| Left anterior descending | 63 (29%) | 59 (48%) | 66 (35%) | 28 (30%) | 28 (36%) | |
| Left circumflex | 30 (14%) | 5 (4%) | 33 (18%) | 9 (10%) | 8 (10%) | |
| Right | 41 (19%) | 21 (17%) | 28 (15%) | 14 (15%) | 12 (15%) | |
| Diagonal branches | 16 (7%) | 6 (5%) | 9 (5%) | 2 (2%) | 7 (9%) | |
| Obtuse marginal branches | 19 (9%) | 8 (7%) | 20 (11%) | 12 (13%) | 4 (5%) | |
| Left main | 9 (4%) | 4 (3%) | 11 (6%) | 24 (26%) | 9 (12%) |
On multivariable analysis ( Table 3 ), model 1 showed that patients with any ST deviation had an increased risk of culprit LM disease compared to patients without ST deviation. Models 2 and 3 showed that in patients with ST deviation, only those with STD plus STE in lead aVR had an increased risk of culprit LM disease, whereas those with isolated ST deviation did not. STD plus STE in lead aVR was also independently associated with an increased risk of overall LM disease (adjusted odds ratio [OR] 3.82, 95% confidence interval [CI] 2.04 to 7.17, p <0.001) and LM/3-vessel disease (adjusted OR 4.90, 95% CI 2.89 to 8.32, p <0.001).
| Variable | Model 1 | Model 2 | Model 3 † | |||
|---|---|---|---|---|---|---|
| OR (95% CI) | p Value | OR (95% CI) | p Value | OR (95% CI) | p Value | |
| Age, each incremental year | 1.04 (1.00–1.07) | 0.027 | 1.03 (1.00–1.06) | 0.041 | 1.03 (0.99–1.06) | 0.14 |
| Male gender | 2.28 (1.15–4.53) | 0.019 | 2.25 (1.11–4.58) | 0.024 | 1.84 (0.86–3.93) | 0.12 |
| ST deviation | 2.11 (1.17–3.80) | 0.004 | not included | — | not included | — |
| Electrocardiographic patterns | not included | — | <0.001 | <0.001 | ||
| No ST deviation | — | — | reference | reference | ||
| Isolated ST deviation | — | — | 1.11 (0.52–2.38) | 0.79 | 1.46 (0.63–3.40) | 0.37 |
| ST depression + ST elevation in lead aVR | — | — | 4.72 (2.31–9.64) | <0.001 | 5.94 (2.69–13.28) | <0.001 |
| c-Statistic | 0.760 | 0.787 | 0.792 | |||
⁎ Patients with previous coronary bypass excluded.
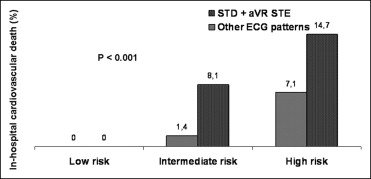
During hospitalization, 45 patients (4.3%) died with 40 (3.8%) having a cardiovascular death (cardiac death, n = 37; fatal stroke, n = 1; fatal bleeding, n = 2). Of patients who underwent coronary angiography, in-hospital cardiovascular mortality rate was higher in subjects whose culprit vessel was the LM (14.0% vs 1.3%, p <0.001) or disclosed LM/3-vessel disease (6.3% vs 0.5%, p <0.001). As presented in Figure 2 , patients with STD plus STE in lead aVR had a significantly higher rate of in-hospital cardiovascular death compared to patients with no STD plus STE in lead aVR in the intermediate and high GRACE risk score groups. On multivariable analysis ( Table 4 ), patients with any ST deviation had an increased risk of in-hospital cardiovascular death compared to patients without ST deviation (model 1). However, in patients with ST deviation, only those with STD plus STE in lead aVR had an increased risk of cardiovascular death, whereas those with isolated ST deviation did not.
| Variable | Model 1 | Model 2 | Model 3 ⁎ | |||
|---|---|---|---|---|---|---|
| OR (95% CI) | p Value | OR (95% CI) | p Value | OR (95% CI) | p Value | |
| Age, each incremental year | 1.08 (1.03–1.13) | 0.002 | 1.08 (1.03–1.13) | 0.001 | 1.06 (1.01–1.12) | 0.016 |
| Systolic blood pressure (mm Hg) | 0.98 (0.97–0.99) | 0.005 | 0.98 (0.97–0.99) | 0.013 | 0.98 (0.97–0.99) | 0.008 |
| Heart rate (beats/min) | 1.02 (1.01–1.02) | 0.019 | 1.02 (1.01–1.03) | 0.036 | 1.01 (0.99–1.03) | 0.22 |
| Killip class | 0.07 | 0.07 | 0.05 | |||
| I | reference | reference | reference | |||
| II | 1.71 (0.66–4.40) | 0.26 | 1.81 (0.69–4.68) | 0.22 | 1.43 (0.47–4.29) | 0.52 |
| III and IV | 2.85 (1.21–6.74) | 0.019 | 2.74 (1.15–6.54) | 0.023 | 3.05 (1.21–7.67) | 0.018 |
| Cardiac arrest | 8.74 (1.69–45.25) | 0.01 | 9.67 (1.90–48.91) | 0.006 | 5.65 (0.94–34.06) | 0.059 |
| ST deviation | 2.98 (1.40–6.32) | 0.004 | not included | — | not included | — |
| Electrocardiographic patterns | not included | — | <0.001 | <0.002 | ||
| No ST deviation | — | — | reference | reference | ||
| Isolated ST deviation | — | — | 1.93 (0.77–4.85) | 0.16 | 2.10 (0.72–6.21) | 0.16 |
| ST depression + ST elevation in lead aVR | — | — | 5.58 (2.35–13.24) | <0.001 | 5.99 (2.14–16.79) | 0.001 |
| c-Statistic | 0.878 | 0.886 | 0.897 | |||
Stay updated, free articles. Join our Telegram channel

Full access? Get Clinical Tree


