Morphologic changes after chronic total occlusion (CTO) treatment with drug-eluting stents (DESs) have not been assessed in detail. Our aim was to use both baseline and follow-up intravascular ultrasound studies to evaluate the morphologic changes and, especially, the changes in distal vessel size and the effect of subintimal stenting after treatment of CTOs with DES. We analyzed serial follow-up intravascular ultrasound (baseline and follow-up at 9 ± 2 months) after DES implantation into 40 CTOs. Overall, 33 CTOs were treated by the anterograde approach; and 7 were treated by the retrograde approach. Minimum lumen cross-sectional area (CSA) trended toward a decrease from baseline to follow-up (4.8 ± 1.7 vs 4.5 ± 1.7 mm 2 , p = 0.10), although the minimum stent CSA (4.8 ± 1.7 vs 4.9 ± 1.7 mm 2 , p = 0.26) did not change. The distal reference, but not the proximal reference lumen CSA, increased significantly at follow-up (3.8 ± 2.0 to 5.1 ± 2.3 mm 2 , p = 0.0004). Late-acquired stent malapposition was seen in 17 patients (42.5%). In 8 CTOs (20%), a part of the stent was implanted into a subintimal space; in these 8 patients, maximum percent neointimal hyperplasia and minimum lumen area was similar in the subintimal segment compared with the adjacent intraplaque segment. The frequency of late-acquired stent malapposition was similar. In conclusion, after CTO treatment with DES, distal vessel enlargement was detected. Subintimal stenting after recanalization of CTO was not inferior compared with stenting within the plaque in terms of long-term morphologic impact.
Previous studies have reported that successful percutaneous revascularization of a chronic total occlusion (CTO) is associated with better long-term mortality compared with patients in whom the procedure was not successful. Current success rates have improved because of the development of techniques such as controlled antegrade and retrograde tracking (CART), reverse CART, and subintimal tracking and reentry (STAR) ; however, morphologic changes after successful CTO recanalization, especially after drug-eluting stent (DES) implantation, have not been assessed in detail including whether subintimal stenting is deleterious and what is the appropriate stent sizing when the distal segment may be smaller than expected due to long-term reduced flow and negative remodeling. The aims of this study were to examine both baseline and follow-up intravascular ultrasound (IVUS) studies after successful treatment of CTO lesions with DES implantation to evaluate long-term morphologic changes—especially the effect of subintimal stenting and changes of vessel size that occur with increased anterograde flow.
Methods
We analyzed 40 serial IVUS studies (baseline and follow-up at 9 ± 2 months) after DES implantation into de novo (not previously stented) CTOs. All lesions were treated by a single interventional cardiologist (MO) at the Showa University Northern Yokohama Hospital (Yokohama, Japan) from November 2004 to March 2012. The indications for follow-up IVUS studies were clinical symptoms or at the operator’s discretion. A CTO was defined as an obstruction of a native coronary artery with no luminal continuity and with Thrombolysis In Myocardial Infarction 0 for >3 months. Patients treated using bare-metal stents, lesions that represented reocclusion, or a total occlusion related to an acute coronary syndrome were excluded.
Patient demographics were confirmed by hospital review. Coronary risk factors included diabetes mellitus (diet controlled, oral agent, or insulin treated), hypertension (medication-treated only), hypercholesterolemia (medication treated or total cholesterol >240 mg/dl), cigarette smoking, and family history of coronary artery disease.
Baseline and follow-up cine angiograms were analyzed with a computer-assisted, automated edge-detection algorithm (QCA-CMS; Medis medical imaging systems bv, Leiden, the Netherlands) by independent experienced observers (TD and NK) blinded to clinical and IVUS data. The length of the occlusion was measured during simultaneous anterograde and retrograde injection of contrast or only anterograde injection of contrast after guidewire crossing and predilation. Collateral flow was graded according to Rentrop classification. Angiographic analysis included Thrombolysis In Myocardial Infarction flow, minimum lumen diameter, reference vessel diameter, and diameter stenosis and was done using conventional methods. Restenosis patterns were categorized as gap, margin, focal, multifocal, diffuse, proliferative, and total occlusion. Moderate calcification was defined as densities noted only with cardiac motion before contrast injection; severe calcification was defined as radioopacities noted without cardiac motion before contrast.
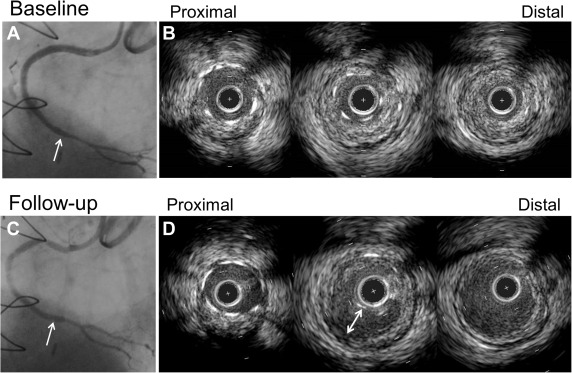
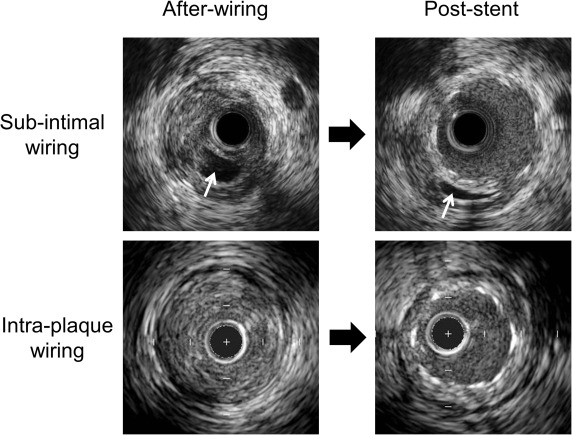
IVUS was performed after recanalization with a guidewire or after predilation using commercially available IVUS systems (Boston Scientific Corp., Natick, Massachusetts; Volcano Therapeutics Inc., Rancho Cordova, California). The IVUS catheter was advanced at least 5 mm beyond the CTO segment, and an imaging run was performed using either automatic pullback at a speed of 0.5 or 1.0 mm/s (n = 18) or using manual pullback. IVUS images were recorded onto digital media for offline analysis. All baseline and follow-up studies were reviewed side-by-side. Qualitative and quantitative IVUS analyses were performed by independent experienced observers (SS and AM) according to the American College of Cardiology Clinical Expert Consensus Document on Standards for Acquisition, Measurement, and Reporting of Intravascular Ultrasound studies. Using planimetry software (echoPlaque; INDEC Systems Inc., Santa Clara, California), quantitative IVUS analysis was performed within the CTO and the proximal and distal 5 mm reference segments every 1 mm to include: external elastic membrane (EEM), lumen, plaque and media (EEM minus lumen), and stent cross-sectional area (CSA); plaque burden (plaque and media divided by EEM); and neointimal hyperplasia CSA. Maximum plaque thickness at the distal reference was analyzed; significant thickening was defined as a maximum plaque thickness ≥0.5 mm. Lengths were calculated from the pullback speed and duration. Volumes were calculated using Simpson’s rule and reported as total and normalized volumes (volume divided by analysis length). Malapposition was defined as a separation of stent struts from the luminal border with the presence of blood between the struts and the plaque. Late-acquired stent malapposition (LASM) was present at follow-up but was not present at baseline, and persistent malapposition was visible both at baseline and at follow-up ( Figure 1 ). Stent fracture was defined as an absence of struts >120° within the stent. Tissue protrusion was defined as visible tissue on the luminal side of the stent and adherent to the stent struts after implantation and considered persistent if it remained at follow-up. A subintimal space was an echo-free space outside the intima without a 3-layer appearance ( Figure 2 ).
Statistical analysis was performed with StatView 5.0 (SAS Institute Inc., Cary, North Carolina). Continuous data were reported as mean ± SD and compared using paired t tests if normally distributed. Otherwise, nonparametric data were reported as median and interquartile range and compared with the Mann–Whitney U test and Wilcoxon signed-rank test. Multivariate linear regression was performed to identify the independent predictors for changes of lumen CSA from baseline to follow-up at distal reference. A p value of <0.05 was considered statistically significant.
Results
There were 40 CTO lesions in 40 patients. Patient and procedural characteristics are listed in Table 1 . Overall, 90% of the patients were men, 83% of lesions were treated through an anterograde approach, and 50% of the CTO occlusion duration was <12 months. Nine sirolimus-eluting stents, 8 paclitaxel-eluting stents, and 23 everolimus-eluting stents were used. Two patients (5%) had a failed previous CTO attempt.
| Variable | |
|---|---|
| Age (years) | 62 ± 8 |
| Men | 36 (90%) |
| Hypertension | 20 (50%) |
| Diabetes | 13 (32.5%) |
| Hypercholesterolemia | 18 (45%) |
| Cigarette smoking | 15 (38%) |
| Family history of coronary artery disease | 17 (43%) |
| Prior percutaneous coronary intervention | 22 (55%) |
| Prior coronary artery bypass grafting | 2 (5%) |
| Canadian Cardiovascular Society angina class ≥II | 13 (33%) |
| Medication | |
| Aspirin continued until follow-up | 39 (98%) |
| Thienopyridine continued until follow-up | 38 (95%) |
| Statin use at the time of discharge of procedure | 18 (45%) |
| Expected occlusion duration | |
| <12 months | 20 (50%) |
| ≥12 months | 6 (15%) |
| Unknown | 14 (35%) |
| Reattempt for chronic total occlusion treatment | 2 (5%) |
| Antegrade approach | 33 (83%) |
| Type of drug-eluting stent implanted | |
| Paclitaxel-eluting stent | 8 (20%) |
| Sirolimus-eluting stent | 9 (22%) |
| Everolimus-eluting stent | 23 (58%) |
Nineteen lesions were in the right coronary artery (RCA), 10 lesions were in the left anterior descending coronary artery (LAD), and 11 lesions were in the left circumflex coronary artery ( Table 2 ). The occlusion length measured 17.0 ± 14.6 mm. Only 2 (5%) had severe calcification. The minimum lumen diameter decreased from poststent implantation to follow-up (2.25 ± 0.48 vs 1.80 ± 0.70 mm, p <0.0001). At follow-up, although the distal reference vessel diameter increased from baseline to follow-up (from 1.91 ± 0.66 to 2.14 ± 0.67 mm, p = 0.02), the proximal reference vessel diameter decreased (from 3.30 ± 0.79 to 3.01 ± 0.75 mm, p = 0.02). Overall, 27.5% (11 of 40) developed angiographic restenosis defined as diameter stenosis ≥50%; 27.3% (3 of 11) were focal in the body, 18.2% (2 of 11) were multifocal, 18.2% (2 of 11) were focal at the margin, 18.2% (2 of 11) were focal at a gap, 1 was proliferative, and 1 was a total occlusion.
| Variable | Baseline | Follow-up | p Value |
|---|---|---|---|
| Coronary location of chronic total occlusion | |||
| Right | 19 (48%) | ||
| Left anterior descending | 10 (25%) | ||
| Left circumflex | 11 (28%) | ||
| Occlusion length (mm) | 17.0 ± 14.6 | ||
| Rentrop’s grade classification of collaterals | |||
| 1 | 3 (7.5%) | ||
| 2 | 2 (5%) | ||
| 3 | 34 (85%) | ||
| Not evaluable | 1 (2.5%) | ||
| Calcium | |||
| Moderate | 9 (23%) | ||
| Severe | 2 (5%) | ||
| Stump morphology | |||
| Abrupt | 9 (23%) | ||
| Tapered | 31 (77%) | ||
| Side brunch arising from stump | 16 (40%) | ||
| Quantitative coronary angiography findings baseline final and follow-up | |||
| Thrombolysis in Myocardial Infarction flow 3 | 39 (98%) | 40 (100%) | 0.32 |
| Proximal reference vessel diameter (mm) | 3.30 ± 0.79 | 3.01 ± 0.75 | 0.02 |
| Distal reference vessel diameter (mm) | 1.91 ± 0.66 | 2.14 ± 0.67 | 0.02 |
| Minimum lumen diameter in stent (mm) | 2.25 ± 0.48 | 1.80 ± 0.70 | <0.0001 |
| Diameter stenosis in stent (%) | 16.3 ± 9.5 | 35.2 ± 22.9 | <0.0001 |
| Binary restenosis | 18 (45%) | ||
Minimum lumen CSA trended toward a decrease from baseline to follow-up (4.8 ± 1.7 vs 4.5 ± 1.7 mm 2 , p = 0.10), although there was no change in minimum stent CSA from baseline to follow-up ( Table 3 ). At follow-up, minimum lumen CSA sites were located at the minimum stent area site in 53%.
| Variable | Baseline | Follow-up | p Value |
|---|---|---|---|
| Planar analysis in 40 lesions | |||
| Minimum lumen CSA (mm 2 ) | 4.8 ± 1.7 | 4.9 ± 1.9 | 0.13 |
| Minimum stent CSA (mm 2 ) | 4.8 ± 1.7 | 4.9 ± 1.7 | 0.26 |
| EEM CSA at MLA site (mm 2 ) | 11.6 ± 6.4 | 12.4 ± 6.6 | 0.01 |
| Maximum NIH CSA (%) | 26.0 ± 19.0 | ||
| Proximal reference | |||
| Smallest lumen (mm 2 ) | 6.5 ± 3.0 | 6.1 ± 2.7 | 0.63 |
| EEM CSA at the smallest lumen (mm 2 ) | 15.3 ± 4.2 | 15.2 ± 6.2 | 0.28 |
| P+M CSA at the smallest lumen (mm 2 ) | 8.8 ± 3.0 | 9.4 ± 5.4 | 0.58 |
| Maximum lumen CSA (mm 2 ) | 9.4 ± 3.8 | 8.9 ± 3.6 | 0.59 |
| Distal reference | |||
| Smallest lumen (mm 2 ) | 3.8 ± 2.0 | 5.1 ± 2.3 | 0.0004 |
| EEM CSA at the smallest lumen (mm 2 ) | 8.4 ± 5.7 | 9.3 ± 5.2 | 0.005 |
| P+M CSA at the smallest lumen (mm 2 ) | 4.5 ± 4.1 | 4.2 ± 3.4 | 0.79 |
| Maximum lumen CSA (mm 2 ) | 5.0 ± 2.2 | 6.8 ± 3.1 | 0.001 |
| Volumetric analysis in 18 lesions | |||
| Stent segment | |||
| Stent length (mm) | 40.5 ± 21.4 | 40.2 ± 21.6 | 0.21 |
| Mean lumen CSA (mm 3 /mm) | 6.4 ± 1.8 | 6.3 ± 2.2 | 0.76 |
| Mean stent CSA (mm 3 /mm) | 6.3 ± 1.8 | 6.5 ± 2.0 | 0.10 |
| Mean EEM CSA (mm 3 /mm) | 13.5 ± 4.1 | 14.5 ± 4.8 | 0.01 |
| NIH (%) | 6.5 ± 13.0 | ||
| Proximal reference | |||
| Mean lumen CSA (mm 3 /mm) | 7.2 ± 2.5 | 7.5 ± 3.2 | 0.60 |
| Mean EEM CSA (mm 3 /mm) | 15.4 ± 4.1 | 15.6 ± 4.1 | 0.66 |
| Mean P+M CSA (mm 3 /mm) | 8.2 ± 2.8 | 8.1 ± 3.5 | 0.95 |
| Distal reference | |||
| Mean lumen CSA (mm 3 /mm) | 4.4 ± 1.8 | 5.8 ± 2.6 | 0.009 |
| Mean EEM CSA (mm 3 /mm) | 8.7 ± 4.0 | 10.3 ± 5.0 | 0.06 |
| Mean P+M CSA (mm 3 /mm) | 4.4 ± 2.9 | 4.4 ± 2.7 | 0.84 |
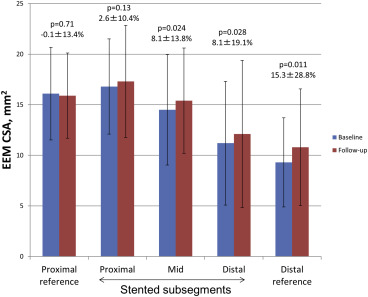
Stent segments were divided into proximal, middle, and distal subsegments ( Figure 3 ). The EEM CSA in the proximal stent subsegment showed no change from baseline to follow-up, but the EEM CSA in the mid and distal stent subsegments increased from baseline to follow-up.
There were 20 (50%) stent malappositions at follow-up. Seventeen of 20 malappositions (85%) were LASM ( Figure 1 ), and 3 (15%) were persistent. Of the 17 LASM, 35.3% (6 of 17) were located in the proximal part of the stent, 35.3% (6 of 17) were located in the mid part of the stent, and 29.4% (5 of 17) were located in the distal part of stent; all 5 LASM in the distal part of stent were observed in non-LAD lesions. Four stent fractures (in 3 lesions, 7.5%) and 2 persistent tissue protrusions (5%) were seen at follow-up.
Postprocedural IVUS showed that stents were implanted into a subintimal space in 8 patients (20%); in 3 of them, the true lumen could still be identified behind the stent at follow-up. In the 8 lesions with subintimal stenting, subintimal segments were located at the proximal edge of the CTO in 37%, at the distal edge in 25%, and in the body of the CTO in 38%. The incidence of LASM, the changes in EEM CSA, and maximum percent neointimal hyperplasia did not differ in between subintimal stented subsegments and adjacent segments in which the stent was located within the plaque ( Table 4 ).


