The initial enthusiasm caused by the potent antirestenotic effect of early generation drug-eluting stents was recently plagued by concerns regarding their safety profile. Investigators worldwide were stimulated, therefore, to seek for improvement in drug-eluting stent technology, such as eliminating their permanent polymer blamed for vascular inflammation and delayed healing. Optical coherence tomography (OCT) assessments of stent-vessel interactions are used as a surrogate for vessel healing after DES implantation. Herewith, we report serial OCT assessments of vascular reactions to the implantation of a novel absorbable polymer sirolimus-eluting stent (MiStent). In total, 30 patients were included. At 4-, 6-, and 8-month follow-up, different groups of 10 patients underwent OCT imaging, whereas all the patients had OCT assessments scheduled at 18-month follow-up. A total of 13,569 stent struts were analyzed. Low rates of uncovered (14.34 ± 15.35%, 6.62 ± 10.93%, 3.51 ± 2.87%, and 0.84 ± 1.15%, respectively, p <0.05 for 8- vs 18-month follow-up) and malapposed (3.74 ± 7.35%, 3.15 ± 6.13%, 0.48 ± 0.56%, and 0.09 ± 0.28%, respectively, p = NS) stent struts coupled with thin and increasingly homogenous neointimal proliferation were demonstrated. Neointimal area increased from 4- to 8-month follow-up (0.46 ± 0.29 and 1.12 ± 0.73 mm 2 , respectively, p <0.05), whereas no “late catch up” was demonstrated at 18-month follow-up (1.28 ± 0.66 mm 2 , p = NS vs 8-month follow-up). Early tissue maturation and reduction of low signal intensity tissue covering stent struts (8.8%, 3.1%, 0.3%, and 0%, respectively, p <0.05 for 4- vs 8-month follow-up comparison) were revealed by optical density analysis. In addition, high rates of strut coverage overlying the ostia of side branches without proliferative pattern were demonstrated. In conclusion, this comprehensive OCT analysis depicted favorable absorbable polymer sirolimus-eluting stent–vessel interactions up to 18-month follow-up.
Pathologic investigations suggested that delayed healing, characterized by inflammatory infiltrate and fibrin deposition in vessels treated with drug-eluting stents (DES), is associated with an increased risk of stent thrombosis ; therefore, substantial efforts have been devoted to increase DES safety while preserving its antiproliferative efficacy. Intravascular optical coherence tomography (OCT) assessments of stent-vessel interactions have been used in vivo as surrogate end points to evaluate the healing process after DES implantation. The novel absorbable polymer sirolimus-eluting stent (APSES) composed of thin (64 μm) cobalt-chromium struts (MiStent Sirolimus-Eluting Absorbable Polymer Coronary Stent System; Micell Technologies, Durham, North Carolina) was developed with the goal of reconciling antiproliferative efficacy and safety. The DESSOLVE I (DES with Sirolimus and a Bioabsorbable Polymer for the Treatment of Patients with De Novo Lesion in the Native Coronary Arteries) trial was the first-in-human study evaluating this APSES platform. Herewith, we report the comprehensive analysis of serial OCT images obtained at 4-, 6-, 8-, and 18-month follow-up after the initial experience with APSES implantation in humans.
Methods
The APSES has been previously described. The design of the DESSOLVE I trial has been described elsewhere. Briefly, it is a first-in-human, prospective, nonrandomized, multicenter study of the new MiStent sirolimus-eluting stent coated with an absorbable polymer. At 4-, 6-, and 8-month follow-up, different subgroups of 10 patients were scheduled to undergo angiography, intravascular ultrasound, and OCT of the target vessel. All patients had OCT assessments scheduled at 18-month follow-up. The study protocol was approved by the institutional review boards of every participating institution, and all patients provided written informed consent.
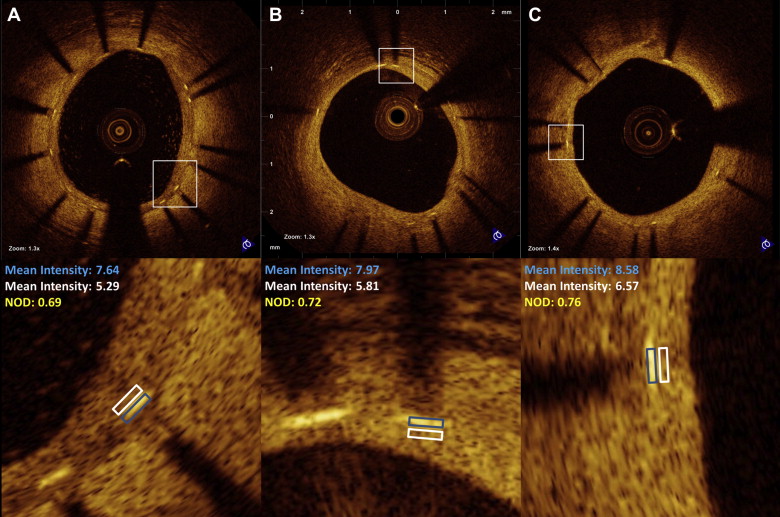
Images were acquired with a commercially available system (C7-XR OCT Intravascular Imaging System; St. Jude Medical, St. Paul, Minnesota) after intracoronary administration of 200 μg of nitroglycerin through conventional guiding catheters. A 0.014-mm guidewire was positioned distally, and the OCT catheter (C7 Dragonfly, St. Jude Medical, St. Paul, Minnesota) was advanced to the distal end of the stent. The entire length of the region of interest was scanned using the integrated automated pullback device at 20 mm/s. During image acquisition, coronary blood flow was replaced by contrast dye infusion. All images were digitally stored and submitted to core laboratory off-line evaluation (Imaging Core Laboratory, Harrington Heart and Vascular Institute, University Hospitals Case Medical Center, Cleveland, Ohio) and subsequent analysis using proprietary software (St. Jude Medical, St. Paul, Minnesota). All cross-sectional images (frames) were initially screened for quality assessment and excluded from analysis if any portion of the image was out of the screen or the image had poor quality caused by residual blood or sew-up artifact. Side branches occupying >45° of the cross section were excluded from the formal quantitative analysis, but the stent struts overlying ostia of the side branches underwent binary qualitative evaluation of coverage at every frame (i.e., 0.2-mm interval). The struts overlying side branch ostia underwent qualitative assessment of coverage and were classified as uncovered, covered, or proliferative, as previously described. Strut-level analyses in nonbifurcated segments were performed considering every 3 frames (0.6-mm interval) along the entire target segment. Lumen, stent, and neointimal hyperplasia (NIH) areas and volumes were calculated in a similar fashion at all time points. The center of the luminal surface of the strut blooming was determined for each strut and its distance to the lumen contour was calculated automatically to determine strut-level intimal thickness. Strut malapposition was determined when the negative value of strut-level intimal thickness was higher than the strut thickness, according to the stent manufacturer’s specifications, with the addition of a compensation factor of 20 μm to correct for strut blooming. The blooming compensation factor was determined based on the analysis of 2,250 struts. Highly reproducible measurements for strut apposition and coverage using the described methods have been reported. Qualitative imaging assessment was performed in every frame at all the time points for the presence of abnormal intrastent tissue, which was defined as any mass protruding beyond the stent struts into the lumen, with irregular surface and a sharp intensity gap between mass and neointimal tissue. Calcific neointima was defined as a well-delineated signal-poor region with sharp borders. Lipid-laden neointima was defined as a signal-poor region with diffuse borders. The stented segment was automatically segmented in 2.5-mm intervals (subsegments). A 2.5-mm subsegment with any malapposed strut was regarded as malapposed, whereas if no malapposition was detected in the entire subsegment, then it was counted as fully apposed. To determine longitudinal heterogeneity of uncovered or malapposed struts, as well as of NIH distribution, a coefficient of variation (CV) was assessed for each 2.5-mm subsegment and calculated dividing SD by the mean percentage of uncovered or malapposed struts or NIH thickness. Cross-sectional images were segmented in 360° axial chords between the lumen and the stent contours, and the neointima eccentricity index was calculated as maximum NIH thickness divided by the average value of 360° NIH measurements. An index of 1 represents concentric NIH. The final neointimal eccentricity index was the average of all cross sections within the stented segment. We also evaluated the pixel intensity (optical density) of stent strut covering tissue localized in the inner side of the struts, normalized for the optical density of the stent struts. A good correlation between optical density of stent strut covering tissue/optical density of stent struts (named normalized optical density) and morphologic information provided by both light and electron microscopies has been described previously by our group and others in preclinical models. Randomly chosen stent struts were evaluated at all time points. A region of interest was manually drawn by 2 experienced OCT analysts and the values of optical densities of stent strut covering tissue and stent struts were obtained automatically ( Figure 1 ). The reference value for low signal intensity tissue (LSIT) was obtained from preclinical data. A threshold of 0.610 was used to maximize specificity (95%).
The principle analysis was conducted using SAS 9.2 (SAS Institute Inc, Cary, North Carolina). Continuous variables are presented as mean ± SD and categorical variables are presented as number (percentage). For continuous variables, comparisons between 4-, 6-, and 8-month follow-up were made with 1-way analysis of variance, using Tukey post hoc test for the 3 individual-group differences. Comparison results were further confirmed by nonparametric Kruskal-Wallis test using post hoc Mann-Whitney U tests with Bonferroni correction. Categorical variables were compared using Fisher’s exact test with Bonferroni correction. The generalized estimating equations model with exchangeable correlation structure to account for the repeated measure within each subject was used for the comparison between 8- and 18-month follow-up. To estimate differences between different time points at strut level, specifically for LSIT-covered strut rate comparison, a multilevel mixed model, which can address random effects at frame and subject levels, was used.
Results
Thirty patients were included in the study. Clinical and baseline angiographic characteristics are listed, respectively, in Tables 1 and 2 . OCT imaging was conducted successfully, without associated adverse events in 10 different patients at 3 time points (4-, 6-,and 8-month follow-up). Two patients (6- and 8-month follow-up) were excluded from analysis because of poor image quality. At 18-month follow-up, 27 patients completed final OCT assessments (1 patient refused invasive evaluation and 2 patients developed serious noncardiac diseases). A total of 13,569 stent struts equally distributed in different time points were analyzed ( Table 3 ). In addition, 233 struts overlying side branch ostia in bifurcation segments were evaluated qualitatively for coverage status.
| Characteristic | Time Point | ||
|---|---|---|---|
| 4 Months (n = 10) | 6 Months (n = 9) | 8 Months (n = 9) | |
| Age (yrs) ∗ | 60.70 ± 8.19 | 70.44 ± 10.54 | 58.22 ± 7.98 |
| Men | 8 (80.0) | 6 (66.7) | 7 (77.8) |
| History of myocardial infarction | 2 (20.0) | 1 (11.1) | 2 (22.2) |
| Previous coronary bypass grafting | 0 | 0 | 0 |
| Percutaneous coronary intervention | 2 (20.0) | 3 (33.3) | 5 (55.6) |
| Cerebrovascular accident | 1 (10.0) | 0 (0.0) | (0.0) |
| Coronary risk factors | |||
| Smoker | 8 (80.0) | 6 (66.7) | 7 (77.8) |
| Diabetes mellitus | 0 (0.0) | 3 (33.3) | 4 (44.4) |
| Insulin-dependent | 0 (0.0) | 0 (0.0) | (0.0) |
| Hypertension | 6 (60.0) | 8 (88.9) | 8 (88.9) |
| Hypercholesterolemia | 8 (80.0) | 7 (77.8) | 9 (100.0) |
| Indications for index procedure | |||
| Angina pectoris | |||
| Stable | 7 (70.0) | 6 (66.7) | 6 (66.7) |
| Unstable | 2 (20.0) | 2 (22.2) | 2 (22.2) |
| Silent ischemia | 1 (10.0) | 1 (11.1) | 1 (11.1) |
| Characteristic | Time Point | ||
|---|---|---|---|
| 4 Months (n = 10) | 6 Months (n = 9) | 8 Months (n = 9) | |
| Target vessel | |||
| Right coronary artery | 3 (30.0) | 4 (44.4) | 4 (44.4) |
| Left anterior descending coronary artery | 4 (40.0) | 2 (22.2) | 1 (11.1) |
| Left circumflex coronary artery | 3 (30.0) | 3 (33.3) | 4 (44.4) |
| Reference vessel diameter (mm) | 2.76 ± 0.39 | 2.96 ± 0.34 | 2.84 ± 0.21 |
| Lesion length (mm) | |||
| Mean | 13.55 ± 3.40 | 13.16 ± 4.55 | 13.36 ± 3.90 |
| Minimum luminal diameter | 0.79 ± 0.20 | 0.93 ± 0.22 | 0.94 ± 0.28 |
| Percent diameter stenosis | 70.86 ± 8.64 | 68.48 ± 6.57 | 67.24 ± 8.63 |
| Complex characteristics | |||
| Eccentric lesion | 2 (20.0) | 1 (11.1) | 0 (0.0) |
| Calcification | |||
| Moderate | 2 (20.0) | 3 (33.3) | 2 (22.2) |
| Severe | 0 (0.0) | 1 (11.1) | 0 (0.0) |
| Lesion class (AHA classification) | |||
| A | 1 (10.0) | 2 (22.2) | 2 (22.2) |
| B1 | 5 (50.0) | 3 (33.3) | 4 (44.4) |
| B2 | 3 (30.0) | 2 (22.2) | 2 (22.2) |
| C | 1 (10.0) | 2 (22.2) | 1 (11.1) |
| Characteristic | Time Point | |||
|---|---|---|---|---|
| 4 Months | 6 Months | 8 Months | 18 Months | |
| Patients, n | 10 | 9 | 9 | 27 |
| Lesions, n | 10 | 9 | 9 | 27 |
| Stents, n | 10 | 10 | 9 | 28 |
| Total stent length (mm) | 17.48 ± 5.99 | 18.51 ± 5.66 | 20.84 ± 4.12 | 18.56 ± 5.61 |
| Total frames | 27.50 ± 9.43 | 28.33 ± 9.18 | 32.22 ± 7.36 | 28.67 ± 9.37 |
| Not analyzable frames (%) | 8.55 ± 10.53 | 11.00 ± 7.65 | 9.49 ± 5.66 | 10.56 ± 8.61 |
| Strut-level analysis | ||||
| Struts/patient, n | 261.30 ± 94.24 | 232.11 ± 80.59 | 270.67 ± 79.49 | 238.19 ± 70.06 |
| Uncovered struts (%) | 14.34 ± 15.35 | 6.62 ± 10.93 | 3.51 ± 2.87 ∗ | 0.84 ± 1.15 ∗ |
| Uncovered, malapposed struts (%) | 3.74 ± 7.35 | 3.15 ± 6.13 | 0.48 ± 0.56 | 0.09 ± 0.28 |
| NIH (μm) | 71.73 ± 39.78 † | 97.59 ± 32.27 | 132.12 ± 53.24 † | 152.15 ± 71.56 |
| Patients with >10% uncovered struts, n (%) | 4 (40.0) | 1 (11.1) | 0 (0.0) | 0 (0.0) |
| Subsegments with any malapposed struts (%) | 28.67 ± 36.45 | 26.77 ± 35.59 | 10.00 ± 11.15 | 2.12 ± 5.72 |
| Maximum length of uncovered segment (mm) | 5.14 ± 7.29 | 2.27 ± 3.14 | 2.09 ± 1.58 ∗ | 0.53 ± 0.89 ∗ |
| Maximum length of malapposed segment (mm) | 1.70 ± 2.77 | 1.38 ± 2.76 | 0.33 ± 0.32 | 0.09 ± 0.22 |
| Neointima eccentricity index | 4.08 ± 2.51 | 2.97 ± 1.14 | 2.61 ± 0.85 | 2.11 ± 0.45 |
| Planar and volumetric analysis | ||||
| Stent area (mm 2 ) | 6.27 ± 1.58 | 8.24 ± 3.39 | 7.44 ± 2.08 | 7.49 ± 2.42 |
| Lumen area (mm 2 ) | 5.97 ± 1.72 | 7.62 ± 3.41 | 6.42 ± 1.55 | 6.23 ± 2.34 |
| Minimal lumen area (mm 2 ) | 5.07 ± 1.55 | 5.75 ± 3.21 | 5.05 ± 1.36 | 5.03 ± 2.14 |
| Neointimal area (mm 2 ) | 0.46 ± 0.29 † | 0.81 ± 0.29 | 1.12 ± 0.73 † | 1.28 ± 0.66 |
| Stenosis (%) | 8.06 ± 6.40 | 10.68 ± 4.66 | 14.49 ± 6.31 | 17.93 ± 9.18 |
| Stent volume (mm 3 ) | 112.93 ± 55.71 | 148.29 ± 63.15 | 155.42 ± 56.13 | 137.98 ± 56.69 |
| Lumen volume (mm 3 ) | 108.25 ± 55.81 | 135.85 ± 61.93 | 134.43 ± 42.99 | 113.79 ± 45.62 |
| Neointimal volume (mm 3 ) | 7.84 ± 5.46 † | 15.51 ± 8.78 | 23.07 ± 17.14 † | 24.60 ± 17.25 |
| Net volume obstruction (%) | 8.01 ± 6.21 | 10.64 ± 4.65 | 14.36 ± 6.30 | 17.91 ± 9.19 |
| Malapposition volume (mm 3 ) | 2.19 ± 3.93 | 2.59 ± 3.98 | 1.61 ± 2.08 | 0.24 ± 0.78 |
| CV of uncovered struts in 2.5-mm subsegment (%) | 114.90 ± 64.02 | 123.23 ± 76.91 | 178.18 ± 87.08 ∗ | 89.75 ± 111.90 ∗ |
| CV of malapposed struts in 2.5-mm subsegment (%) | 131.40 ± 119.04 | 88.28 ± 105.44 | 139.56 ± 138.34 | 41.34 ± 102.63 |
| CV of NIH area in 2.5-mm subsegment (%) | 52.53 ± 20.96 | 43.07 ± 43.51 | 44.72 ± 19.09 ∗ | 28.96 ± 12.88 ∗ |
| Bifurcation uncovered struts overlying bifurcation, n/total (%) | 1/56 (1.8) | 2/56 (3.6) | 1/54 (1.9) | 1/67 (1.5) |
| Normalized optical density | 0.68 ± 0.06 ‡ , † | 0.75 ± 0.07 ‡ | 0.76 ± 0.06 † , ∗ | 0.79 ± 0.04 ∗ |
| Struts covered by LSIT, n/total (%) § | 50/570 (8.8) † | 9/286 (3.1) | 1/353 (0.3) † | 0/253 (0.0) |
Stay updated, free articles. Join our Telegram channel

Full access? Get Clinical Tree


