Conduction channels and electrograms with isolated component/late potentials are sensitive markers of the substrate of post–myocardial infarction sustained monomorphic ventricular tachycardia (VT). Ablation of all conduction channels and isolated component/late potentials (complete endocardial VT substrate ablation [CEVTSA]) during sinus rhythm could simplify and facilitate the ablation procedure, mainly in patients without references for clinical VT substrate identification. The aim of this study was to assess the safety, efficacy, and predictors of VT recurrence after CEVTSA. Electroanatomic mapping and CEVTSA were performed in 59 post–myocardial infarction patients (mean age 67 ± 9 years, mean left ventricular ejection fraction 30 ± 11%), 24 of whom did not have clinical VT substrate references. The mean areas of scar (≤1.5 mV) and dense scar (≤0.5 mV) were 76 ± 42 and 34 ± 24 cm 2 , respectively; isolated component/late potentials and conduction channels were identified and ablated in 97% and 83% of patients (mean ablation area 14 ± 10 cm 2 ). No life-threatening complications occurred during the procedure. After 1 year and at the end of follow-up (mean 39 ± 21 months), 81% and 58% of patients were free of VT. No differences were observed between patients with and without specific clinical VT substrate identification. Univariate analysis identified the left ventricular ejection fraction, VT cycle length (VTCL), infarct location (inferior vs anterior), and dense scar area as predictors of VT recurrence, and Cox analysis identified VTCL (hazard ratio 0.42, p <0.001) and dense scar area (hazard ratio 2.65, p <0.0006) as independent predictors. No patients with dense scar area ≤25 cm 2 and VTCL >350 ms had recurrences. In conclusion, CEVTSA is safe and effective, even in patients without clinical VT substrate identification. Scar area and VTCL are valuable predictors of VT recurrence.
Ablation of unmappable ventricular tachycardia (VT) after myocardial infarction has promoted the characterization of the VT substrate during sinus rhythm. Electrograms with isolated component/late potentials (IC/LPs) and slow conduction channels (CCs) detected during scar mapping are highly sensitive and specific markers of VT isthmuses. The number of distinct IC/LP sites has been shown to correlate with the number of induced VTs. Identification of IC/LPs related to clinical VT requires at least the recording of the VT electrocardiogram, although this is unavailable in most patients with implantable cardioverter-defibrillators (ICDs). Therefore, multiple VT inductions and comparison of stored electrograms during spontaneous and induced VT are required to identify clinical VT. This process is time consuming, and potentially harmful defibrillation shocks are required to terminate some VTs. Ablation of all CCs and IC/LPs (complete endocardial VT substrate ablation [CEVTSA]) during sinus rhythm could simplify the procedure and be performed in patients without specific clinical VT substrate identification. In this study, we assessed the safety, long-term efficacy, and predictors of recurrence of VT after CEVTSA and compared patients with and without specific clinical VT substrate identification.
Methods
This prospective study included 59 consecutive patients referred for ablation of sustained monomorphic VT from January 2004 to December 2008. The patients fulfilled the following inclusion criteria: (1) chronic myocardial infarction, (2) documented sustained monomorphic VT by ICD stored electrograms or electrocardiograms, (3) complete endocardial left ventricular mapping during sinus rhythm or right ventricular pacing, and (4) intention to target all IC/LPs and CCs.
The study population was selected from 86 consecutive patients referred to our hospital during the same period for ablation of post–myocardial infarction VT. The 27 remaining patients did not undergo CEVTSA, because substrate mapping was not performed and ablation targeted only mid-diastolic electrograms during stable VT. No patient had previously undergone VT substrate ablation.
All patients gave their informed consent. At least 2 quadrupolar catheters were placed in the bundle of His and in the right ventricular apex or right ventricular outflow tract for mapping reference and pacing. Programmed electrical stimulation (PES), when performed, delivered up to 3 extra stimuli during 2 paced cycle lengths from 2 right ventricular sites or the left ventricle. The ICD was programmed to record the electrograms of the induced VT, which were compared to the spontaneous VT electrograms. Mapping and ablation were performed using the CARTO system (Biosense Webster Inc., Diamond Bar, California) and an externally irrigated radiofrequency ablation catheter (NaviStar Thermocool; Biosense Webster). Radiofrequency ablation was performed with a 550-kHz radiofrequency Stockert-Cordis generator (Biosense Webster). Radiofrequency energy was delivered for 60 to 120 seconds at each ablation site with a maximum temperature target of 45°C and maximum power of 45 W. Heparin was infused throughout the procedure.
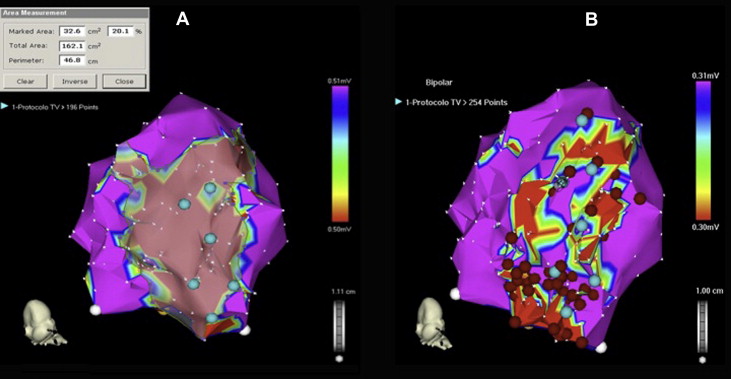
Detailed endocardial mapping was performed during sinus rhythm or right ventricular apex pacing at 600 ms. To define the VT substrate, multiple sites were explored to obtain a fill threshold of 10 mm within the low-voltage area. The scar mapping was performed as follows. First, scar voltage limits were set at 1.5 and 0.5 mV to define and measure the scar and dense scar.
Second, IC/LPs and CCs were identified and defined during sinus rhythm or right ventricular pacing, as previously reported. An IC/LP was defined as an electrogram recorded in the scar tissue showing double or multiple components separated by an isoelectric interval or very low amplitude signal ≥50 ms. A CC was defined as a corridor of continuous electrograms differentiated from the surrounding scar tissue by a higher voltage and connected to normal myocardium by ≥1 site.
Third, specific clinical VT substrate identification was performed. When the clinical VT electrocardiogram was available, pace mapping from IC/LPs and CCs was performed to reproduce the VT electrocardiogram, followed by VT induction and activation mapping. When the electrocardiogram of spontaneous VT was not available, VT was induced, and if the ICD stored electrograms during the induced VT matched the spontaneous VT stored electrograms (similar amplitude and polarity of major deflection on far-field and bipolar electrograms), this VT was considered the clinical VT, and the electrocardiogram was used for guiding pace and activation mapping. The specific clinical VT substrate was identified by a good pace maps (≥11 of 12 matching leads) or by recording mid-diastolic electrograms during VT.
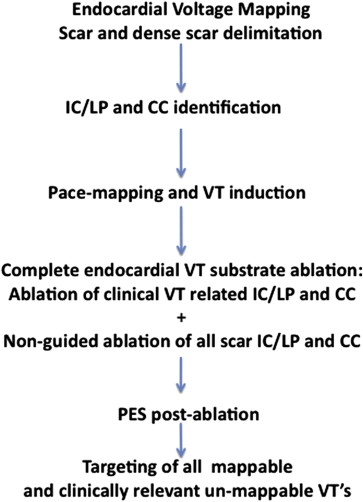
In those patients in whom there was a reference of the clinical VT, the IC/LPs and CCs related to clinical VTs were targeted first and followed by nonguided ablation of all remaining IC/LPs and CCs ( Figure 1 ). In patients with no specific clinical VT substrate identification, nonguided CEVTSA was performed. The local end points were disappearance of IC/LP or CC electrograms or absence of local capture at 10 mA. PES was only repeated after CEVTSA. Then an induced VT was targeted if the VT was mappable or the morphology was similar to the spontaneous or induced VT, even if the cycle length was significantly shorter. The morphology of the induced VT was evaluated, the area of the supposedly related scar was revisited, and IC/LPs and CCs were sought and targeted if identified.

The follow-up protocol included regular clinical and ICD evaluation performed every 6 months. The investigators analyzed ICD interrogations to differentiate VT and to obtain the number of events, type of treatment required, and VT cycle lengths.
Statistical analysis was performed using S-Plus version 8.0 (Tibco Software, Palo Alto, California) and expanded using the “hmisc” and “design” libraries. Continuous variables are expressed as mean ± SD and were compared using paired Student’s t tests. Categorical variables were compared using Fisher’s exact test. Long-term outcome of survival without recurrence of VT was analyzed using Cox proportional-hazards analysis. Potential clinically predetermined covariates were assessed using univariate analysis and entered into a fully saturated model. Significant covariates were then selected by backward stepwise selection on the basis of the Akaike information criterion. To exclude overfitting due to small sample size, models were validated by resampling 500 bootstrap replications. Proportional-hazards assumptions were confirmed using Schoenfeld residuals. Hazard ratios and their 95% confidence intervals were calculated for relevant predictors. Kaplan-Meier analyses and log-rank tests were used to estimate survival differences. All tests were 2 tailed, and p values <0.05 were considered to indicate statistical significance.
Results
The study sample comprised 59 consecutive patients who underwent CEVTSA. Ablation was indicated in patients with multiple VT episodes or ICD discharges and in patients with syncope despite effective ICD therapy. Before ablation, 40 patients had ICDs. Twenty-seven patients (45%) had had poorly tolerated VT episodes, with VT cycle lengths ≤320 ms. Tables 1 and 2 list the clinical and mapping data of the patients.
| Variable | Total (n = 59) | No Recurrence (n = 34) | Recurrence (n = 25) | p Value |
|---|---|---|---|---|
| Age (yrs) | 66 ± 10 | 67 ± 9 | 66 ± 11 | NS |
| Men | 54 (91%) | 31 (91%) | 23 (92%) | NS |
| Diabetes mellitus | 21 (35%) | 13 (38%) | 8 (32%) | NS |
| Hypertension | 40 (67%) | 23 (67%) | 17 (68%) | NS |
| Stroke | 4 (6%) | 2 (5%) | 2 (8%) | NS |
| Coronary bypass | 15 (25%) | 11 (32%) | 4 (16%) | 0.20 |
| Percutaneous coronary intervention | 31 (52%) | 18 (51%) | 13 (52%) | NS |
| New York Heart Association class III or IV | 11 (18%) | 4 (11%) | 7 (28%) | 0.10 |
| Myocardial infarct location | 0.04 | |||
| Inferior | 40 | 27 | 13 | |
| Anterior | 19 | 7 | 12 | |
| LVEF (%) | 29 ± 10 | 32 ± 11 | 25 ± 8 | 0.01 |
| Rhythm | NS | |||
| Sinus rhythm | 48 | 28 | 20 | |
| Atrial fibrillation | 6 | 3 | 3 | |
| Paced rhythm | 5 | 3 | 2 | |
| Wide QRS interval (≥120 ms) | 21 (35%) | 9 (26%) | 12 (48%) | 0.10 |
| Creatinine (mg/dl) | 1.2 ± 0.6 | 1.1 ± 0.3 | 1.4 ± 0.8 | 0.10 |
| Medications | ||||
| Angiotensin receptor blockers or angiotensin-converting enzyme inhibitors | 53 (89%) | 31 (91%) | 22 (88%) | NS |
| β blockers | 52 (88%) | 30 (88%) | 22 (88%) | NS |
| Amiodarone/sotalol | 20 (34%) | 12 (35%) | 8 (32%) | NS |
| Follow-up (mo) | 38 ± 22 | 41 ± 21 | 34 ± 23 | 0.20 |
| Variable | Total | No Recurrence | Recurrence | p Value |
|---|---|---|---|---|
| Total endocardial area (cm 2 ) | 177 ± 46 | 169 ± 53 | 189 ± 31 | 0.1 |
| Scar area ≤1.5 mV | 76 ± 42 | 60 ± 32 | 97 ± 44 | 0.0005 |
| Scar area ≤0.5 mV | 34 ± 24 | 25 ± 16 | 46 ± 28 | 0.0005 |
| IC/LPs | 57 (96%) | 32 (94%) | 25 (100%) | NS |
| IC/LP area (cm 2 ) | 16 ± 10 | 13 ± 7 | 21 ± 11 | 0.005 |
| CCs | 49 (83%) | 23 (76%) | 26 (92%) | 0.1 |
| VT-related channels | 37 (62%) | 21 (60%) | 16 (64%) | NS |
| IC/LP and CC areas not ablated | 13 (22%) | 7 (20%) | 6 (24%) | NS |
The procedure lasted 172 ± 46 minutes. Endocardial mapping was performed during right ventricular pacing in 90% of patients and during sinus rhythm in the remaining 10%. Voltage mapping identified ≥1 CC in 83% of patients, and these were related to the clinical or induced VT in 81% of these patients. VT was not inducible or PES was not performed because of the clinical condition in 17 patients (28%). The specific clinical VT substrate was identified in 35 patients by pace and activation mapping (n = 27) and by pace mapping alone (n = 8). In 24 patients, there was no clinical VT electrocardiogram, and the induced VT did not match the spontaneous VT electrograms, so specific clinical VT substrate identification was not possible, and nonguided CEVTSA was performed ( Figure 2 ).

The mean ablation area was 14 ± 10 cm 2 and the mean ablation time 11 ± 5 minutes. Not all IC/LPs or CCs were ablated in 12 cases (20%), because of the patients’ clinical conditions. These patients had larger scars (110 ± 49 vs 67 ± 35 cm 2 , p = 0.001) and dense scars (41 ± 21 vs 32 ± 25 cm 2 , p = 0.10). PES was repeated after CEVTSA in 32 patients, and VT inducibility was suppressed in 20 patients (62%); of the remaining 12 patients, mappable VTs were induced in 5, but mid-diastolic electrograms were recorded in only 1 patient. Fast nonmappable VTs were induced in the remaining 7 patients (VT cycle length 288 ± 34 ms, range 230 t 330), and in 2, the VTs were considered clinically relevant and targeted. In 27 patients, PES was not performed after CEVTSA: 17 patients in whom VT was not induced or induction was not attempted at baseline and 10 patients in whom the hemodynamic status advised termination of the procedure. These 27 patients were in worse functional classes (26% vs 12% in New York Heart Association functional class III or IV, p = 0.10) and had larger dense scars (37 ± 27 vs 30 ± 20 cm 2 , p = 0.10).
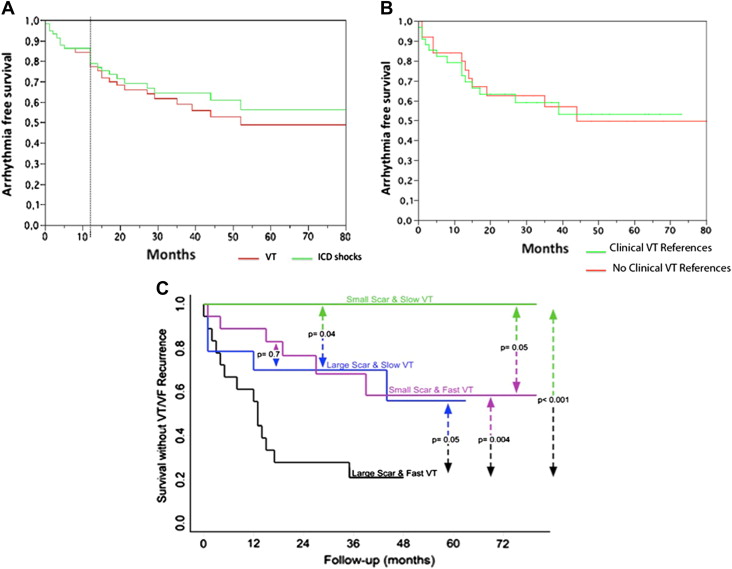
No major complications were recorded in the electrophysiology laboratory. Despite ablation of large areas of endocardium, we did not observe an increase in the frequency of embolic events or proarrhythmia. The left ventricular ejection fraction (LVEF) did not decrease after ablation (29 ± 10% vs 31 ± 11%, p = NS). No patients were lost to follow-up. Only 34% of patients were discharged with antiarrhythmic drugs. After 1 year, 81% and 86% of the patients were free from VT recurrences and ICD shocks, respectively; at the end of follow-up, these percentages had decreased to 58% and 64% (39 ± 21 months; Figure 3 ). The 55% of the patients without VT recurrence had had multiple VT episodes or ICD discharges before ablation, during the follow-up none of these patients had incessant VT or electrical storm. Only 4 patients had multiple ICD shocks after ablation. No differences were observed between patients with and without references for clinical VT ablation ( Figure 3 ). Of the 13 patients (22%) who died during follow-up, the causes were heart failure in 6 (in 2 the first week after ablation), recurrent incessant VT in 3, sudden cardiac death in 1, and noncardiac in the remaining 3 patients. VT recurrence was the only predictor of total mortality (36% vs 11%, p = 0.051).


Stay updated, free articles. Join our Telegram channel

Full access? Get Clinical Tree


