In clinical practice, perfusion at rest in vasodilator stress single-photon emission computed tomography is commonly used to confirm myocardial infarction (MI) and ischemia and to rule out artifacts. It is unclear whether perfusion at rest carries similar information in cardiovascular magnetic resonance (CMR). We sought to determine whether chronic MI is associated with abnormal perfusion at rest on CMR. We compared areas of infarct and remote myocardium in 31 patients who underwent vasodilator stress CMR (1.5 T), had MI confirmed by late gadolinium enhancement (LGE scar), and coronary angiography within 6 months. Stress perfusion imaging during gadolinium first pass was followed by reversal with aminophylline (75 to 125 mg), rest perfusion, and LGE imaging. Resting and peak-stress time-intensity curves were used to obtain maximal upslopes (normalized by blood pool upslopes), which were compared between infarcted and remote myocardial regions of interest. At rest, there was no significant difference between the slopes in the regions of interest supplied by arteries with and without stenosis >70% (0.31 ± 0.16 vs 0.26 ± 0.15 1/s), irrespective of LGE scar. However, at peak stress, we found significant differences (0.20 ± 0.11 vs 0.30 ± 0.22 1/s; p <0.05), reflecting the expected stress-induced ischemia. Similarly, at rest, there was no difference between infarcted and remote myocardium (0.27 ± 0.14 vs 0.30 ± 0.17 1/s), irrespective of stenosis, but significant differences were seen during stress (0.21 ± 0.16 vs 0.28 ± 0.18 1/s; p <0.001), reflecting inducible ischemia. In conclusion, abnormalities in myocardial perfusion at rest associated with chronic MI are not reliably detectable on CMR images. Accordingly, unlike single-photon emission computed tomography, normal CMR perfusion at rest should not be used to rule out chronic MI.
The diagnostic performance of cardiovascular magnetic resonance (CMR) using vasodilators for detection of coronary artery disease is well established. However, the physical principles underlying CMR perfusion imaging are different from those of single-photon emission computed tomography (SPECT). Unlike SPECT, which relies on regional differences in myocardial uptake of radiotracers, CMR-based myocardial perfusion imaging uses first pass of a contrast agent, which requires imaging immediately after a bolus injection of gadolinium contrast. In myocardium affected by coronary stenosis, reduced blood flow results in a decreased concentration and a decreased rate of uptake of the T1-shortening contrast material and allows dynamic T1-weighted imaging techniques to be used to detect areas of hypoperfusion. Because of its greater spatial resolution, the assessment of perfusion using CMR is less dependent on myocardial wall thickness than SPECT. Because of these differences, it is unclear whether resting perfusion on CMR carries similar diagnostic information to that of SPECT, and accordingly, whether perfusion at rest is necessary and important for the CMR diagnosis of myocardial infarction (MI). Specifically, it is unclear whether chronic MI is usually associated with a perfusion defect at rest, as it is on SPECT. We hypothesized that under conditions at rest, differences in perfusion between infarcted and remote myocardium may not be sufficiently large to manifest in visible and quantifiable defects on CMR. Accordingly, our study was designed to compare perfusion at rest in areas of infarct and remote myocardium in patients with known coronary anatomy, using both visual assessment and quantitative analysis, to determine the role of perfusion at rest in the differential diagnosis of chronic MI in the context of vasodilator stress CMR.
Methods
We retrospectively studied patients with chronic MI and stable angina, who underwent clinically indicated vasodilator stress and late gadolinium enhancement (LGE) CMR imaging and had coronary angiography data available. LGE images were used to determine areas of infarct. Rest and peak-stress first-pass images were analyzed to measure the maximal normalized upslope of the myocardial time-intensity curve, a quantitative index of regional myocardial perfusion. This index was correlated with the presence of scar in each region of interest (ROI) and also with the presence of significant stenosis in a coronary artery supplying this ROI. This was achieved by dividing myocardial ROIs into groups, according to the presence of scar, and, separately, the presence of significant stenosis, and comparing the measured values of the perfusion index between these groups.
The study was approved by the institutional review board and included 31 patients (61% men, age 65 ± 12 years) who underwent vasodilator stress CMR for suspected coronary artery disease. All patients had LGE consistent with MI in addition to invasive coronary angiography data within 6 months of CMR. The basic characteristics and demographics of the patients are listed in Table 1 . Exclusion criteria included patients with contraindications to adenosine or regadenoson (high-grade atrio-ventricular block, active chronic obstructive pulmonary disease or asthma, caffeine, and xanthines/theophylline intake within 12 hours before the examination) or gadolinium administration (end-stage renal disease on hemodialysis or glomerular filtration rate <30 ml/min).
| Variable | |
|---|---|
| Body mass index | 30.3 ± 6.6 kg/m 2 |
| Hypertension | 97% |
| Hyperlipidemia | 97% |
| Diabetes | 30% |
| Tobacco use (former or current) | 50% |
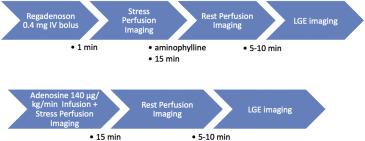
The protocol for the vasodilator stress portion of the cardiac examination included myocardial perfusion imaging during first pass of contrast agent. In 22 patients, regadenoson (Lexiscan 0.4 mg intravenous bolus, Astellas Pharma, Northbrook, Illinois) was used as a stress agent, whereas in the remaining 9 patients, adenosine infusion (Adenoscan 140 μg/kg/min, Astellas Pharma) over 3 minutes was used. Imaging protocols for each vasodilator are schematically depicted in Figure 1 . Images were acquired in 3 short-axis slices during first pass of a gadobenate dimeglumine bolus (0.075 to 0.10 mmol/kg at 4 to 5 ml/s), followed by 20 ml saline solution (4 ml/s). We used electrocardiogram-triggered acquisition during systole, resulting in a series of images at the same phase of the cardiac cycle over multiple consecutive heartbeats. Breath-holds at end expiration were used to minimize respiratory motion.

Patients who underwent regadenoson stress were scanned at the University of Chicago Medical Center using a 1.5-T system (Achieva; Philips, Best, the Netherlands) with a 5-channel phased-array coil. Stress imaging was performed 1 minute after regadenoson administration, followed by aminophylline (75 to 125 mg IV) to reverse the effects of the vasodilator, and then by rest perfusion imaging 15 minutes later to allow contrast washout and vasodilator reversal. Imaging was performed during 80 to 90 cardiac cycles using a hybrid gradient echo and echo-planar imaging (EPI) sequence: nonselective 90° saturation pulse followed by an 80-ms delay, voxel size ∼2.5 × 2.5 mm, acquisition time 83 ms per slice, slice thickness 10 mm, flip angle 20°, repetition time 5.9 ms, echo time 2.7 ms, EPI factor 5, and SENSitivity Encoding factor 2.
Patients in whom adenosine was used as the vasodilator stress agent were scanned at another site (University of Virginia Medical Center, Charlottesville, Virginia) using a 1.5-T scanner (Siemens Healthcare, Erlangen, Germany) with a 4-channel phased-array coil. Stress perfusion imaging was followed by rest perfusion imaging 15 minutes later. Imaging was performed during 40 to 50 cardiac cycles using the gradient echo and EPI sequence: nonselective 90° saturation pulse followed by an 80-ms delay, field of view 340 to 400 × 212 to 360 mm, matrix = 128 × 80, slice thickness 8 mm, flip angle 25°, repetition time 5.6 to 6.2 ms, echo time 1.3 ms, echo train length 4, effective spatial resolution ∼2.8 × 2.8 mm with parallel imaging.
LGE imaging using a T1-weighted gradient echo pulse with a phase sensitive inversion recovery reconstruction (slice thickness 10 mm, repetition time 3.7 ms, echo time 1.8 ms, flip angle 30, voxel size 2.5 mm, SENSitivity Encoding factor off) was performed approximately 5 minutes after rest injection in the same 3 slices used for rest and stress perfusion imaging. A inversion time scout allowed the optimal inversion time to be chosen, when normal myocardium was nulled.
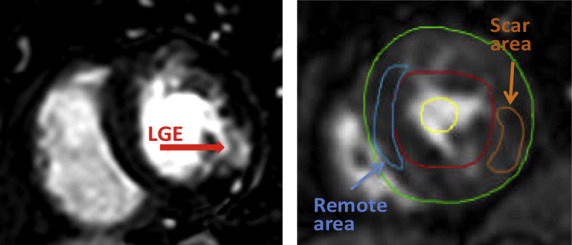
Stress perfusion and LGE images were analyzed by an experienced reader blinded to coronary angiography findings. In addition to visual assessment of perfusion, which included standard method, mean signal intensity was measured in 3 ROIs: (1) restricted to an area of MI, as defined by the presence of LGE ( Figure 2 ), (2) remote myocardium, and (3) the blood pool, using commercial software (Medis, Leiden, the Netherlands). These measurements were repeated for each consecutive frame to generate time-intensity curves. To minimize the effects of motion on these time curves, the position of the ROIs was manually adjusted for each frame. The curves were used to obtain maximal upslope for each ROI, and myocardial upslopes were normalized by that of the blood pool to allow interpatient comparisons. Upslope measurements were compared between all ROIs containing scar and remote ROIs, irrespective of the patency of the coronary arteries supplying these ROIs. In a separate analysis, upslopes were compared between all ROIs supplied by arteries with significant stenosis (>70% luminal narrowing on coronary angiography) and those supplied by patent arteries, irrespective of the presence of scar (in other words, lumping together scar and remote myocardium).

Paired t tests were used for intergroup comparisons of scar versus remote myocardium, performed in the same patient. Unpaired t tests were used for intergroup comparisons of ROIs supplied by stenosed versus patent arteries. p Values <0.05 were considered significant.
Results
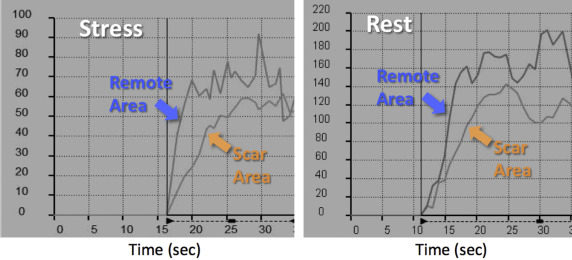
Figure 3 shows an example of a patient with evidence of subendocardial LGE in the midinferior wall (left), consistent with chronic MI. The first-pass contrast images depict dark areas in the affected myocardium both at stress and rest (middle and right). Of the 31 study patients, only 6 showed similar perfusion patterns, with reduced signal intensity in the scar area both on the images at rest and stress images. These findings were also quantitatively confirmed by the presence of a reduced upslope of both regional signal intensity curves obtained during stress and at rest ( Figure 4 ).


