Risk assessment plays a major role in the management of acute coronary syndrome. The aim was to compare the performance of the Global Registry of Acute Coronary Events (GRACE) and the Can Rapid risk stratification of Unstable angina patients Suppress Adverse outcomes with Early implementation of the American College of Cardiology/American Heart Asociation guidelines (CRUSADE) risk scores to predict in-hospital mortality and major bleeding (MB) in 1,587 consecutive patients with acute coronary syndrome. In-hospital deaths and bleeding complications were prospectively collected. Bleeding complications were defined according to CRUSADE and Bleeding Academic Research Consortium (BARC) criteria. During the hospitalization, 71 patients (4.5%) died, 37 patients (2.3%) had BARC MB and 34 patients (2.1%) had CRUSADE MB. Receiver operating characteristic curves analyses showed GRACE risk score has better discrimination capacity than CRUSADE risk score for both, mortality (0.86 vs 0.79; p = 0.018) and BARC MB (0.80 vs 0.73; p = 0.028), but similar for CRUSADE MB (0.79 vs 0.79; p = 0.921). Both scores had low discrimination for predicting MB in the elderly (>75 years) and patients with atrial fibrillation, whereas CRUSADE risk score was especially poor for predicting MB in patients with <60 ml/min/1.73 m 2 or those treated with new antiplatelets. Reclassification analyses showed GRACE risk score was associated with a significant improvement in the predictive accuracy of CRUSADE risk score for predicting mortality (net reclassification improvement: 22.5%; p <0.001) and MB (net reclassification improvement: 17.6%; p = 0.033) but not for CRUSADE MB. In conclusion, GRACE risk score has a better predictive performance for predicting both in-hospital mortality and BARC MB. In light of these findings, we propose the GRACE score as a single score to predict these in-hospital complications.
Risk assessment plays a major role in the management of patients with acute coronary syndrome (ACS). Decisions on management should be based on ischemic and bleeding risk, as assessed by clinical judgment and different risk stratification schemes. Therefore, current guidelines recommend the use of the Global Registry of Acute Coronary Events (GRACE) score and the Can Rapid risk stratification of Unstable angina patients Suppress Adverse outcomes with Early implementation of the American College of Cardiology/American Heart Asociation guidelines (CRUSADE) score as quantitative risk scoring systems to assess mortality and bleeding risk, respectively, and propose a more aggressive treatment approach, including more potent antithrombotic therapies and a rapid invasive strategy, for patients at high risk. However, given that a large portion of the improvement in the outcomes of these patients has been based on the use of more intensive antithrombotic agents and invasive strategies, both associated with an increased incidence of bleeding complications, try to separate the mortality risk from the hemorrhagic risk is highly complicated. The main aims of this study are to assess the performance of GRACE and CRUSADE risk scores to predict in-hospital mortality and major bleeding (MB) in a contemporary ACS population and to compare them.
Methods
The present study is a retrospective analysis of a tertiary university hospital prospective registry. From January 1, 2012, to July 31, 2015, 1,587 consecutive patients with a diagnosis of ACS were included. Patients underwent coronary artery bypass graft (n = 83) and, those with missing risk score data were excluded from the analysis (n = 37). During the index hospitalization, data on demographic and clinical characteristics, medication as well as laboratory, electrocardiography, echocardiography, angiography parameters, and clinical complications were collected in detail by clinical cardiologist specifically trained for this purpose. For each patient, GRACE and CRUSADE risk scores were calculated. Patients were classified into 3 categories as a function of GRACE risk score (low risk: ≤108 points, intermediate risk: 109 to 140 points, and high risk: >140 points) and 3 categories as a function of CRUSADE risk score (very low/low risk: ≤30 points; moderate risk: 31 to 40 points; and high/very high risk: >40 points). The clinical management decisions about each patient were decided by the cardiologist responsible.
The clinical events of the study were the occurrence of in-hospital mortality and MB complications defined according to Bleeding Academic Research Consortium (BARC) and CRUSADE criteria. For reasons of clinical relevance, BARC bleeding types 3 to 5 were defined as MB. Clinical events were prospectively collected. Two cardiologists (SMF and PJFB) classified the type of MB. A third cardiologist (ALC) was consulted if there were discrepancies. All the elements comprising bleeding definitions are included in our daily data collection. The study complied with the Declaration of Helsinki and was approved by the institutional review board of our institution.
The independent effect of GRACE and CRUSADE bleeding risk scores on study clinical events were assessed by multivariate binary logistic regression models. Variables associated with the events of interest in univariate analyses (p <0.05) were included in multivariate prediction models. To avoid model overfitting and multicollinearity effects, we did not incorporate as independent covariates those variables included in the GRACE and CRUSADE risk scores. The in-hospital mortality multivariate model included the following variables: current smoking, chronic heart failure, peripheral artery disease, atrial fibrillation or atrial flutter, radial access, multivessel disease (left main artery or 3-vessel disease), percutaneous coronary intervention, drug-eluting stent, nonfractionated heparin use, and new antiplatelets (prasugrel or ticagrelor) use. The MB complications model included as covariates: atrial fibrillation or atrial flutter, high-sensitive troponin T, chronic obstructive pulmonary disease, radial access, multivessel disease, percutaneous coronary intervention, and new antiplatelets use.
To compare different accuracy of GRACE and CRUSADE risk scores for predicting in-hospital mortality and MB, we performed discrimination and calibration analyses. To assess the calibration of both scores we used the Hosmer–Lemeshow goodness-of-fit test. This test is mainly used for validating newly created models, but it is also useful for validating existing logistical models with an external database, as is the case in this study. The Hosmer–Lemeshow test estimates a C statistic based on the difference between the clinical events values observed in reality and those predicted by the model for different risk groups. The smaller the statistical value, the poorer calibrated the model. A p value >0.05 indicates that the model is well adjusted to the data and therefore is a good predictor of patients’ probability of events. Finally, we also compared both scores by calculating the net reclassification improvement (NRI) as described by Pencina et al where the categories of probability for events were defined based on the GRACE risk score for in-hospital mortality and CRUSADE bleeding risk score for MB. All p values <0.05 were accepted as statistically significant. Statistical analysis was performed using statistical software (STATA 13.0 for Windows, College Station, TX).
Results
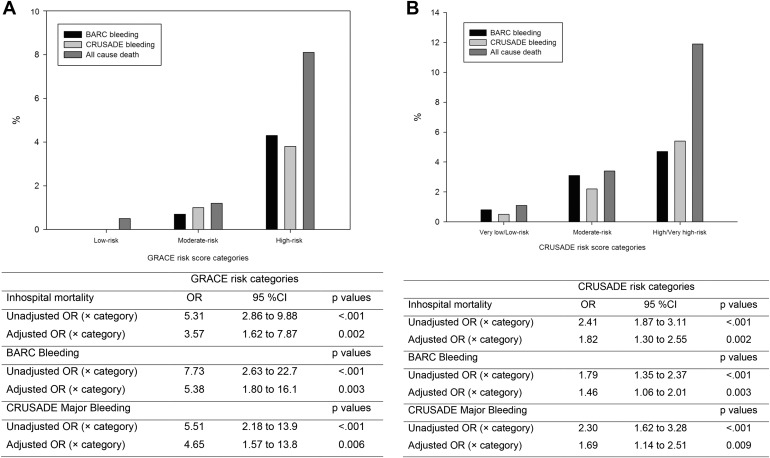
The study population consisted on 1,587 patients with ACS. The characteristics of the study population are listed in Table 1 . Based on GRACE risk categories, 376 patients (24%) had low risk, 418 patients (26%) had intermediate risk, and 793 patients (50%) had high risk. Moreover, bleeding risk based on CRUSADE categories was very low/low risk in 838 patients (53%), moderate risk in 320 patients (20%), and high/very high risk in 429 patients (27%).
Variable | All patients (N = 1587) | All cause mortality | BARC bleeding | CRUSADE bleeding | ||||||
|---|---|---|---|---|---|---|---|---|---|---|
| No (N = 1516) | Yes (N = 71) | p | Yes (N = 37) | No (N = 1550) | p | Yes (N = 34) | No (N = 1553) | p | ||
| Age (years) | 67±13 | 67±13 | 75±12 | <.001 | 76±9 | 67±13 | <.001 | 67±13 | 76±9 | <.001 |
| Age >75 years | 491 (31%) | 449 (30%) | 23 (62%) | <.001 | 30 (42%) | 468 (30%) | <.001 | 470 (30%) | 21 (62%) | <.001 |
| Women | 444 (28%) | 414(27%) | 30 (42%) | 0.006 | 13 (35%) | 431(28%) | 0.326 | 430(28%) | 14 (41%) | 0.083 |
| Diabetes mellitus | 728 (46%) | 689 (45%) | 39 (55%) | 0.117 | 19 (51%) | 709 (46%) | 0.499 | 709 (46%) | 19 (56%) | 0.236 |
| Hypertension | 1150 (73%) | 1094 (72%) | 56 (79%) | 0.216 | 31 (84%) | 1119 (72%) | 0.119 | 1119 (72%) | 31 (91%) | 0.011 |
| Current smoking | 484 (31%) | 470 (31%) | 14 (20%) | 0.044 | 9 (24%) | 475 (31%) | 0.409 | 477 (31%) | 7 (21%) | 0.205 |
| Previous acute coronary syndrome | 544 (34%) | 527 (35%) | 17 (24%) | 0.059 | 10 (27%) | 534 (35%) | 0.343 | 533 (34%) | 11 (32%) | 0.805 |
| Previous percutaneous coronary intervention | 475 (30%) | 459 (30%) | 13 (23%) | 0.163 | 11 (30%) | 464 (30%) | 0.976 | 464 (30%) | 11 (32%) | 0.757 |
| Previous coronary artery bypass graft | 78 (5%) | 77 (5%) | 1(1%) | 0.256 | 1 (3%) | 77 (5%) | 1.000 | 77 (5%) | 1 (3%) | 1.000 |
| Chronic heart failure | 83 (5%) | 75 (5%) | 8 (11%) | 0.029 | 4 (11%) | 79 (5%) | 0.124 | 77 (5%) | 6 (18%) | 0.007 |
| Previous stroke | 165 (10%) | 155 (10%) | 10 (14%) | 0.298 | 3 (8%) | 162 (11%) | 0.359 | 161 (10%) | 4 (12%) | 0.774 |
| Peripheral artery disease | 121 (8%) | 111 (7%) | 10 (14%) | 0.036 | 2 (5%) | 119 (8%) | 1.000 | 117 (8%) | 4 (12%) | 0.323 |
| Atrial fibrillation/flutter | 231 (15%) | 205 (14%) | 26 (37%) | <.001 | 14 (38%) | 217 (14%) | <.001 | 216 (14%) | 15 (44%) | <.001 |
| Malignancy | 87 (6%) | 85 (6%) | 2 (3%) | 0.429 | 1 (3%) | 86 (6%) | 0.719 | 85 (6%) | 2 (6%) | 0.710 |
| Chronic obstructive pulmonary disease | 161 (10%) | 150 (10%) | 11 (16%) | 0.127 | 8 (22%) | 153 (10%) | 0.046 | 154 (10%) | 7 (21%) | 0.075 |
| Cardiac arrest | 37 (2%) | 27 (2%) | 10 (14%) | <.001 | 1 (3%) | 36 (2%) | 0.586 | 36 (2%) | 1 (3%) | 0.555 |
| Systolic blood pressure (mmHg) | 135±28 | 136±28 | 116±28 | <.001 | 116±28 | 135±28 | <.001 | 135±28 | 19±26 | 0.002 |
| Heart rate (beat/min) | 77±19 | 76±19 | 88±22 | <.001 | 88±22 | 77±19 | 0.019 | 77±19 | 88±21 | 0.001 |
| Killip >I (first 24h admission) | 357 (22%) | 305 (20%) | 52 (73%) | <.001 | 18 (49%) | 339 (22%) | <.001 | 337 (22%) | 20 (59%) | <.001 |
| Dynamic EKG changes | 754 (48%) | 713 (47%) | 41 (58%) | 0.079 | 25 (68%) | 729 (47%) | 0.014 | 735 (47%) | 19 (56%) | 0.327 |
| Estimated GFR (mL/min/1.73m 2 ) | 73±24 | 74±24 | 57±24 | <.001 | 58±21 | 73±24 | <.001 | 73±24 | 56±23 | <.001 |
| Estimated GFR <60mL/min/1.73m 2 | 465 (29%) | 422 (28%) | 43 (61%) | <.001 | 19 (51%) | 446 (29%) | 0.003 | 445 (29%) | 20 (59%) | <.001 |
| Hemoglobin | 13.8±1.9 | 13.8±1.9 | 12.8±2.0 | <.001 | 12.0±2.1 | 13.8±1.9 | <.001 | 13.8±1.9 | 11.4±1.9 | <.001 |
| Hs-troponin T | 47 [16-226] | 43 [15-197] | 646 [119-2391] | <.001 | 130 [30-1269] | 46 [16-220] | <.001 | 47 [16-223] | 108 [36-453] | 0.005 |
| Left ventricular ejection fraction | 54±12 | 54±12 | 36±16 | <.001 | 48±16 | 54±12 | 0.028 | 54±12 | 46±16 | 0.006 |
| Coronary angiography | 1400 (88%) | 1358 (90%) | 42 (59%) | <.001 | 34 (92%) | 1366 (88%) | 0.794 | 1370 (88%) | 30 (88%) | 1.000 |
| Radial | 1020 (64%) | 1008 (74%) | 12 (29%) | <.001 | 12 (32%) | 1008 (65%) | <.001 | 1009 (65%) | 11 (32%) | <.001 |
| Multivessel disease | 247 (16%) | 230 (15%) | 17 (24%) | 0.046 | 11 (5%) | 236 (15%) | 0.016 | 238 (15%) | 9 (27%) | 0.076 |
| Percutaneous Coronary Intervention | 1132 (71%) | 1100 (73%) | 32 (45%) | <.001 | 32 (87%) | 1100 (71%) | 0.040 | 1106 (71%) | 26 (77%) | 0.506 |
| Drug eluting stent | 931 (59%) | 913 (61%) | 18 (25%) | <.001 | 18 (50%) | 913 (59%) | 0.255 | 916 (60%) | 15 (46%) | 0.104 |
| Glycoprotein IIB/IIIA inhibitors | 232 (15%) | 221 (15%) | 11 (16%) | 0.832 | 8 (22%) | 224 (15%) | 0.207 | 229 (15%) | 3 (9%) | 0.613 |
| Enoxaparin | 901 (57%) | 858 (57%) | 43 (61%) | 0.510 | 20 (54%) | 881 (57%) | 0.735 | 880 (57%) | 21 (62%) | 0.553 |
| Fondaparinux | 228 (14%) | 225 (15%) | 3 (4%) | 0.125 | 3 (8%) | 225 (15%) | 0.272 | 224 (14%) | 4 (12%) | 0.808 |
| Non fractionated heparin | 1352 (85%) | 1317 (87%) | 35 (49%) | <.001 | 33 (89%) | 1319 (85%) | 0.489 | 1323 (85%) | 29 (85%) | 0.987 |
| Bivalirudin | 2 (0.1%) | 2 (0.1%) | 0 (0%) | 1.000 | 0 (0%) | 2 (0.1%) | 1.000 | 2 (0.1%) | 0 (0%) | 1.000 |
| Aspirin | 1552 (98%) | 1481 (98%) | 71 (100%) | 0.402 | 35 (95%) | 1517 (98%) | 0.195 | 1521 (98%) | 31 (91%) | 0.037 |
| Clopidogrel | 1276 (80%) | 1205 (80%) | 70 (99%) | <.001 | 33 (89%) | 1243 (80%) | 0.173 | 1246 (81%) | 30 (88%) | 0.242 |
| Prasugrel | 233 (15%) | 231 (15%) | 2 (3%) | 0.004 | 1 (3%) | 232 (15%) | 0.037 | 232 (15%) | 1 (3%) | 0.049 |
| Ticagrelor | 199 (13%) | 198 (13%) | 1 (1%) | 0.004 | 2 (5%) | 197 (13%) | 0.310 | 199 (13%) | 0 (0%) | 0.017 |
| New antiplatelet | 430 (27%) | 427 (28%) | 3 (4%) | <.001 | 3 (8%) | 427 (28%) | 0.008 | 429 (28%) | 1 (3%) | 0.001 |
| GRACE risk score | 142 ± 44 | 139 ± 41 | 211± 53 | <.001 | 193 ± 45 | 141 ± 44 | <.001 | 141 ± 44 | 189 ± 39 | <.001 |
| CRUSADE risk score | 30 ± 16 | 29 ± 16 | 48 ± 16 | <.001 | 44 ± 16 | 30 ± 16 | <.001 | 30 ± 16 | 48 ± 15 | <.001 |
During the index hospitalization, 71 patients (4.5%) died, 37 patients (2.3%) had BARC MB: 18 (49%) type 3a, 16 (43%) type 3b and 3 (8%) type 5b; and 34 (2.1%) had CRUSADE MB. Table 1 lists the study patients’ characteristics according to the presence or absence of clinical events. Risk categories analyses of GRACE and CRUSADE risk scores examined as a function of clinical events revealed that there was a graded increase in all-cause mortality and MB with increasing GRACE and CRUSADE risk categories ( Figure 1 ).
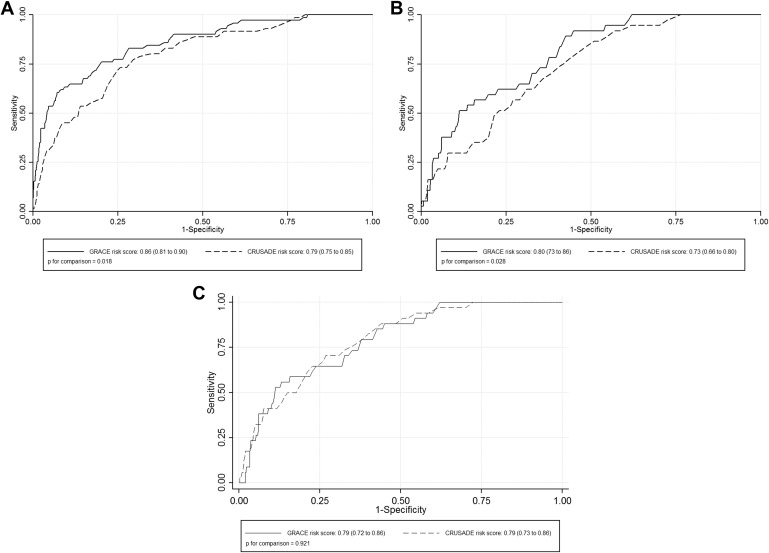
Tables 2 to 4 list the multivariate binary logistic regression analyses for both GRACE and CRUSADE risk score. In the whole population, receiver operating characteristic curves analyses showed that GRACE risk score has better discrimination capacity than CRUSADE risk score for both mortality and BARC MB and similar for CRUSADE MB ( Figure 2 ). Furthermore, subgroup analyses also revealed GRACE risk score to be superior to CRUSADE risk score for predicting both mortality and BARC MB. Calibration was acceptable for both scores in the whole population and in all ACS subgroups ( Table 5 ). Finally, reclassification analyses showed GRACE risk score was associated with a significant improvement in the predictive accuracy of CRUSADE risk score for predicting mortality (NRI: 22.5%, events correctly reclassified: −1.4%, no events correctly reclassified: 23.9%; p <0.001) and BARC MB (NRI: 17.6%, events correctly reclassified: 2.7%, no events correctly reclassified: 14.9%; p = 0.033) but not for CRUSADE MB (NRI: 0%, p = 0.987).
| Variable | In-hospital mortality | |||
|---|---|---|---|---|
| Univariate | Multivariate | |||
| Odds Ratio | p | Odds Ratio | p | |
| Current smoking | 0.55 (0.30-0.99) | 0.047 | – | 0.354 |
| Chronic heart failure | 2.44 (1.13-5.27) | 0.023 | – | 0.237 |
| Peripheral artery disease | 2.08 (1.04-4.16) | 0.040 | – | 0.959 |
| Atrial fibrillation/flutter | 3.69 (2.23-6.12) | <.001 | 2.03 (0.99-4.18) | 0.055 |
| Radial access | 0.14 (0.07-0.27) | <.001 | 2.67 (1.19-5.99) | 0.017 |
| Multivessel disease | 1.76 (1.01-3.09) | 0.049 | 1.99 (0.98-4.05) | 0.057 |
| Percutaneous coronary intervention | 0.31 (0.19-0.50) | <.001 | – | 0.157 |
| Drug eluting stent | 0.22 (0.13-0.38) | <.001 | 0.48 (0.22-1.06) | 0.070 |
| Non fractionated heparin | 0.15 (0.09-0.24) | <.001 | – | 0.107 |
| New antiplatelet | 0.11 (0.04-0.36) | <.001 | 0.10 (0.01-0.76) | 0.026 |
| CRUSADE (× point) | 1.07 (1.06-1.09) | <.001 | 1.06 (1.04-1.08) | <.001 |
| GRACE (× 10 points) | 1.38 (1.30-1.46) | <.001 | 1.36 (1.25-1.48) | <.001 |
| Combined model | ||||
| GRACE (× 10 points) | – | – | 1.26 (1.23-1.50) | <.001 |
| CRUSADE (× point) | – | – | – | 0.893 |
| Variable | BARC bleeding | |||
|---|---|---|---|---|
| Univariate | Multivariate | |||
| Odds Ratio | p | Odds Ratio | p | |
| Atrial fibrillation/flutter | 3.74 (1.89-7.37) | <.001 | 2.17 (1.00-4.69) | 0.05 |
| Chronic obstructive pulmonary disease | 2.52 (1.13-5.61) | 0.024 | 2.73 (1.15-6.46) | 0.022 |
| Radial access | 0.19 (0.01-0.40) | <.001 | 2.76 (1.25-6.11) | 0.012 |
| Multivessel disease | 2.36 (1.15-4.83) | 0.019 | – | 0.628 |
| Percutaneous coronary intervention | 2.61 (1.01-6.75) | 0.047 | 4.27 (0.99-18.4) | 0.051 |
| New antiplatelet | 0.23 (0.07-0.76) | 0.015 | 0.24 (0.05-1.05) | 0.057 |
| GRACE (× 10 points) | 1.23 (1.16-1.31) | <.001 | 1.15 (1.07-1.24) | <.001 |
| CRUSADE (× point) | 1.05 (1.03-1.07) | <.001 | 1.04 (1.01-1.06) | 0.002 |
| Combined model | ||||
| GRACE (× 10 points) | – | – | 1.26 (1.23-1.50) | <.001 |
| CRUSADE (× point) | – | – | – | 0.893 |
| Variable | CRUSADE bleeding | |||
|---|---|---|---|---|
| Univariate | Multivariate | |||
| Odds Ratio | p | Odds Ratio | p | |
| Hypertension | 4.01 (1.22-13.18) | 0.022 | – | 0.433 |
| Chronic heart failure | 4.11 (1.65-10.22) | 0.002 | – | 0.512 |
| Atrial fibrillation/flutter | 4.88 (2.44-9.76) | <.001 | 2.83 (1.31-6.12) | 0.008 |
| Radial access | 0.21 (0.09-0.44) | <.001 | 2.69 (1.21-5.97) | 0.015 |
| New antiplatelet | 0.08 (0.01-0.579) | 0.012 | 0.10 (0.02-1.11) | 0.081 |
| GRACE (× 10 points) | 1.21 (1.14-1.29) | <.001 | 1.14 (1.05-1.23) | 0.001 |
| CRUSADE (× point) | 1.07 (1.05-1.09) | <.001 | 1.05 (1.02-1.08) | <0.001 |
| Combined model | ||||
| GRACE (× 10 points) | – | – | 1.10 (1.01-1.21) | 0.031 |
| CRUSADE (× point) | – | – | – | 0.167 |
Stay updated, free articles. Join our Telegram channel

Full access? Get Clinical Tree


