We examined right ventricular (RV) and ascending pulmonary artery (PA1) dimensions in adults with osteogenesis imperfecta (OI). The survey included 99 adults with OI divided in 3 clinical types (I, III, and IV) and 52 controls. RV and PA1 dimensions were measured by echocardiography and indexed for body surface area. Scoliosis was registered, and spirometry was performed in 75 patients with OI. All RV dimensions indexed by body surface area were significantly larger in the OI group compared to controls (RV basal dimension 1.9 ± 0.5 vs 1.7 ± 0.3 cm/m 2 , p <0.05; RV midcavity dimension 1.7 ± 0.5 vs 1.5 ± 0.3 cm/m 2 , p <0.05; RV longitudinal dimension 4.3 ± 1.1 vs 4.0 ± 0.9 cm/m 2 , p <0.05). RV outflow tract (RVOT) proximal diameter (1.8 ± 0.4 vs 1.5 ± 0.2 cm/m 2 , p <0.05), RVOT distal diameter (1.2 ± 0.2 vs 1.0 ± 0.1 cm/m 2 , p <0.05), and PA1 (1.2 ± 0.3 vs 1.0 ± 0.2 cm/m 2 , p <0.05) were also significantly larger in the OI group. Furthermore, all RV dimensions and PA1 were significantly larger in patients with OI type III compared to patients with OI types I and IV and controls. There were no differences in RV, RVOT, or PA1 dimensions between patients presenting a restrictive ventilatory pattern (n = 11) and patients a normal ventilatory pattern. Scoliosis was registered in 42 patients. Patients with OI type III had greater RV and PA1 dimensions compared to controls and patients with OI types I and IV. Impaired ventilatory patterns and scoliosis did not have any impact on RV dimensions in these patients. In conclusion, patients with OI had increased RV and PA1 dimensions compared to the control group.
Although there are a few case reports, no investigations have been performed to study if similar alterations are present on the right side of the heart as on the left side. Because skeletal abnormalities are frequently present in these patients and secondary restrictive pulmonary changes have been demonstrated, it is reasonable to hypothesize that this may have a negative impact on the right ventricle and ascending pulmonary artery (PA1). The aim of the present study was to focus on cardiovascular abnormalities on the right side of the heart in adults with osteogenesis imperfecta (OI). Echocardiography was used to investigate if the right ventricle, right ventricular (RV) lateral wall, and PA1 dimensions were increased in these patients. Another aim was to explore if skeletal abnormalities or pulmonary function might have an influence on these changes and if patients with OI had an increased frequency of tricuspid and pulmonic valve regurgitations.
Methods
The present study was part of a national survey organized in cooperation with the National Resource Center for Rare Disorders. There were 259 patients with OI registered in the National Resource Center for Rare Disorders, and 154 were ≥25 years old. Ninety-nine of the adult patients agreed to be examined at the department of cardiology (Oslo University Hospital, Aker, Norway) from June 2003 through October 2007. The OI group consisted of 57 women and 42 men with an average age of 44 years (range 25 to 83). We used the same data register as in the main study and the study population was identical to the population in our previous study on the aorta and left ventricle. The 52 controls matched for age and gender did not have any history of cardiovascular disease, hypertension, diabetes, or use of cardiac medications and were recruited by advertisement in the local newspaper and at our hospital. The criteria of Sillence et al were used to classify OI in 3 types: I and IV are relatively mild and III has a more severe clinical course. One patient did not meet the classification criteria and was not included in subgroup analyses. The study was approved by the regional ethical committee and written informed consent was obtained from all participants.
All study subjects were examined, medical histories were taken, 3 separate blood pressure measurements were obtained, and mean arterial pressure was calculated. Standard echocardiography was performed with a Vivid 7 echocardiograph (GE Vingmed Ultrasound, Horten, Norway). Data were transferred to a personal computer, and EchoPac PC SW 6.1.2 (GE Vingmed Ultrasound) was used to analyze the data. The same cardiologist (Z.R.) completed all examinations and analyses. All recordings were blinded before measurements, and all measurements of RV were indexed for body surface area. Recordings and assessments of RV and PA1 dimensions were performed in accordance with American Society of Echocardiography guidelines. Images and loops were recorded in the supine and left lateral decubitus positions at end-diastole and ≥3 consecutive loops were recorded and measured: RV wall thickness from the subcostal 4-chamber view at the tip level of the anterior tricuspid leaflet, RV basal dimension, RV midcavity dimension, RV longitudinal dimension, and RV end-diastolic area (RVA) were measured from an apical 4-chamber view. RV outflow tract (RVOT) proximal diameter from the anterior aortic wall to the RV free wall above the aortic valve, RVOT distal diameter just proximal to the pulmonic valve, and PA1 dimension between the pulmonic valve and bifurcation point were measured from the short-axis view.
Peak tricuspid regurgitation velocity (TRV) was obtained by continuous-wave Doppler across the tricuspid valve as a measurement for the systolic pressure difference between the right ventricle and right atrium and was measured preferentially in 3 consecutive beats and averaged; 2 beats (average) or 1 beat were used if these were the only representative recordings. PA pressure was then calculated according to the continuous equation, and 5 mm Hg (anticipated pressure in the right atrium) was added for all participants. All detectable TRs and pulmonic regurgitations were included and categorized as mild, moderate, or severe according to American Society of Echocardiography guidelines.
Spirometry was performed according to guidelines of the American Thoracic Society/European Respiratory Society. Predicted lung volumes were calculated using height calculated from the arm span according to the formula of Parker et al. Forced vital capacity, forced expiratory volume in 1 second, and the ratio of forced expiratory volume in 1 second to forced vital capacity were measured in 75 patients. Total lung capacity was measured in 61 patients. Measurements were expressed as percent predicted normal values. According to American Thoracic Society/European Respiratory Society guidelines, obstructive pulmonary disease was considered when forced expiratory volume in 1 second/forced vital capacity was <0.7. Restrictive pulmonary disease was defined as forced expiratory volume in 1 second/forced vital capacity >0.80 and total lung capacity <80% or forced vital capacity <80%. Severity of the restrictive pattern was classified as mild (forced vital capacity 65% to 80% of predicted value), moderate (forced vital capacity 51% to 64% of predicted value), and severe (forced vital capacity ≤50% of predicted value). Severity of the obstructive pattern was classified as mild (forced expiratory volume in 1 second 65% to 80% of predicted value), moderate (forced expiratory volume in 1 second 51% to 64% of predicted value), and severe (forced expiratory volume in 1 second ≤50% of predicted value).
In a recent study on the same OI population, scoliosis was registered in 42 patients (46%) and deformities of the spine in 53 patients (55%). Pulmonary test findings and scoliosis data presented in the present study were also used by the same research group in another study addressing the impact of vertebral deformities and scoliosis on pulmonary function (Wekre LL et al. Spinal cord deformities and lung function in adults with osteogenesis imperfecta. Spine 2011; submitted for publication).
Continuous variables are presented as mean ± SD. Chi-square and Fisher’s exact tests were used to assess differences in proportions between OI subgroups and controls. Differences in 2 means and among 4 groups were tested by 2 independent-sample t tests and 1-way analyses of variance. Impact of different independent variables was determined by simple and multiple linear regression models in which influences of confounding variables on the difference between patients with OI and controls were studied. In addition to OI, gender and age were chosen because of their general importance for cardiac dimensions, mean arterial pressure according to the previously demonstrated importance for the left ventricle and aorta in these patients, and TRV because of its equality to PA pressure and thus possible influence on right heart dimensions. Influence of pulmonal function test results and scoliosis data were performed by simple linear regression analysis because these were measured only in the patient group. Intraclass correlation coefficients for RV basal dimension, RV midcavity dimension, RV longitudinal dimension, RV end-diastolic area, and RVOT proximal diameter were used for testing data reproducibility in 10 random selected patients with OI. Measurements were performed by 1 of the authors (Z.R.) and a colleague from our echocardiographic laboratory. SPSS 18.0 (PASW Statistics 18, IBM Corporation, Armonk, New York) was used for the analyses. Two-sided p values <0.05 were considered statistically significant.
Results
Patients with OI and controls were matched by age (43.9 ± 12.3 vs 43.7 ± 13.9 years, respectively). Mean arterial pressure was significantly higher in the OI group compared to controls (98 ± 12 vs 90 ± 9 mm Hg, p <0.05). Body surface area was significantly smaller in the OI group than in the control group (1.65 ± 0.31 vs 1.86 ± 0.2 m 2 , p <0.05), and patients with OI type III had a smaller body surface area (97 ± 0.19 m 2 ) compared to those with OI type I (1.73 ± 0.19 m 2 , p <0.05) and type IV (1.68 ± 0.26 m 2 , p <0.05).
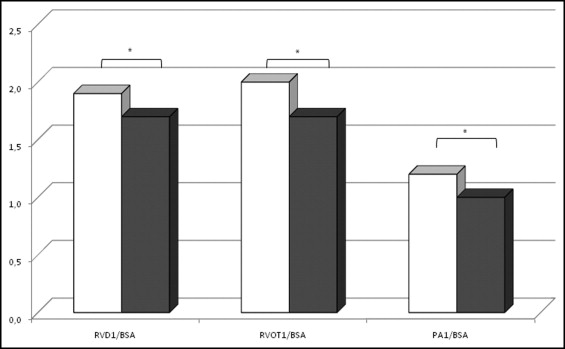
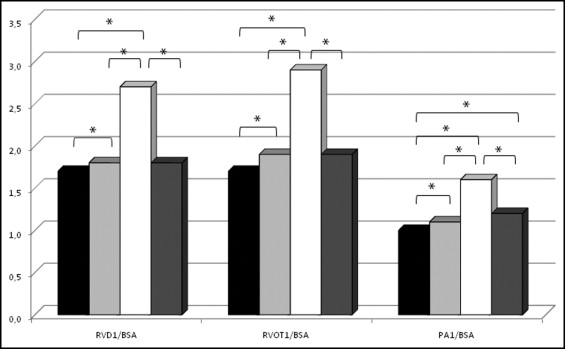
Absolute RV, RVOT, and PA1 values showed no significant differences between the OI and control group except for RV end-diastolic area (14.3 ± 3.5 vs 16.0 ± 4.0 cm 2 , p <0.05) and RV longitudinal dimension (6.8 ± 0.7 vs 7.3 ± 0.7 cm, p <0.05), respectively, which were significantly larger in the control group. When the 3 RV, 2 RVOT, and PA1 diameters were indexed to body surface area, all were significantly increased in patients with OI compared to controls ( Table 1 and Figure 1 ) . RV, RVOT, and PA1 dimensions were significantly larger in patients with OI type III compared to controls and patients with the other 2 OI types ( Table 1 and Figure 2 ) .
| OI (n = 99) | Controls (n = 52) | OI Type I (n = 77) | OI Type III (n = 10) | OI Type IV (n = 11) | ||||||
|---|---|---|---|---|---|---|---|---|---|---|
| Mean ± SD | Subjects (%) | Mean ± SD | Subjects (%) | Mean ± SD | Subjects (%) | Mean ± SD | Subjects (%) | Mean ± SD | Subjects (%) | |
| Right ventricular basal diameter/body surface area (cm/m 2 ) | 9.0 ± 2.4 | 76 (77%) | 8.6 ± 1.7 | 42 (81%) | 8.7 ± 1.9 | 58 (75%) | 12.0 ± 3.6 ‡ ‖ ¶ | 9 (90%) | 8.0 ± 2.0 | 8 (73%) |
| Right ventricular midcavity diameter/body surface area (cm/m 2 ) | 1.9 ± 0.5 ⁎ | 96 (97%) | 1.7 ± 0.3 | 51 (98%) | 1.8 ± 0.4 † | 75 (97%) | 2.7 ± 0.4 ‡ ‖ ¶ | 9 (90%) | 1.8 ± 0.4 | 11 (100%) |
| Right ventricular longitudinal diameter/body surface area (cm/m 2 ) | 1.7 ± 0.5 ⁎ | 88 (89%) | 1.5 ± 0.3 | 48 (92%) | 1.6 ± 0.4 | 68 (88%) | 2.4 ± 0.3 ‡ ‖ ¶ | 9 (90%) | 1.6 ± 0.5 | 10 (91%) |
| Right ventricular outflow tract proximal diameter/body surface area (cm/m 2 ) | 4.3 ± 1.1 ⁎ | 91 (92%) | 4.0 ± 0.5 | 50 (96%) | 4.0 ± 0.5 | 70 (91%) | 6.7 ± 1.4 ‡ ‖ ¶ | 9 (90%) | 4.2 ± 0.9 | 11 (100%) |
| Right ventricular outflow tract distal diameter/body surface area (cm/m 2 ) | 1.8 ± 0.4 ⁎ | 76 (77%) | 1.5 ± 0.2 | 48 (92%) | 1.7 ± 0.3 † | 61 (79%) | 2.6 ± 0.4 ‡ ‖ ¶ | 7 (70%) | 1.7 ± 0.4 § | 8 (73%) |
| Ascending pulmonary artery diameter/body surface area (cm/m 2 ) | 1.2 ± 0.3 ⁎ | 76 (77%) | 1.0 ± 0.1 | 46 (88%) | 1.1 ± 0.2 † | 61 (79%) | 1.7 ± 0.3 ‡ ‖ ¶ | 7 (70%) | 1.2 ± 0.2 § | 8 (73%) |
| Right ventricular basal diameter/body surface area (cm/m 2 ) | 1.2 ± 0.3 ⁎ | 65 (66%) | 1.0 ± 0.2 | 43 (83%) | 1.1 ± 0.2 † | 52 (53%) | 1.8 ± 0.3 ‡ ‖ ¶ | 5 (50%) | 1.2 ± 0.2 § | 8 (73%) |
⁎ p <0.05, osteogenesis imperfecta versus control.
† p <0.05, osteogenesis imperfecta type I versus control.
‡ p <0.05, osteogenesis imperfecta type III versus control.
§ p <0.05, osteogenesis imperfecta type IV versus control.
‖ p <0.05, osteogenesis imperfecta type IV versus type III.
Simple linear regression analysis of RV and PA1 indexed dimensions showed that OI was significant confounder for the 3 RV, 2 RVOT, and PA1 dimensions ( Table 2 ). In a multiple regression analysis mode including OI, gender, mean arterial pressure, TRV, and age, OI was independently associated with indexed RV, RVOT, and PA1 dimensions ( Table 3 ). RV lateral wall thickness adjusted for body surface area showed no differences between the OI (n = 33) and control group (21 ± 0.06 vs 0.18 ± 0.04 cm/m 2 , p = 0.07, respectively).
| Dependent Variables | Independent Variables, Beta (95% CI) | ||||
|---|---|---|---|---|---|
| Gender | Age | MAP | OI | TRV | |
| Right ventricular basal diameter/body surface area | −0.157 (−0.298 to −0.017) ⁎ | 0.000 (−0.006 to 0.005) † | 0.004 (−0.002 to 0.010) † | −0.221 (−0.366 to −0.077) ⁎ | 0.067 (−0.205 to 0.339) † |
| Right ventricular midcavity diameter/body surface area | −0.035 (−0.178 to 107) † | −0.005 (−0.010 to 0.001) † | 0.000 (−0.007 to 0.006) † | −0.163 (−0.307 to −0.019) ⁎ | 0.014 (−0.262 to 0.290) † |
| Right ventricular longitudinal diameter/body surface area | −0.290 (−0.594 to 0.014) † | −0.016 (−0.028 to −0.004) ⁎ | −0.000 (−0.013 to 0.013) † | −0.319 (−0.633 to −0.005) ⁎ | −0.311 (−0.914 to 0.292) † |
| Right ventricular outflow tract proximal diameter/body surface area | −0.066 (−0.189 to 0.058) † | 0.001 (−0.004 to 0.007) † | 0.002 (−0.004 to 0.008) † | −0.274 (−0.392 to −0.157) ⁎ | −0.050 (−0.302 to 0.202) † |
| Right ventricular outflow tract distal diameter/body surface area | −0.056 (−0.139 to 0.028) † | 0.001 (−0.002 to 0.005) † | 0.002 (−0.002 to 0.006) † | −0.179 (−0.258 to −0.099) ⁎ | −0.046 (−0.215 to 0.123) † |
| Ascending pulmonary artery diameter/body surface area | −0.073 (−0.162 to 0.015) † | 0.003 (−0.001 to 0.007) † | 0.003 (−0.001 to 0.007) † | −0.140 (−0.226 to −0.053) ⁎ | 0.048 (−0.133 to 0.229) † |
| Dependent Variables | Independent Variables, Beta (95% CI) | ||||
|---|---|---|---|---|---|
| Gender | Age | MAP | OI | TRV | |
| Right ventricular basal diameter/body surface area | −0.165 (−0.314 to −0.016) ⁎ | 0.003 (−0.003 to 0.008) † | 0.002 (−0.005 to 0.010) † | −0.219 (−0.373 to −0.066) ⁎ | 0.054 (−0.222 to 0.329) † |
| Right ventricular midcavity diameter/body surface area | 0.004 (−0.149 to 0.156) † | −0.001 (−0.007 to 0.005) † | 0.000 (−0.007 to 0.008) † | −0.194 (−0.350 to −0.038) ⁎ | −0.023 (−0.311 to 0.265) † |
| Right ventricular longitudinal diameter/body surface area | −0.217 (−0.549 to 0.115) † | −0.002 (−0.015 to 0.011) † | 0.005 (−0.010 to 0.020) † | −0.319 (−0.633 to −0.005) ⁎ | −0.309 (−0.930 to 0.311) † |
| Right ventricular outflow tract proximal diameter/body surface area | −0.063 (−0.218 to 0.091) † | 0.000 (−0.006 to 0.006) † | −0.001 (−0.008 to 0.005) † | −0.360 (−0.516 to −0.203) ⁎ | 0.058 (−0.234 to 0.350) † |
| Right ventricular outflow tract distal diameter/body surface area | −0.059 (−0.160 to 0.042) † | 0.001 (−0.003 to 0.004) † | 0.001 (−0.003 to 0.006) † | −0.149 (−0.252 to −0.045) ⁎ | 0.088 (−0.104 to 0.279) † |
| Ascending pulmonary artery diameter/body surface area | −0.085 (−0.191 to 0.020) † | 0.002 (−0.002 to 0.007) † | 0.002 (−0.003 to 0.007) † | 0.125 (−0.072 to 0.323) † | −0.179 (−0.285 to −0.073) ⁎ |
Stay updated, free articles. Join our Telegram channel

Full access? Get Clinical Tree


