9 Research Techniques
Research techniques have been and continue to be of great value in understanding common problems in cardiology. Many clinical methods that were once solely limited to the research arena now have been incorporated into routine diagnostic cardiac catheterization, such as fractional flow reserve and intravascular ultrasound (IVUS). This chapter is an overview of commonly used research procedures in the cardiac catheterization laboratory (Tables 9-1 and 9-2).
| Objective | Method |
|---|---|
| I. Ventricular Function | |
| 1. Systolic function | Ventricular P-V relationship (simultaneous LV pressure with LV volume by echocardiogram, contrast angiogram, nuclear angiogram, or impedance catheter) |
| 2. Diastolic function | |
| 3. Exercise studies | |
| 4. Combined hemodynamic and echocardiographic studies | |
| II. Myocardial Blood Flow (Coronary Vasodilatory Reserve, Effects of Drugs) | |
| III. Endothelial Function | |
| 1. QCA | |
| 2. Doppler flow | |
| 3. QCA | |
| IV. Electrical Function (Abnormal Conduction, Excitation) | |
IVUS, Intravascular ultrasound; LV, left ventricular; P-V, pressure-volume; QCA, quantitative coronary angiography.
Table 9-2 Additional Research Techniques in the Catheterization Laboratory
| LV Function | Methods |
|---|---|
| Pressure-Volume Relationships | |
| End systole | High-fidelity pressure |
| End diastole | |
| Wall Stress | |
| LV mass | Quantitative ventriculography |
| Diastolic function | |
| Ventricular interaction | RV/LV high-fidelity pressures |
| Aortic impedance | Aortic flow velocity, high-fidelity pressure |
| Coronary Physiology | |
| Coronary blood flow, coronary reserve, coronary vasodilation (response to drugs) | |
| Ischemia Testing | |
| Induced tachycardia | Electrophysiologic study |
| Isoproterenol, dopamine | Pharmacologic infusion |
| Transient coronary occlusion | Coronary angioplasty |
LV, Left ventricular; RV, right ventricular.
Quantitative Coronary and Left Ventricular Angiography
Quantitative Coronary Angiography
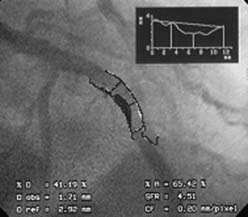
QCA can be performed using digital (or hand-held) calipers or, more commonly, computer-generated automated edge detection systems. For exact measurements, image calibration is required from an object with known dimensions, most commonly a contrast-filled coronary catheter. The catheter image is enlarged for measurement of its diameter to generate a calibration factor (mm/pixel), which is used to calculate vessel lumen size. QCA software then examines brightness values in the area of interest and uses digital algorithms to calculate vessel diameter from automatic border detection from operator selected center lines. Commonly used variables obtained from QCA are minimal lumen diameter (MLD), reference vessel diameter, acute lumen gain (final MLD – baseline MLD) after percutaneous coronary intervention (PCI), late lumen loss (follow-up MLD – final MLD) after PCI, and percent diameter stenosis (Fig. 9-1).
Quantitative Ventriculography
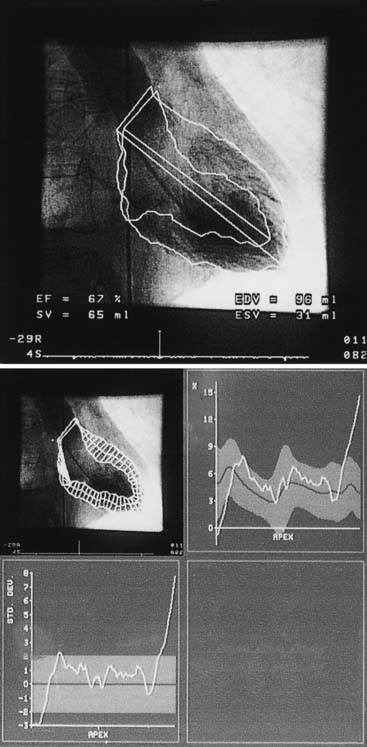
Quantitative ventriculography is best performed with biplane imaging using a 60-degree straight left anterior oblique projection and a 30-degree right anterior oblique projection. The end-diastolic and end-systolic frames of a completely opacified ventricle during a nonectopic beat are examined using the centerline chord method. In this method, chords perpendicular to a centerline in a frame halfway between end-systolic and end-diastolic images are created, and then normalized to the end-diastolic perimeter. Regional wall motion is quantified on the basis of the degree of local chord shortening (positive values = hyperkinesis; negative values = hypokinesis) (Fig. 9-2).
Quantitative Coronary Flow
Doppler Coronary Flow Velocities
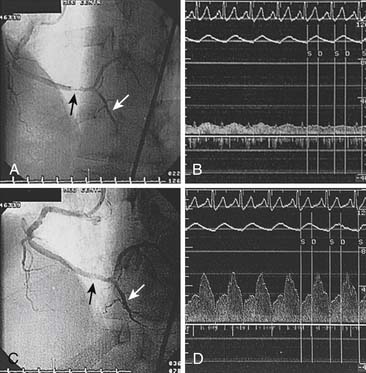
Coronary flow reserve (maximal coronary blood flow/resting coronary blood flow) is a global measure of vasodilation and is affected by epicardial and microvascular circulatory abnormalities (Fig. 9-3). Coronary vasodilator reserve was historically measured by coronary sinus blood flow with the use of continuous thermodilution technique. Quantitative coronary flow is determined from intracoronary arterial flow velocity using 0.014-inch Doppler-tipped sensor guidewires. In the Doppler technique, quantitative measurement of coronary flow is obtained from the use of pulsed sound waves (12 to 15 mHz) and measurement of the returning signal reflecting off moving red blood cells (Fig. 9-4). The Doppler guidewire can also be coupled with a pressure sensor (Fig. 9-5) to measure simultaneous poststenotic coronary pressure and flow. Measurement of the physiologic response of the coronary circulation to various drugs, maneuvers, and interventions, as well as assessment of the significance of coronary obstructive lesions before and after revascularization are examples of useful applications (Table 9-3). The measurement of volumetric changes in coronary blood flow can be combined with measurement of myocardial oxygen consumption (arterial and coronary sinus blood) to identify whether increases in blood flow are caused by increased myocardial oxygen demand (i.e., metabolic regulation) or by pharmacologic changes independent of myocardial demand (e.g., primary artery vasodilation or constriction).
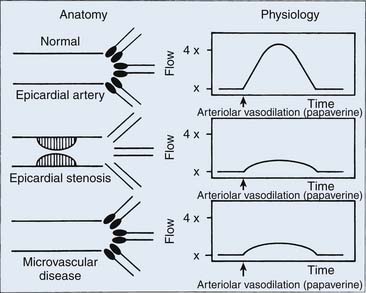
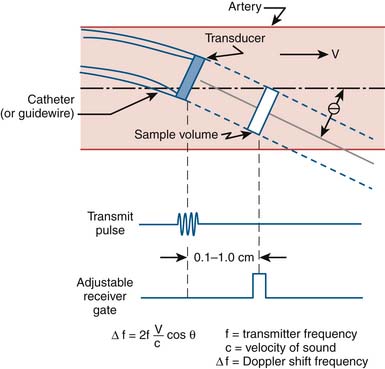
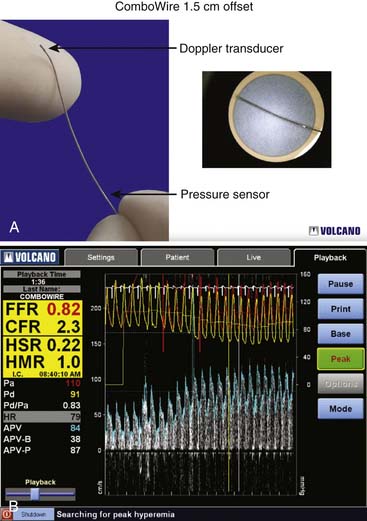
Table 9-3 Uses of the Doppler FloWire
| Coronary vasodilatory reserve assessment |
| Collateral flow studies |
| Coronary flow research studies |
Doppler Methodology and Setup
Setting up of the Doppler wire system usually takes less than 10 minutes. The timing of the reflected sound waves is used to measure blood flow velocities from moving red blood cells in a sample area that is 5 mm from the tip of the wire (and 2 mm across), far enough away so that blood velocity is not affected by the wake of the wire. The returning signal is transmitted in real time to the display console. The gray-scale spectral scrolling display shows the velocities of all the red blood cells within the sample volume. The key parameters are derived from the automatically tracked peak blood velocities, making them less sensitive to position (Fig. 9-6).
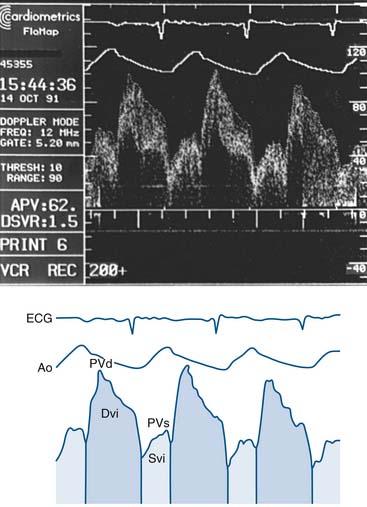
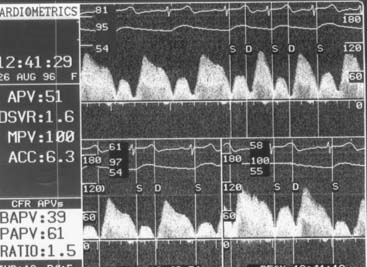
The Doppler guidewire has a forward-directed ultrasound beam that diverges in a 27-degree arc from the long axis (measured in the -6 dB roundtrip points of the ultrasound beam pattern). The pulse repetition frequency of greater than 40 Hz, pulse duration of +0.83 second, and sampling delay of 6.5 seconds are standard for clinical use. The system is coupled to a real-time spectrum analyzer, videocassette recorder, and video page printer. The spectrum analyzer uses online fast-Fourier transformation to process the Doppler audio signals. Simultaneous electrocardiographic and arterial pressure data are also displayed (Fig. 9-7). In vivo testing has demonstrated excellent correlation of the Doppler guidewire–measured velocity with electromagnetic measurements of flow velocity and volumetric flow.
Before the Doppler guidewire is placed into an artery, the patient should be given intravenous (IV) heparin (40 to 60 U/kg with target activated coagulation time >200 seconds). After diagnostic angiography or during angioplasty, the Doppler guidewire is passed through a standard angioplasty Y connector attached to a guiding catheter. The guidewire is advanced into the artery and beyond the target location (e.g., stenosis) by a distance equal or greater than 5 to 10 times the arterial diameter (approximately 2 cm). Placement in any side branches is avoided. Distal flow velocity data are obtained at rest and during hyperemia (Figs. 9-8 and 9-9).
Coronary Flow Reserve
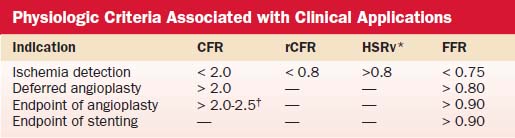
Hyperemic measurements are obtained by intracoronary injections of adenosine (24 to 30 μg in the right coronary artery and 24 to 40 μg in the left coronary artery). Coronary flow reserve is computed as the ratio of hyperemic and basal mean flow velocities. Normal coronary flow reserve is more than 2.0. Comparisons of coronary flow reserve and fractional flow reserve for detection of ischemia based on noninvasive testing as a gold standard are shown in Table 9-4.
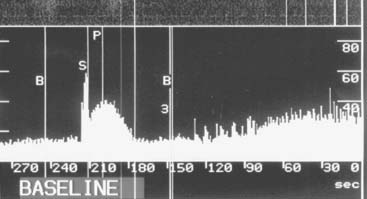
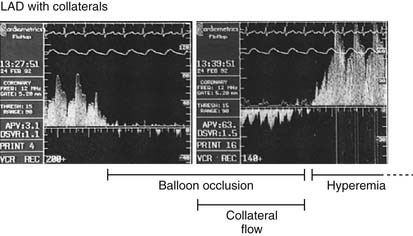
Measurement of Collateral Circulation
Coronary collateral flow can be measured with the use of the Doppler-tipped flow wire (Fig. 9-10) and pressure wire. A 0.014-inch pressure wire is set at 0, calibrated, and advanced through a balloon catheter and positioned in the vessel of interest. Collateral flow is measured by simultaneous measurement of mean aortic pressure (Pao, mm Hg), coronary occlusion pressure (Poccl, mm Hg), and central venous pressure (CVP, mm Hg). Collateral flow is calculated as (Poccl- CVP)/(Pao-CVP).
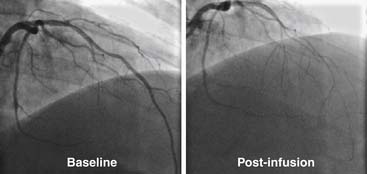
Coronary Endothelial Function Assessment
In this procedure, an infusion catheter containing the Doppler wire is placed in the artery using standard techniques. Following baseline measurements of flow (i.e., velocity via the Doppler wire times area via quantitative measurement of the coronary diameter), graduated infusions of acetylcholine (10-6 M to 10-4 M) are administered directly into the coronary artery. In patients with normal endothelial function, acetylcholine infusion causes endothelial-dependent production of nitric oxide and results in vasodilatation (i.e., epicardial vasodilatation and/or increase in Doppler flow velocity; Fig. 9-11). Conversely, in patients with dysfunctional endothelium, coronary flow either fails to increase or falls because of vasoconstriction, which manifests either as blunting of the rise or an actual fall in Doppler flow velocity. Angiography is used to determine the presence of vasoconstriction, which should be treated promptly with intracoronary vasodilator therapy (e.g., calcium-channel blocker or nitrates).