3 Hemodynamic Data and Basic Electrocardiography
Pressure Waves in the Heart
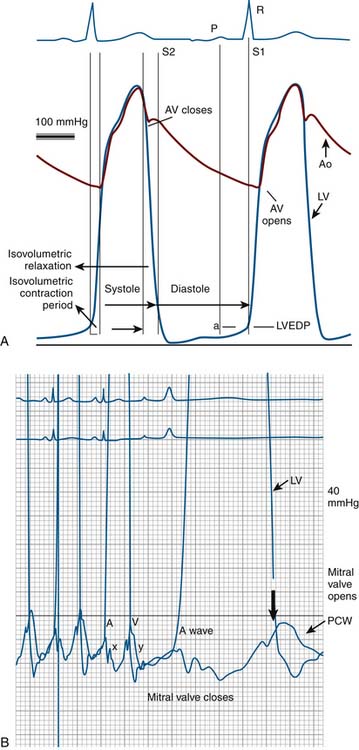
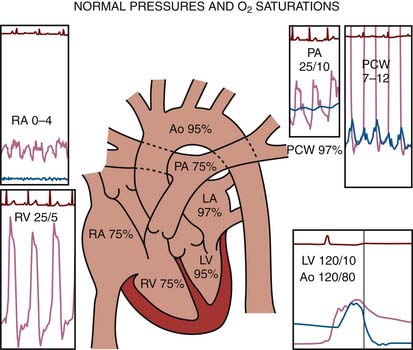
Blood within the heart or vessels exerts pressure. A pressure wave is created by cardiac muscular contraction and is transmitted from the vessel or chamber along a closed, fluid-filled column (catheter) to a pressure transducer, which converts the mechanical pressure to an electrical signal that is displayed on a video monitor. Cardiac pressure waveforms are cyclical, repeating the pressure change from the onset of one cardiac contraction (systole) to the onset of the next contraction. The complete description of the physiology of heart function is beyond the scope of this book, but an examination of the diagram of the cardiac cycle and corresponding pressures (Figs. 3-1 and 3-2) provides an understanding of basic hemodynamics in the cardiac catheterization laboratory.
The collection of hemodynamic data is an integral part of every catheterization protocol. Even complex hemodynamic data recording can be accomplished accurately and rapidly if an efficient and consistently used method is established in the laboratory. One measurement sequence used in our laboratory (Tables 3-1, 3-2, and 3-3) is an example of one method. This sequence facilitates simultaneous pressure measurements across the heart, concentrating on the aortic (Ao) and mitral valves, which are the most commonly affected by disease. Of all hemodynamic questions, 90% can be answered by examining data collected in this way. As with most brief formulas this technique is not all-inclusive. Different hemodynamic measurements for specific clinical situations are necessary. Specific examples are included in the case studies.
Table 3-1 Right-Sided Heart Catheterization Protocol
∗ Only 1 to 2 drops of heparin should be aspirated and flushed out of 1- to 3-ml heparinized syringes.
Table 3-2 Left-Sided Heart Catheterization Protocol∗
Matching peripheral to central aortic pressure Pigtail catheter inserted through arterial sheath (sheath should be one French size larger than catheter) |
∗ Right-sided heart hemodynamic studies often precede left-sided heart studies. Simultaneous pressures of the left and right sides of the heart provide the most precise and accurate information.
† 100 mm/sec sweep speed if aortic valve gradient present.
Table 3-3 Combined Hemodynamic Measurements of the Left and Right Sides of the Heart
The routine collection of hemodynamic data from the right and left sides of the heart with appropriate sampling of blood for oxygen saturations and CO measurements can be accomplished in less than 30 minutes. CO by the thermodilution technique is routine. The Fick CO method using a measured or assumed oxygen consumption calculation is often used for valvular lesions. Arterial, vena caval, right atrial (RA), and pulmonary artery (PA) oxygen saturations are collected routinely throughout the right and left sides of the heart for intracardiac shunt identification.
Right- and Left-Sided Heart Catheterization
The protocol used during right-sided heart catheterization is summarized in Table 3-1. Right-sided heart catheterization is performed for specific indications. Right-sided heart catheterization is indicated for patients with a history of dyspnea, valvular heart disease, or intracardiac shunts. Patients with a history of pulmonary edema occurring on a previous hospital admission often have only dyspnea with no objective evidence of left ventricular (LV) dysfunction (e.g., chest film, echocardiography). Dyspnea caused by lung disease cannot be differentiated from that caused by pulmonary hypertension or LV dysfunction.
Complications of Right-Sided Heart Catheterization
The most common problem during right-sided heart catheterization is arrhythmia resulting from stimulation of the right ventricular (RV) outflow tract, which may result in ventricular tachycardia (VT), atrioventricular (AV) block or, rarely, right bundle-branch block (Table 3-4). Significant but transient ventricular arrhythmias occur in 30% to 60% of patients who undergo right-sided heart catheterization and are self-limited and do not require treatment. The arrhythmia is terminated when the catheter is readjusted. Sustained ventricular arrhythmias have been reported, especially in unstable patients or patients with electrolyte imbalance, acidosis, or concurrent myocardial ischemia. The prophylactic use of lidocaine is not necessary. In patients with left bundle-branch block, a temporary pacemaker may be necessary if right bundle-branch block occurs during right-sided heart catheterization.
Table 3-4 Cardiac Shunt Locations
| Location | Earliest Step-Up Location (for Left-to-Right Shunts) |
|---|---|
| Atrial Septal Defects | |
| Primum (low) | RA, RV |
| Secundum (mid) | RA |
| Sinus venosus (high) | RA |
| Partial anomalous pulmonary venous return (pulmonary veins entering right atrium) | RA |
| Ventricular Septal Defects | |
| Membranous (high) | RV |
| Muscular (mid) | RV |
| Apical (low) | RV |
| Aorticopulmonary window (connection of aorta to pulmonary artery) | PA |
| Patent ductus arteriosus (normally closed Ao-PA connection at birth) | PA |
Ao, Aortic; PA, pulmonary artery; RA, right atrium; RV, right ventricle.
Use of Pulmonary Wedge Pressure
Rules for obtaining an accurate PCW pressure that agrees with LA pressure are as follows:
Left-Sided Heart Catheterization
The protocol for left-sided heart catheterization is summarized in Table 3-2. Indications for left-sided heart catheterization are summarized in Chapter 1. A combined right-side and left-side heart protocol is a precise and complete method of addressing the most common hemodynamic problems in the catheterization laboratory (see Table 3-3).
Computations for Hemodynamic Measurements

where CO = cardiac output; BSA = body surface area.


Resistance calculations follow the form of Ohm’s law, where

 = blood flow. Resistance units (mm Hg/L/min) are also called Hybrid resistance units or Wood units. To convert Wood units to metric resistance (dynes × s × cm–5), multiply by 80.
Computations of Valve Areas from Pressure Gradients and Cardiac Output
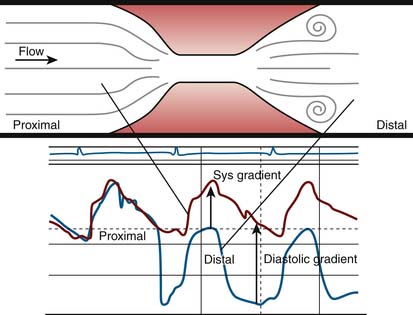
A pressure gradient is the pressure difference across an area of valvular or vascular obstruction, such as a stenosis or an occlusion or narrowed valve. Figure 3-3 is a diagram of a coronary stenosis with higher pressure proximal to the stenosis and lower pressure beyond the stenosis. The same principle applies for heart valves with higher pressure proximal to the stenotic valve and lower pressure distal to it. There are several methods used to measure transvalvular gradients.
All pressure gradients are affected by a number of physiologic, anatomic, and artifactual variables. Physiologic variables include (1) rate of blood flow (e.g., CO, coronary blood flow), (2) resistance to flow, and (3) proximal chamber pressure and compliance. Anatomic variables include (1) shape and length of valve orifice, (2) tortuosities of the vessels (for arterial stenosis); folding of coronary artery by guidewire (i.e., pseudostenosis), and(3) multiple or serial lesions (for cardiac valves and arterial stenosis).
Examples of Aortic and Mitral Valve Area Calculations
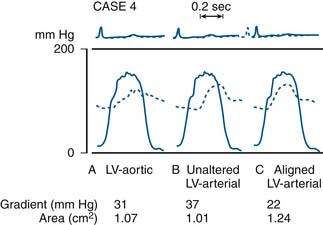
Most modern physiologic recording systems use computer-generated waveforms and gradient producing valve areas automatically. When using femoral artery and LV pressure, time shifting the femoral artery back to match upstroke of the left ventricle will under-estimate the true Ao valve gradient (Fig 3-4). When calculating from the formula, CO should be converted to milliliters per minute, not liters per minute. When computing flow, the ejection period and filling period are converted to fractions of the period in seconds.
Data obtained at catheterization for Ao stenosis (Fig. 3-5):
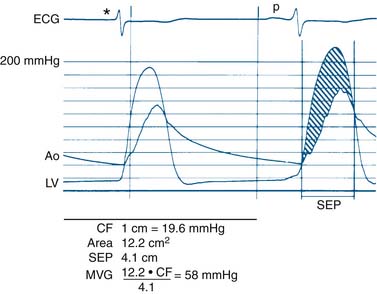


Notes on the Ao Valve Gradient
The delay in pressure transmission and pressure wave reflection from the proximal aorta to the femoral artery artificially increases the mean gradient. If matched to the upstroke of the left ventricle, femoral pressure overshoot (amplification) reduces the true gradient. In patients with low gradients (i.e., <35 mm Hg), more accurate valve areas were obtained with unshifted LV-Ao pressure tracings (Fig. 3-4; Folland et al). Optimally a second catheter can be positioned directly above the Ao valve to reduce transmission delay and femoral pressure amplification. A long (>30 cm) arterial sheath can be used. Transseptal cardiac catheterization can also be performed to obtain direct LV pressure (Fig. 3-5 shows LV-Ao pressure measure from central Ao catheter without delay in the upstroke of Ao pressure).

Note: The quick formulas for valve area differ from the Gorlin formula by 18 ± 13% in patients with bradycardia (<65 beats/min) or tachycardia (>100 beats/min). The Gorlin equation at low-flow states overestimates the severity of valve stenosis. In low-flow states (CO <2.5 L/min), the Gorlin formula should be modified to use the mean transvalvular gradient with new empirically derived constants.
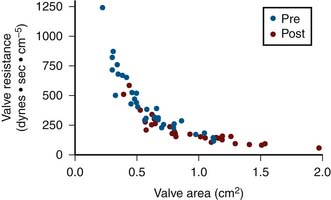
Use of Valve Resistance for Aortic Stenosis
Valve resistance is calculated using the same variables for valve area measurement. In contrast to valve area, the mean pressure gradient is considered to be a linear variable rather than taken as a square root term. The contribution of pressure gradient to the magnitude of valve resistance is greater. Resistance has also been shown to be more constant than valve area under conditions of changing CO. Figure 3-6 shows resistance and area calculated in a group of patients before and after balloon Ao valve dilation. Resistance rises sharply above a valve area of 0.7 cm2. The shoulder of this curve is 0.7 to 1.1 cm2, which is the common area of indeterminate significance of Gorlin Ao valve area. Some patients in this gray zone tend to have higher valve resistance than others. It has been shown in this setting that patients with resistance greater than 250 dynes − sec − cm−5 are more likely to have significant obstruction than patients with resistance less than 200 dynes − sec − cm−5. There is also a gray zone in using this index, and some patients may have resistance less than 250 dynes − sec − cm−5 despite a planar valve area of 0.7 to 0.8 cm2.
Catheter Selection for Aortic Stenosis
Initial catheter selection is a matter of operator choice and experience. The pigtail ventriculography catheter is a good initial choice in most cases. The operator crosses the Ao valve with a 0.038-inch, straight-tipped safety guidewire, extending the wire and straightening the pigtail with a slight angled bend. The operator should direct the wire into the area of highest turbulence as detected by jet impaction on the wire, and note the movement as visualized on the fluoroscopy monitor. Manipulation of the wire and catheter allows positioning of the wire in various directions needed to cross the valve. Advancing the pigtail over the wire and, in most cases, rapidly positioning the catheter for ventriculography and hemodynamic studies is a simple operation. When this method is successful it is a one-step procedure, and for this reason the pigtail catheter is a logical first choice. Other catheter choices for crossing the Ao valve include the left and, occasionally, right Amplatz catheter, right Judkins catheter, multipurpose catheter, and specially designed catheters. When the operator must use an alternative catheter, the left and right Judkins catheters can complete coronary angiography between catheter exchanges. All but the pigtail catheter are generally unsuitable for LV angiography. It should not require more than 15 minutes to cross the stenotic Ao valve, and if great difficulty is encountered, a transseptal approach should be considered early in the procedure.
Points to Remember for Crossing the Aortic Valve with Guidewires
When Do You Need to Cross the Aortic Valve for Hemodynamic Assessment?
The Class I indications (experts agree procedure indicated) are as follows:
Data from Catheterization Laboratory for Calculation of Mitral Valve Area
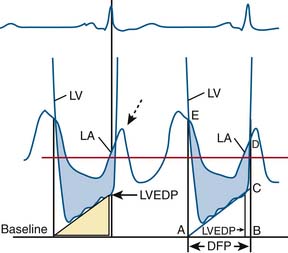
Figure 3-7 is a hemodynamic tracing to calculate mitral valve area.
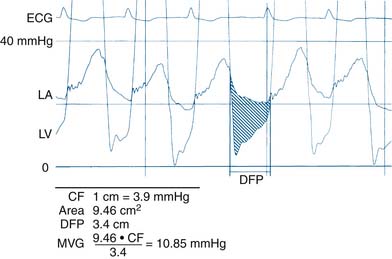
Step 1: Planimeter 5 LV-PCW areas (10 if in atrial fibrillation).
Step 2: Measure diastolic filling period (DFP).
Step 3: Convert planimetered area to mean diastolic pressure gradient.

Step 4: Compute mitral valve flow.

Step 5: Compute mitral valve area (MVA).

Notes on Mitral Valve Gradient
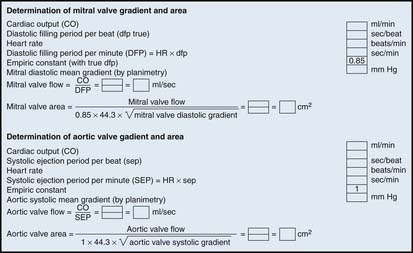
Use of direct LA pressure from transseptal measurement is the most accurate method. Transseptal catheterization should be performed to confirm pressure gradients, especially for suspected prosthetic mitral stenosis. However, if the PCW pressure-LV pressure tracings show no significant gradients, transseptal catheterization is unnecessary. A worksheet for valve area calculation is shown in Figure 3-8.
Simplified Mitral Valve Gradient Calculation by Cui et al
Cui simplified the estimation of the mitral valve gradient (MVG) and thus simplified the calculation of mitral valve area from the hemodynamic tracings. Because the mean MVG is the pressure difference between the mean left atrial pressure (MLAP) and mean left ventricular pressure during diastole (MLVP) (i.e., MLVG = MLAP – MLVP), the computation of the mean MVG is simply knowing the MLVP. The MLAP is easily obtained from the electronically meaned LA signal on the hemodynamic recorder. The area under the LV pressure during diastole is roughly a triangle with the three corners formed from the intersections of the diastolic filling period (DFP) starting and ending points (mitral valve closure and opening) marking the vertical lines intersecting with the LV pressure line (rising diagonally across diastole, see Figure 3-9). This triangular area can be estimated from the rectangular area LVEDP × DFP divided by 2. Thus the MLVP is equal to the LVEDP/2. From this key calculation, the mean valve gradient is therefore simplified as

Pulmonic Valve Stenosis
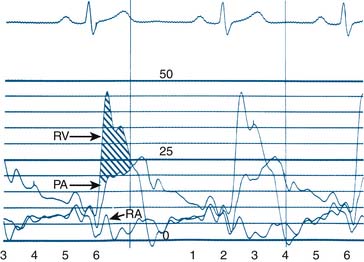
A pulmonary valvular stenosis gradient (Fig. 3-10) can be obtained by catheter “pullback,” continuously measuring pressure during catheter withdrawal across the stenotic valve. Two catheters, multiple-lumen balloon-tipped catheters, or double-lumen Cournand catheters are more precise, however, and can record simultaneous PA and RV pressures in the manner used for Ao valve stenosis. There is no validated formula for pulmonary valve area. Prognostic data are based on RV pressure and gradient alone.
Measurement of Cardiac Output
Fick Principle for Measurement of Cardiac Output
The Fick principle states that uptake or release of a substance by any organ is the product of the arteriovenous concentration difference of the substance and the blood flow to that organ. Pulmonary blood flow (which is equal to systemic blood flow in the absence of an intracardiac shunt) is determined by measuring the arteriovenous difference of oxygen across the lungs and the uptake of oxygen from room air by the lungs. CO is calculated as oxygen consumption divided by the arteriovenous oxygen concentration difference. The arteriovenous oxygen consumption difference is calculated (in milliliters of oxygen) as the difference in LV oxygen content (1.36 × hemoglobin × LV O2 saturation x 10) minus the PA (mixed venous) oxygen content (1.36 × hemoglobin × PA O2
Stay updated, free articles. Join our Telegram channel

Full access? Get Clinical Tree


