The aim of this study was to test the hypothesis that depression and anxiety are associated with electrocardiographic (ECG) repolarization abnormalities in the Multi-Ethnic Study of Atherosclerosis (MESA), a cohort free of symptomatic cardiovascular disease. Depressive symptoms were assessed by using the Center for Epidemiologic Studies Depression Scale and trait anxiety symptoms by using the Spielberger State-Trait Anxiety Inventory; both were categorized according to uppermost quartile. T-wave inversions in ECG leads other than V 1 to V 3 were obtained from electrocardiograms obtained at rest during the baseline examination. Participants with major intraventricular conduction abnormalities and those taking antiarrhythmics, antidepressants, and/or antipsychotics were excluded. Logistic regression models were estimated with multivariable adjustment for traditional cardiovascular disease risk factors. Among 5,906 participants, elevated depressive symptoms were associated with increased odds of T-wave inversion after multivariable adjustment (odds ratio 2.02, 95% confidence interval 1.33 to 3.06, p = 0.001), whereas greater trait anxiety was associated with reduced odds of T-wave inversion (odds ratio 0.47, 95% confidence interval 0.29 to 0.77, p = 0.003). The divergent associations of depressive symptoms and trait anxiety with ECG T-wave inversions were similar in men and women, and these associations were present across the racial and ethnic subgroups (non-Hispanic white, African-American, Hispanic, and Chinese). In conclusion, symptoms of depression and anxiety were independently yet oppositely associated with ECG T-wave inversions. Negative emotions may have a differential impact on cardiovascular mortality through unique relations with cardiac repolarization.
Highlights
- •
We examined the relation of abnormal repolarization to depressive and anxiety symptoms.
- •
Elevated depressive symptoms were associated with increased odds of T wave inversions.
- •
Greater trait anxiety was associated with a reduced odds of T wave inversions.
- •
Negative emotions may have unique relations with cardiac repolarization.
Cardiac repolarization measures by 12-lead electrocardiography have been recognized in population-based samples to be associated with cardiovascular mortality. A study of 10,899 Finnish middle-aged men and women without known heart disease found that T-wave inversions in electrocardiographic (ECG) leads other than V 1 to V 3 were associated with cardiac (relative risk 2.65, 95% confidence interval [CI] 1.86 to 3.78) and arrhythmic (relative risk 3.16, 95% CI 1.86 to 5.36) death over an average follow-up period of 30 years. On the basis of its prognostic utility, we examined the same indicator of abnormal repolarization to assess for its independent associations with depressive and anxiety symptoms in the Multi-Ethnic Study of Atherosclerosis (MESA). We hypothesized that depressive and anxiety symptoms would be associated, albeit potentially differentially, with ECG T-wave abnormalities. We sought to identify a physiologic measure that was related with particular psychological symptoms and with cardiovascular mortality, such that it might provide insight into the mechanisms by which depression and anxiety are differentially related with cardiac mortality.
Methods
MESA is a multicenter, longitudinal cohort study of the prevalence, correlates, and progression of subclinical cardiovascular disease. MESA recruited 6,814 men and women 45 to 84 year of age, self-identified as white, black, Hispanic, or Chinese, and free of clinically apparent cardiovascular disease from July 2000 to August 2002 from 6 communities: Baltimore City and Baltimore County, Maryland; Chicago, Illinois; Forsyth County, North Carolina; Los Angeles County, California; northern Manhattan and the Bronx, New York; and St. Paul, Minnesota. Informed consent was obtained from the participants and the study was approved by the institutional review board of each participating center. To minimize potential secondary repolarization effects from organic heart disease, we excluded participants whose electrocardiograms depicted QRS duration ≥120 ms. Also, we excluded participants who reported taking antiarrhythmic medications, antipsychotic medications, and/or antidepressant medications.
Participants underwent an extensive baseline evaluation (examination 1), including a standardized questionnaire; measurements of height, weight, body mass index, anthropometric data, and blood pressure; and blood samples for total and high-density lipoprotein cholesterol, triglyceride, and glucose levels after a 12-hour fast. Information on demographics, current smoking, education level, current alcohol use, physical activity, and medical history was obtained using standardized questionnaires. Education level was defined by the highest level of schooling achieved. Physical activity was defined as the total of all light, moderate, and vigorous activities multiplied by individual metabolic equivalent values for these activities. Diabetes was defined as a fasting serum glucose level ≥126 mg/dl or the use of hypoglycemic drugs or insulin. Serum creatinine was measured, and estimated glomerular filtration rate was calculated by using the Modification of Diet in Renal Disease (MDRD) equation. Urine albumin and creatinine were measured in the Clinical Chemistry Laboratory at Fletcher Allen Health Care (Burlington, Vermont). Urine albumin-to-creatinine ratios were classified according to the presence of albuminuria (≥30 mg albumin/g creatinine). High-sensitivity C-reactive protein was measured using a BNII nephelometer (Dade-Behring, Deerfield, Illinois). Cardiac magnetic resonance imaging was performed with 1.5-T magnets, with determination of left ventricular mass as described previously. Left ventricular mass index was calculated as left ventricular mass (g)/body surface area (m 2 ).
Depressive symptoms were assessed at examination 1 using the Center for Epidemiologic Studies Depression Scale (CES-D). The CES-D is a 20-item survey that measures mood, somatic symptoms, social interactions, and motor functioning. Each item uses a 4-point, Likert-type scale for responses. The sum total over the 20 items can range from 0 to 60, with higher scores indicating more severe symptoms of depression. The survey asks about the frequency in the past week that one has felt or behaved a certain way. Sample items include “I felt depressed,” “My sleep was restless,” and “I lost interest in my usual activities.” The CES-D does not include items for increased appetite or sleep, guilt, or suicidal thoughts. Anxiety was assessed at examination 1 with the Trait subscale of the State-Trait Anxiety Inventory. This is a 20-item scale that requires respondents to indicate how frequently they experience a variety of anxiety symptoms, also using a 4-point, Likert-type scale. On the basis of the skewed distributions of both the CES-D scores and trait anxiety scores in the MESA sample ( Supplemental Figure 1 ), we categorized elevated depressive symptoms and anxiety according to the upper quartile for each score. This resulted in a cut-point score of ≥10 for the CES-D scale and ≥19 for the trait anxiety scale. The cut point of 10 for CES-D score has previously been used to define elevated depressive symptoms and has been associated with increased risk for ischemic heart disease events in a cohort without known cardiovascular disease.
Standard 12-lead electrocardiograms were digitally acquired at examination 1 using a Marquette MAC-PC electrocardiograph (Marquette Electronics, Milwaukee, Wisconsin) at 10 mm/mV calibration and a paper speed of 25 mm/s. All electrocardiograms were centrally read at the EPICARE reading center at Wake Forest School of Medicine (Winston-Salem, North Carolina) and visually inspected for technical errors and inadequate quality. The dependent variable for our analyses was the presence of T-wave inversions in leads other than V 1 to V 3 , according to the analysis by Aro et al. Specifically, this included any negative T-wave amplitude ≥0.1 mV in precordial leads V 4 , V 5 , or V 6 or limb leads I, II, or aVF. T-wave inversions in leads V 1 to V 3 were not included in the dependent variable given their lack of prognostic significance.
Demographic and coronary disease risk factors for MESA participants included and excluded from the present analysis were compared using chi-square tests, analysis of variance, or nonparametric tests as appropriate. Among MESA participants included in our analysis, we compared these same characteristics across categories defined by the uppermost quartile of CES-D depressive symptom score and trait anxiety score. Logistic regression models were used to estimate the odds ratios (ORs) for T-wave inversions with elevated depressive symptoms and elevated anxiety, separately, with simultaneous inclusion of both symptom types. Two levels of adjustment were performed. First, we adjusted for age, gender, and race and ethnicity (white, African-American, Hispanic, and Chinese). Next, ORs were calculated after further adjustment for center, body mass index, hypertension, diabetes mellitus, low-density lipoprotein and high-density lipoprotein cholesterol levels, heart rate on rest electrocardiography, systolic and diastolic blood pressure, cigarette smoking (never, former, or current), self-reported moderate and vigorous physical activity by quartile, estimated glomerular filtration rate, albuminuria, left ventricular hypertrophy according to Cornell ECG criteria, log-transformed highly sensitive plasma C-reactive protein levels, benzodiazepine use, and β-blocker use. Variance inflation factors were examined to evaluate the presence of multicollinearity. The consistency of the results were evaluated in subgroups defined by gender and race and ethnicity. On the basis of a prior analysis that observed a relation between left ventricular cavity size and T-wave amplitude, in a sensitivity analysis we estimated models that included left ventricular mass index measured by cardiac magnetic resonance imaging as an additional covariate. All analyses were conducted using SPSS version 22 (IBM Corporation, Armonk, New York).
Results
After excluding participants with QRS durations ≥120 ms and those taking antiarrhythmic, antidepressant, and/or antipsychotic medications, our sample consisted of 5,906 participants. Participants included in the analysis were younger (average age 62 vs 63.2 years), less likely to be non-Hispanic white (35.6% vs 56.9%), and more likely to be Chinese-American, Hispanic, or African-American than participants who were excluded ( Supplementary Table 1 ). Included participants had fewer coronary disease risk factors such as hypertension (44.2% vs 49.3%) and current smoking (12.9% vs 14.3%) and a lower prevalence of reduced glomerular filtration rate (<60 ml/min/1.73 m 2 ; 9.1% vs 12.3%). Depressive and anxiety symptom scores were lower in the included sample.
Depressive symptom scores and anxiety scores were moderately correlated with each other (Spearman’s correlation = 0.48, p <0.01). Compared with participants with depressive symptom scores <10, those with elevated depressive symptoms were younger, more likely to be women, more frequently Hispanic, and more likely to report current smoking ( Table 1 ). Average body mass index and heart rate were higher in those with elevated depressive symptoms, and the prevalence of hypertension, diabetes, and albuminuria was higher. High-density lipoprotein cholesterol and C-reactive protein were higher in participants with elevated depressive symptoms. Similar patterns were observed comparing participants with trait anxiety scores <19 with those with elevated symptoms. However, the prevalence of albuminuria and average C-reactive protein levels was not significantly different between participants with and without elevated anxiety symptoms.
| Variable | CES-D <10 (n=4309) | CES-D ≥10 (n=1597) | P value | ANX <19 (n=4432) | ANX ≥19 (n=1474) | P value |
|---|---|---|---|---|---|---|
| Age (years) | 62.2 (10.1) | 61.4 (10.4) | <0.01 | 62.2 (10.1) | 61.3 (10.3) | <0.01 |
| Female | 48.6% | 62.9% | <0.01 | 49.6% | 61.0% | <0.01 |
| Race-ethnicity | <0.01 | <0.01 | ||||
| Non-Hispanic white | 37.6% | 30.4% | 35.4% | 36.5% | ||
| Chinese-American | 13.6% | 11.0% | 12.3% | 14.7% | ||
| African-American | 29.1% | 27.4% | 30.1% | 24.4% | ||
| Hispanic | 19.7% | 31.2% | 22.3% | 24.4% | ||
| Body mass index (kg/m 2 ) | 28.0 (5.3) | 28.8 (5.9) | <0.01 | 28.2 (5.3) | 28.4 (5.8) | 0.33 |
| Hypertension | 43.2% | 46.8% | 0.01 | 43.3% | 47.0% | 0.01 |
| Systolic blood pressure (mmHg) | 126.6 (21.3) | 126.5 (22.2) | 0.86 | 126.6 (21.3) | 126.5 (22.2) | 0.86 |
| Diastolic blood pressure (mmHg) | 72.2 (10.2) | 71.6 (10.4) | 0.03 | 72.2 (10.2) | 71.6 (10.6) | 0.04 |
| LVH by ECG | 3.3% | 4.1% | 0.13 | 3.4% | 3.8% | 0.51 |
| Heart rate (BPM) | 62.7 (9.4) | 63.9 (9.8) | <0.01 | 62.9 (9.5) | 63.5 (9.7) | 0.03 |
| Diabetes mellitus | 10.4% | 12.7% | 0.03 | 10.8% | 11.7% | 0.32 |
| LDL cholesterol (mg/dL) | 111.0 (24.6) | 111.8 (25.7) | 0.31 | 111.5 (24.8) | 110.6 (25.3) | 0.27 |
| HDL cholesterol (mg/dL) | 50.1 (15.2) | 51.3 (15.1) | 0.01 | 50.0 (15.1) | 51.9 (15.5) | <0.01 |
| Current smoker | 12.0% | 15.2% | <0.01 | 12.5% | 14.0% | <0.01 |
| Mod/Vig Phys Activity (MET-min/wk) | 4073 (2010, 7500) | 4106 (1907, 7984) | 0.84 | 4140 (2010, 7659) | 3952 (1931, 7524) | 0.30 |
| Albuminuria | 8.7% | 11.3% | 0.01 | 9.1% | 9.4% | 0.33 |
| eGFR < 60 ml/min/1.73 m 2 | 9.3% | 8.6% | 0.39 | 9.4% | 8.4% | 0.30 |
| Log (C-reactive protein, mg/L) | 0.59 (-0.22, 1.39) | 0.73 (-0.14, 1.54) | <0.01 | 0.62 (-0.20, 1.43) | 0.67 (-0.17, 1.45) | 0.38 |
| CES-D score | 3 (1, 6) | 15 (12, 20) | 4 (1, 7) | 12 (7, 18) | ||
| Anxiety score | 14 (11, 16) | 19 (17, 22) | 14 (11, 16) | 21 (20, 23) |
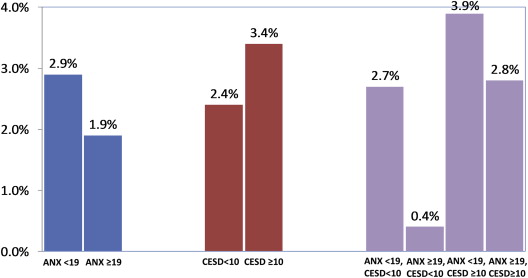
Figure 1 presents the percentage of participants with T-wave inversions, according to category of anxiety and depressive symptoms. The prevalence of T-wave inversions was lower in those with (1.9%) compared with those without (2.9%) elevated anxiety symptoms. However, the prevalence of T-wave inversions was higher in those with elevated depressive symptoms (3.4%) compared with those without (2.4%). When participants were categorized according to depressive and anxiety symptoms, the highest prevalence of T-wave inversions was among participants who reported elevated depressive symptoms but who did not report elevated anxiety symptoms. Conversely, the lowest prevalence of T-wave inversions was in participants who reported elevated anxiety but who did not report elevated depressive symptoms.
Stay updated, free articles. Join our Telegram channel

Full access? Get Clinical Tree


