Vitamin D recently has been proposed to play an important role in a broad range of organ functions, including cardiovascular (CV) health; however, the CV evidence-base is limited. We prospectively analyzed a large electronic medical records database to determine the prevalence of vitamin D deficiency and the relation of vitamin D levels to prevalent and incident CV risk factors and diseases, including mortality. The database contained 41,504 patient records with at least one measured vitamin D level. The prevalence of vitamin D deficiency (≤30 ng/ml) was 63.6%, with only minor differences by gender or age. Vitamin D deficiency was associated with highly significant (p <0.0001) increases in the prevalence of diabetes, hypertension, hyperlipidemia, and peripheral vascular disease. Also, those without risk factors but with severe deficiency had an increased likelihood of developing diabetes, hypertension, and hyperlipidemia. The vitamin D levels were also highly associated with coronary artery disease, myocardial infarction, heart failure, and stroke (all p <0.0001), as well as with incident death, heart failure, coronary artery disease/myocardial infarction (all p <0.0001), stroke (p = 0.003), and their composite (p <0.0001). In conclusion, we have confirmed a high prevalence of vitamin D deficiency in the general healthcare population and an association between vitamin D levels and prevalent and incident CV risk factors and outcomes. These observations lend strong support to the hypothesis that vitamin D might play a primary role in CV risk factors and disease. Given the ease of vitamin D measurement and replacement, prospective studies of vitamin D supplementation to prevent and treat CV disease are urgently needed.
There is a growing epidemic of vitamin D deficiency, and its consequences beyond bone health, are still not well understood. However, early reports have linked it to such cardiovascular (CV) conditions as hypertension, diabetes mellitus, obesity and the metabolic syndrome, left ventricular hypertrophy, heart failure, coronary heart disease, renal disease, and mortality. Because vitamin D deficiency can be readily determined by blood testing and treated by supplementation, it is crucial to solidify knowledge of its prevalence and contribution to CV disease states and outcomes. A limited evidence base has suggested a beneficial effect on clinical outcomes with replacement therapy. We prospectively addressed the proposed relation of vitamin D deficiency to CV conditions by analyzing a large and longitudinal electronic medical record database.
Methods
We prospectively studied the electronic medical record database of the integrated Intermountain Healthcare system to address 4 objectives in a general healthcare population: (1) to determine the prevalence of vitamin D deficiency and insufficiency in subjects with measured vitamin D levels; (2) to evaluate the relation of vitamin D levels to prevalence and incidence of prespecified CV risk factors; (3) to assess the relation of vitamin D levels to prespecified CV conditions; and (4) to determine the association of baseline vitamin D levels with incident CV outcomes. The present study was approved by the Intermountain Institutional Review Board.
The Intermountain database search identified 41,497 subjects with at least one vitamin D measurement from 2000 to 2009. Vitamin D levels were drawn at the providers’ discretion for clinical indications (e.g., osteoporosis risk). The study subjects averaged 55 ± 21 years old; women (74.8%) outnumbered men (25.2%). The prevalence of patients in each category was analyzed according to age, gender, and the season in which the sample was taken.
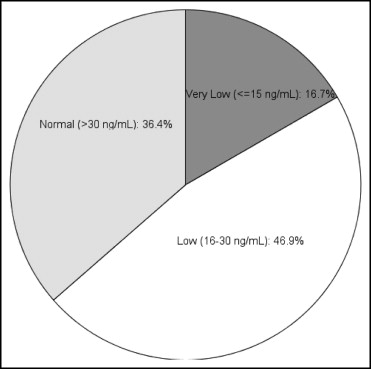
The serum vitamin D levels were measured by chemiluminescent immunoassay in Intermountain laboratories as 25(OH)D, the principal circulating form of vitamin D (generally accepted as the best measure of total body vitamin D stores ) and stratified into 3 categories: normal, >30 ng/ml; low (insufficient), 16 to 30 ng/ml; and very low (deficient), ≤15 ng/ml.
The prevalence and incidence of CV diseases and risk factors were determined by “International Classification of Diseases,” version 9, code entries documented in electronic medical records at baseline and during follow-up. The prospectively defined risk factors of interest and available to study were age, gender, hypertension, hyperlipidemia, diabetes mellitus, and peripheral vascular disease. The CV diseases of interest and available were the prevalence and incidence of coronary heart disease (i.e., clinical coronary artery disease [CAD] or myocardial infarction [MI]), heart failure (HF), cerebrovascular accident (CVA or stroke), and atrial fibrillation. Because subclassification of death was not routinely available, all-cause mortality was used as the primary survival measure. Other clinical conditions of interest for analysis included fractures, pulmonary embolism, depression, renal failure, skeletal disorder, hypothyroidism, infection requiring medical attention, and headache.
Patients were followed after the initial vitamin D determination for an average of 1.3 years (maximum 9.3). (The large numbers of shorter term follow-up periods reflect the recent interest in vitamin D status.) Deaths were determined from the hospital records and telephone queries, Utah State Health Department records (death certificates), and the national Social Security death records. Patients not listed as deceased in any registry were considered alive.
The chi-square statistic and analysis of variance test were used to characterize the categorical and continuous variables, respectively, according to vitamin D categories. Univariate and multivariate Cox regression analysis was used to determine the associations of baseline vitamin D with an incident death or “International Classification of Diseases,” version 9, CV diagnosis/event (CAD/MI, HF, CVA, atrial fibrillation). The risk factors used in the multivariate modeling were those given earlier. The primary study end point was the incidence of a composite CV event of death, CAD/MI, HF, or CVA. The major secondary end points of interest were its individual components. In these analyses, the proportional hazards assumption was determined to be met by including a time-dependent covariate in a model representing the interaction between the outcome of interest’s follow-up time and vitamin D level. p Values <0.05 was designated as significant; both unadjusted and (conservative) Bonferroni adjusted results are given.
Results
In a search of the Intermountain electronic medical record database, 41,504 patients were found with at least one measured vitamin D level; 11,088 (26.7%) had 2 measurements, 3,950 (9.5%) had 3 measurements, and 1,703 (4.1%) had >3 measurements, for a total of 58,245 measured levels. The age and gender distribution is listed in Table 1 .
| Vitamin D Level (ng/ml) ⁎ | |||
|---|---|---|---|
| >30 (n = 15,121) | 16–30 (n = 19,474) | ≤15 (n = 6,909) | |
| Total | 36.4% | 46.9% | 16.6% |
| Men (n = 10,418) | 33.9% | 48.5% | 17.6% |
| Women (n = 31,086) | 37.3% | 46.4% | 16.3% |
| Age ≥50 years (n = 27,686) | 36.5% | 47.2% | 16.3% |
| Age <50 years (n = 13,811) | 36.2% | 46.5% | 17.3% |
| Tests in May–July | 38.1% | 47.7% | 14.2% |
| Tests in December–February | 35.2% | 45.4% | 19.4% |
The distribution of vitamin D levels by category is shown in Figure 1 . Only minor differences among categories were noted by gender or age ( Table 1 ). Although common, regardless of the season, vitamin D deficiency was more prevalent during winter months (p <0.0001; Table 1 ). Of the 41,504 patients, 36% had all measurements within the laboratory-reported range of normal (i.e., >30 ng/ml), 47% had at least one mildly to moderately reduced (insufficient) measurement (16 to 30 ng/ml), and 17% had a frankly deficient measurement (≤15 ng/ml). Thus, almost 2/3 had insufficient or deficient levels.
Highly significant and graded inverse associations were observed for the prevalence of CV risk factors among the vitamin D categories for hypertension, hyperlipidemia, diabetes, and peripheral vascular disease (all p <0.0001; Table 2 ). Of particular note was an increased prevalence of hypertension (30% relative and 12% absolute) and diabetes (90% relative and 14% absolute) in very low versus normal categories (p trends <0.0001).
| Risk Factor | Vitamin D Level (ng/ml) | p Trend | ||
|---|---|---|---|---|
| ≤15 | 16–30 | >30 | ||
| Hypertension | 51.9% | 43.8% | 39.8% | <0.0001 ⁎ |
| Hyperlipidemia | 47.1% | 45.9% | 43.2% | <0.0001 ⁎ |
| Diabetes mellitus | 29.3% | 20.0% | 15.4% | <0.0001 ⁎ |
| Peripheral vascular disease | 4.6% | 3.1% | 3.0% | <0.0001 ⁎ |
⁎ Comparisons also significant after Bonferroni correction (i.e., adjusted for 4 risk factor comparisons).
The overall incidence and unadjusted and adjusted relative hazards for newly appearing risk factors (i.e., first appearance after the initial vitamin D measurement) during follow-up were also determined ( Table 3 ). Graded differences across vitamin D categories were noted for all 4 risk factors. Of particular note were the adjusted relative increases in incident hypertension (by 62%, p <0.0001) and diabetes (by 89%, p <0.0001) in very low versus normal categories.
| Risk Factor (Overall Incidence) | Very Low vs Normal (≤15 vs >30 ng/ml) | Low vs Normal (16–30 vs >30 ng/ml) | ||
|---|---|---|---|---|
| Unadjusted | Adjusted | Unadjusted | Adjusted | |
| Hypertension (6.0%) | ||||
| Hazard ratio | 1.73 | 1.62 | 1.26 | 1.18 |
| 95% confidence interval | 1.48–2.02 | 1.38–1.89 | 1.12–1.42 | 1.05–1.33 |
| p Value | <0.0001 ⁎ | <0.0001 ⁎ | <0.0001 ⁎ | 0.005 ⁎ |
| Hyperlipidemia (5.8%) | ||||
| Hazard ratio | 1.47 | 1.27 | 1.19 | 1.10 |
| 95% confidence interval | 1.25–1.72 | 1.09–1.50 | 1.06–1.34 | 0.98–1.24 |
| p Value | <0.0001 ⁎ | 0.003 ⁎ | 0.005 ⁎ | 0.12 |
| Diabetes mellitus (2.2%) | ||||
| Hazard ratio | 2.13 | 1.89 | 1.39 | 1.32 |
| 95% confidence interval | 1.73–2.62 | 1.54–2.33 | 1.17–1.64 | 1.12–1.56 |
| p Value | <0.0001 ⁎ | <0.0001 ⁎ | <0.0001 ⁎ | 0.001 ⁎ |
| Peripheral vascular disease (0.8%) | ||||
| Hazard ratio | 1.80 | 1.42 | 1.10 | 1.01 |
| 95% confidence interval | 1.32–2.46 | 1.04–1.94 | 0.85–1.43 | 0.78–1.31 |
| p Value | <0.0001 ⁎ | 0.03 | 0.48 | 0.93 |
⁎ Comparisons also significant after Bonferroni correction (i.e., adjusted for 8 risk factor comparisons).
The association of prevalent CV disease conditions with initial vitamin D status was assessed in subjects ≥50 years old (n = 27,686). In the present cohort, the age averaged 66.6 ± 10.8 years and 75.0% were women. The results are summarized in Table 4 . Strong inverse associations across vitamin D categories were noted for all 8 prespecified CV disease diagnoses: CAD, HF, atrial fibrillation, MI, peripheral vascular disease, stroke, transient ischemic attack, and ventricular tachycardia. Of particular note were the increases in prevalence of HF (90% relative and 9% absolute), MI (81% relative and 2.6% absolute), and stroke (51% relative and 2% absolute) in very low versus normal vitamin D categories (all p trends <0.0001).
| Cardiovascular Disease | Vitamin D Level (ng/ml) | p Trend | ||
|---|---|---|---|---|
| ≤15 | 16–30 | >30 | ||
| Coronary artery disease | 25.1% | 19.7% | 17.5% | <0.0001 ⁎ |
| Heart failure | 19.2% | 12.3% | 10.1% | <0.0001 ⁎ |
| Atrial fibrillation | 11.8% | 9.6% | 9.2% | <0.0001 ⁎ |
| Peripheral vascular disease | 6.3% | 4.2% | 3.8% | <0.0001 ⁎ |
| Previous myocardial infarction | 5.8% | 3.8% | 3.2% | <0.0001 ⁎ |
| Previous stroke | 5.9% | 4.2% | 3.9% | <0.0001 ⁎ |
| Previous transient ischemic attack | 5.2% | 4.5% | 4.2% | 0.02 |
| Ventricular tachycardia | 2.3% | 1.6% | 1.3% | <0.0001 ⁎ |
⁎ Comparisons also significant after Bonferroni correction (i.e., adjusted for 8 comparisons among prevalent CV risk factors).
The association of 3 other prespecified health-related conditions of interest (i.e., recent infection, renal failure, previous fracture) with initial vitamin D status was also assessed in subjects ≥50 years old ( Table 5 ). These results confirm the role of vitamin D in bone health and the association of vitamin D deficiency with renal failure, and they suggest a role of vitamin D in normal immune function.
| Diagnosis | Vitamin D Level (ng/ml) | p Trend | ||
|---|---|---|---|---|
| ≤15 | 16–30 | >30 | ||
| Recent infection | 43.0% | 32.5% | 30.0% | <0.0001 ⁎ |
| Renal failure | 22.7% | 14.6% | 11.8% | <0.0001 ⁎ |
| Previous fracture | 20.9% | 18.1% | 18.1% | <0.0001 ⁎ |
Stay updated, free articles. Join our Telegram channel

Full access? Get Clinical Tree


