Fontan patients have a reduced exercise capacity, primarily owing to limitations in the ability to augment pulmonary blood flow and stroke volume. To date, the mechanism of peak exercise pulmonary blood flow restriction has not been elucidated. We performed a single-center, prospective, crossover trial of supine and upright exercise in Fontan patients and healthy controls to determine the mechanisms of exercise limitation in the Fontan-palliated patient. A total of 29 Fontan patients and 16 control subjects completed the protocol. The duration of exercise, percentage of predicted peak oxygen consumption (VO 2 ) and peak work were reduced in the Fontan group, regardless of posture (p ≤0.03). The percentage of predicted oxygen pulse, a surrogate for pulmonary stroke volume, was not increased with supine posture in the Fontan cohort (upright, 82.3 ± 18.8% vs supine, 82.4 ± 19.7%; p = 0.6). In both groups, the percentage of predicted peak VO 2 was lower with supine exercise than with upright exercise (p ≤0.002). Diastolic dysfunction was present in 57% of the Fontan patients and was associated with a reduced percentage of predicted peak VO 2 (p = 0.04) and supine peak work (p = 0.008). Six Fontan patients who underwent supine exercise with indwelling catheters failed to demonstrate the expected decrease in pulmonary vascular resistance characteristically seen with peak exercise (at rest, 2.8 ± 0.7 mm Hg/L/min/m 2 vs at peak, 2.8 ± 0.9 mm Hg/L/min/m 2 ; p = 0.9). In conclusion, supine exercise in Fontan patients does not result in an increased VO 2 or oxygen pulse, suggesting that inadequate venous return might not be the primary limitation of exercise capacity in this population. Diastolic dysfunction and relatively excessive peak exercise pulmonary vascular resistance might be more important factors in Fontan exercise limitation.
Supine exercise has been well studied in healthy patients and has consistently demonstrated reductions in maximal heart rate (HR), oxygen consumption (VO 2 ), workload, exercise duration, and other parameters of exercise capacity compared to upright exercise. Lower extremity venous pooling is reduced in the supine position, leading to an acute increase in venous return and relatively increased stroke volume (SV) at low levels of exertion. Venous return in the supine posture, as assessed by net antegrade inferior vena cava blood flow, is increased to a greater degree in Fontan patients than in control patients. Therefore, supine exercise in the Fontan-palliated patient would be expected to augment pulmonary SV and (at least partially) mitigate the expected reduction in supine exercise capacity if pulmonary blood flow is predominantly limited by the adequacy of systemic venous return. However, if Fontan pulmonary blood flow is chiefly limited by elevated pulmonary vascular resistance (PVR) and/or diastolic dysfunction, supine exercise would likely result in a reduction in exercise capacity similar to that seen with healthy subjects. In the present prospective study, we used supine and upright exercise to evaluate the mechanisms of Fontan exercise limitations.
Methods
The University of Michigan institutional review board approved the study. We prospectively recruited Fontan patients aged 8 to 30 years living within 200 miles of the hospital or scheduled for upcoming appointments at our institution. Control subjects of similar age and gender were recruited from the local population. To reduce the risk to the study patients and to avoid possible confounding explanations for exercise intolerance, the exclusion criteria listed in Table 1 were applied. All subjects or parents gave informed consent, and minors gave assent, before enrollment in the study.
| Fontan Subjects | Control Subjects |
|---|---|
| Pacemaker dependence | Significant cardiac disease |
| Moderate to severe hypoxia at rest (oxygen saturation <90%) | Moderate to severe asthma |
| Patent fenestration greater than small on echocardiogram | Acute or chronic renal disease |
| Atrial flutter or fibrillation within past 6 months | Other significant systemic disease |
| Protein losing enteropathy | |
| Previous postoperative cardiac arrest | |
| Previous life-threatening ventricular dysrhythmia | |
| Severe atrioventricular valve regurgitation | |
| Moderate to severe ventricular dysfunction | |
| Uncontrolled heart failure | |
| Pulmonary artery hypertension requiring vasodilator therapy | |
| Moderate to severe asthma | |
| Acute or chronic renal disease |
The relevant data were abstracted from the medical record, including the underlying cardiac anatomic diagnosis and the date of Fontan completion.
The most recent 2-dimensional echocardiograms with Doppler and tissue Doppler evaluations were analyzed (if acquired ≤12 months before the study) for fenestration size and patency, atrioventricular valve peak early diastolic inflow velocity (E), peak late diastolic inflow velocity (A), and tissue Doppler peak early diastolic velocity (E′) of the atrioventricular valve annulus. The ratio of early to late atrioventricular valve diastolic velocities (E/A ratio) and ratio of atrioventricular valve to tissue Doppler peak early diastolic velocities (E/E′ ratio) were calculated. The subjects were classified into the following diastolic function categories: normal, E/A ratio >1 but <2, E′ ≥8 cm/s, and E/E′ ratio of ≤10; impaired relaxation, E/A ratio ≤1 or E′ <8 cm/s; pseudonormalization, E/A ratio >1 and E/E′ ratio >10 but <15; and restrictive, E/A ratio ≥2, E′ <8 cm/s, and E/E′ ratio of ≥15.
The Fontan patients and control subjects followed the same crossover study protocol. The subjects were randomized to first undergo either supine or upright bicycle exercise testing, followed by a second exercise test in the alternate position ≥3 hours after the initial study. Exercise testing was performed using the 3-minute incremental exercise protocol described by James et al on an upright bicycle (Lode model 906900, Lode BV Medical Technology, Groningen, The Netherlands) and a recumbent bicycle (Biodex Medical Systems, Shirley, New York). Electrocardiographic monitoring and breath-by-breath expiratory gas analysis were performed with a Medical Graphics exercise testing system (Medical Graphics, St. Paul, Minnesota). Subjects were encouraged to exercise to the point of exhaustion. The peak VO 2 was defined as the greatest VO 2 recorded during the test. The oxygen pulse was calculated by dividing the peak VO 2 by the peak HR. The ventilatory anaerobic threshold (VAT) was calculated using the V-slope method, when it could be accurately determined. The minute ventilation/minute carbon dioxide production was calculated by dividing the minute ventilation by the minute carbon dioxide production. The breathing reserve was determined as follows: breathing reserve = [1 − (minute ventilation/predicted maximal minute ventilation )] × 100. The chronotropic index, a measure of HR response that is independent of the HR at rest and SV, was calculated as follows: chronotropic index = (HR Peak − HR Rest )/(predicted HR Peak − HR Rest ).
Subjects had their HR, blood pressure, and oxygen saturation monitored serially throughout the exercise testing. The exercise test was terminated when the subject reached exhaustion, experienced significant symptoms, or developed electrocardiographic changes suggestive of significant ischemia. Testing was supervised by an exercise technologist overseen by a pediatric cardiologist. Clinically relevant findings were communicated to the patient’s cardiologist. The predicted values were calculated using normative data previously established for the James protocol; the upright data were used for both postures in the absence of supine normative values.
To serve as a reference, we identified unpublished data from a cohort of Fontan patients who had performed supine exercise with invasive hemodynamic assessment from 1981 to 1982, using a previously published protocol.
The data were reviewed by the investigators, stored and evaluated using Microsoft Access, Microsoft Excel (2002, Microsoft, Redmond, Washington) and Statistical Analysis System, version 9.1 (SAS Institute, Cary, North Carolina). Continuous variables are presented as the mean ± SD and categorical values as numbers (percentages). Whenever possible, the parameters of exercise capacity are presented as indexed values (eg, ml/kg/min) or the percentage of predicted, rather than as absolute data, given the range of age and size encompassed in the present study. For each parameter, the mean values were compared across postures within each group and across groups within each posture. The comparison of the mean values was performed using Student’s t test or Wilcoxon’s rank sum test for normally or otherwise-distributed values, respectively. Values of p ≤0.05 were considered statistically significant.
The ClinicalTrials.gov number was NCT00633815 .
Results
The demographic and medical characteristics for the entire study population are summarized in Table 2 . No differences between the groups were significant.
| Variable | Fontan Subjects (n = 29) | Control Subjects (n = 16) | p Value |
|---|---|---|---|
| Females | 11 (38%) | 7 (44%) | 0.7 |
| Age at study (years) | 13.4 ± 2.6 | 12.7 ± 4.9 | 0.5 |
| Height (cm) | 154.3 ± 15.1 | 152.1 ± 14.6 | 0.6 |
| Weight (kg) | 46.5 ± 13.7 | 45.9 ± 14.6 | 0.8 |
| Body mass index (kg/m 2 ) | 19.2 ± 3 | 19.6 ± 5.1 | 0.8 |
| Body surface area (m 2 ) | 1.4 ± 0.3 | 1.4 ± 0.3 | 0.8 |
| Age at Fontan procedure (years) | 2.3 ± 1 | — | |
| Patent fenestration ⁎ | 11 (38%) | — | |
| Systemic ventricle | |||
| Right | 15 (52%) | — | |
| Left | 12 (41%) | — | |
| Biventricular | 2 (7%) | — |
⁎ All fenestrations were classified as tiny or small on echocardiogram.
The exercise performance measures for both cohorts are listed in Table 3 .
| Variable | Upright | Supine | p Value |
|---|---|---|---|
| Peak oxygen consumption (ml/kg/min) | |||
| Control | 36.2 ± 8.9 | 31.7 ± 8.7 | 0.002 |
| Fontan | 27.3 ± 6.8 | 23.1 ± 6.1 | <0.0001 |
| p Value | 0.0008 | 0.0006 | |
| Oxygen consumption at VAT (ml/kg/min) | |||
| Control | 22 ± 5.6 | 19.2 ± 4.5 | 0.02 |
| Fontan | 20.4 ± 5.3 | 15.2 ± 4.7 | <0.0001 |
| p Value | 0.4 | 0.04 | |
| Percentage of predicted peak oxygen consumption | |||
| Control | 84.2 ± 24 | 73.9 ± 23.8 | 0.002 |
| Fontan | 63.6 ± 14.8 | 53.2 ± 13.6 | <0.0001 |
| p Value | 0.007 | 0.006 | |
| Oxygen pulse (ml/beat/body surface area) | |||
| Control | 6.2 ± 1.3 | 6.1 ± 1.6 | 0.8 |
| Fontan | 6 ± 1.1 | 6 ± 1.3 | 0.9 |
| p Value | 0.5 | 0.9 | |
| Percentage of predicted oxygen pulse | |||
| Control | 88.3 ± 25 | 87.2 ± 29.2 | 0.7 |
| Fontan | 82.3 ± 18.8 | 82.4 ± 19.7 | 0.6 |
| p Value | 0.4 | 0.5 | |
| Peak work (Watts) | |||
| Control | 121 ± 36 | 120 ± 29 | 0.8 |
| Fontan | 98 ± 29 | 96 ± 27 | 0.9 |
| p Value | 0.03 | 0.009 | |
| Work at VAT (Watts) | |||
| Control | 83 ± 21 | 87 ± 24 | 0.7 |
| Fontan | 72 ± 14 | 68 ± 18 | 0.6 |
| p Value | 0.07 | 0.02 | |
| Peak minute ventilation/minute carbon dioxide production | |||
| Control | 30.8 ± 6 | 30.9 ± 10.2 | 0.9 |
| Fontan | 34.8 ± 7.2 | 34 ± 9.6 | 0.3 |
| p Value | 0.02 | 0.03 | |
| Chronotropic index | |||
| Control | 0.9 ± 0.1 | 0.7 ± 0.2 | 0.0001 |
| Fontan | 0.6 ± 0.2 | 0.4 ± 0.2 | <0.0001 |
| p Value | <0.0001 | <0.0001 | |
| Percentage of predicted peak heart rate | |||
| Control | 94 ± 5.3 | 83.9 ± 10.4 | 0.0001 |
| Fontan | 76.2 ± 10 | 63 ± 8.8 | <0.0001 |
| p Value | <0.0001 | <0.0001 | |
| Respiratory exchange ratio | |||
| Control | 1.13 ± 0.09 | 1.1 ± 0.08 | 0.05 |
| Fontan | 1.05 ± 0.14 | 0.99 ± 0.1 | 0.01 |
| p Value | 0.003 | 0.0005 | |
| Breathing reserve (%) | |||
| Control | 48.5 ± 11.2 | 57.4 ± 9.8 | 0.002 |
| Fontan | 58.2 ± 12 | 67.5 ± 9.9 | <0.0001 |
| p Value | 0.01 | 0.003 | |
| Resting oxygen saturation (%) | |||
| Control | 99 ± 1 | 99 ± 1 | 0.8 |
| Fontan | 94 ± 4 | 95 ± 3 | 0.7 |
| p Value | <0.0001 | <0.0001 | |
| Peak oxygen saturation (%) | |||
| Control | 99 ± 1 | 99 ± 1 | 0.6 |
| Fontan | 91 ± 4 | 93 ± 3 | 0.0002 |
| p Value | <0.0001 | <0.0001 | |
| Peak respiratory rate (breaths/min) | |||
| Control | 49 ± 11 | 50 ± 9 | 0.9 |
| Fontan | 44 ± 12 | 44 ± 14 | 0.8 |
| p Value | 0.2 | 0.2 |
At rest
The Fontan patients had a greater respiratory rate and systolic blood pressure at rest than the controls (p ≤0.05). The at rest oxygen saturation data are listed in Table 3 . Within the Fontan group, the HR and minute carbon dioxide production at rest were elevated in the upright posture compared to the supine position (p ≤0.04). The control subjects had similar at rest findings in both positions.
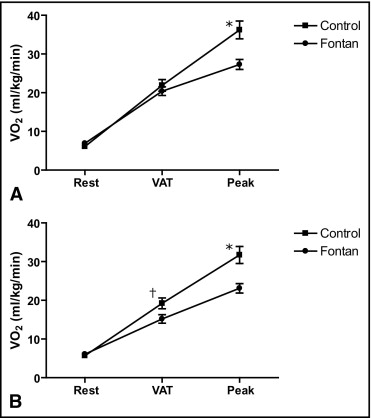
Anaerobic threshold
The supine VAT could be determined in 66% of the Fontan subjects and 63% of the control subjects. The upright VAT could be determined in 86% of the Fontan subjects and 88% of the control subjects. No demonstrable difference was found between the 2 groups in the indexed VO 2 at VAT with upright exercise. That the VO 2 at peak exercise was significantly greater with upright exercise in the control group suggests a relative preservation of submaximal exercise in the Fontan group ( Figure 1 ). The minute ventilation/minute carbon dioxide production was significantly elevated in the Fontan group in both positions (p ≤0.001), consistent with inefficient gas exchange at the VAT. The indexed VO 2 and HR at VAT were significantly greater in the upright posture in each group (p ≤0.02). The oxygen saturation in the Fontan cohort at VAT was 93 ± 3% in both postures.
Peak exercise
The maximal exercise capacity, defined by a respiratory exchange ratio of ≥1.09, was achieved during upright exercise in 21% of the Fontan patients and 80% of the controls. Fewer subjects in each group (14% of the Fontan subjects and 60% of the controls) achieved maximal exercise capacity in the supine position. Most measured parameters of exercise performance were significantly depressed in the Fontan subjects compared to the healthy controls in both positions ( Table 3 ). The oxygen pulse did not differ between the 2 groups, or between the 2 postures, although the chronotropic index was significantly decreased in the Fontan cohort in both positions. Oxygen consumption was decreased with supine exercise compared to upright exercise in both groups.
In all cases, exercise was stopped because of symptoms of leg fatigue, dyspnea, palpitations, or a combination. No tests were stopped prematurely by the exercise technologist. No significant adverse events, including death, sustained arrhythmia requiring intervention, or syncope, occurred. No significant ST-T wave changes occurred. Ventricular ectopy occurred more frequently in the Fontan subjects (21% with supine exercise and 24% with upright exercise) than in the controls (13% in both postures). Multifocal ventricular ectopy developed in 1 Fontan subject, prompting his cardiologist to order Holter monitoring after the exercise testing and subsequently initiate antiarrhythmic therapy.
Diastolic function could be assessed in 28 (97%) of the 29 Fontan subjects. The cohort mean data suggested a mild degree of ventricular diastolic dysfunction (E/A ratio 1.8 ± 0.6, E′ 9.9 ± 4.2 cm/s, and E/E′ ratio 11 ± 7.3), with 57% classified as having diastolic dysfunction (including 69% of the patients with a single right ventricle). Of the 16 patients with diastolic dysfunction, 2 (7%) had impaired relaxation, 8 (29%) had pseudonormalization, and 6 (21%) had restrictive physiology. The subgroup analysis results of peak exercise parameters in subjects with and without diastolic dysfunction are listed in Table 4 . Diastolic dysfunction was associated with a lower percentage of predicted peak VO 2 in both positions and work in the supine posture ( Figure 2 ). The exercise parameters at VAT were not different. In the normal diastolic function group, near significant increases were found in the peak work (p = 0.07) and oxygen pulse (p = 0.08) with supine exercise compared to upright.


