Electrocardiography is an excellent tool for decision making in patients with ST elevation myocardial infarction (STEMI). However, little is known on the correlation between its dynamic changes during primary percutaneous coronary intervention (PCI) and the anatomic information provided by cardiovascular magnetic resonance. The study aimed to assess the predictive value of dynamic ST-segment changes before and after PCI on myocardial area at risk (AAR), infarct size, and left ventricular function in patients with STEMI. Eighty-five consecutive patients with a first STEMI were included. An electrocardiogram was recorded before and after PCI at 1, 24, 48, 72, and 120 hours. Sum of ST elevation (sumSTE), the number of STE, and STE resolution (resSTE) were determined. Complete resSTE was defined as ≥70% resolution, and patients were classified into 3 groups: group 1 (resSTE 1 hour after PCI) n = 39; group 2 (resSTE 120 hour after PCI) n = 27; and group 3, without resSTE (n = 19). Cardiovascular magnetic resonance was performed during hospitalization and at 6 months. Left ventricular volumes, ejection fraction, AAR, infarct size, myocardial salvage index, and microvascular obstruction were determined. Before PCI, the number of STE and sumSTE were best associated with AAR (p <0.001). After PCI, lack of resSTE (group 3) was associated with larger infarct size, MVO, and lower myocardial salvage index. However, sumSTE at 120 hours after PCI best discriminated patients with larger infarct size, ventricular volumes, and lower ejection fraction during hospitalization and at follow-up. In conclusion, admission sumSTE best correlates with AAR, whereas sumSTE at 120 hours rather than early resSTE best correlates with infarct size and left ventricular volumes during hospitalization and at 6 months.
In the setting of an ST elevation acute myocardial infarction (STEMI) and before reperfusion, clinical and experimental studies showed the correlation among the number of leads with ST-segment elevation (numSTE), the sum of ST elevation (sumSTE), and the extent of myocardial necrosis. However, little information exists on the main parameters that determine ST elevation at admission compared with cardiovascular magnetic resonance (CMR). After primary percutaneous coronary intervention (PCI), lack of ST-segment resolution (resSTE), despite the presence of a Thrombolysis In Myocardial Infarction (TIMI) 3 coronary blood flow, has been correlated with the presence of microvascular obstruction (MVO), increased infarct size, and worse prognosis. A few studies have compared these findings with data obtained from CMR. Although the prognostic role of electrocardiogram in patients with STEMI has been clearly demonstrated, because of their dynamic changes over time, no established consensus exists on which electrocardiographic (ECG) parameter and when these changes should be measured. The aim of our study was to analyze the predictive value of the different ECG parameters (numSTE, sumSTE, and resSTE) before and after PCI in patients with a first STEMI to determine area at risk (AAR), infarct size, and the recovery of overall and regional left ventricular function after optimal reperfusion therapy. Assessment of these dynamic ECG changes would provide information on which measurements to analyze and the optimal timing after PCI.
Methods
From October 2009 to May 2011, 91 patients admitted because of an STEMI successfully reperfused through PCI were prospectively included. Inclusion criteria were chest pain lasting >30 minutes, ST-segment elevation on electrocardiogram ≥0.1 mV in ≥2 adjacent leads, and PCI performed within the first 24 hours after symptom onset. Exclusion criteria were hemodynamic instability, presence of acute pulmonary edema or cardiogenic shock just before CMR, any other contraindication to the test, or a previous acute myocardial infarction. Six patients (7%) were excluded from the study: 5 (6%) because CMR could not be performed owing to claustrophobia and 1 (1%) because all ECG registries could not be analyzed. Finally, 85 patients who met all study requirements were evaluated. The protocol was approved by the Ethics Committee of our institution, and all patients signed their informed consent.
A standard 12-lead electrocardiogram was recorded on admission and at 1, 24, 72, and 120 hours (before patient discharge) after PCI; paper speed was 25 mm/s and amplification 10 mm/mV. ECG data were evaluated by the consensus of 2 independent observers. STE was considered if ≥0.25 mV in men aged <40 years, ≥0.2 mV in men aged >40 years, or ≥0.15 mV in women in leads V 2 and V 3 and/or ≥0.1 mV in other leads according to current guidelines. The isoelectric line was accepted at the level of the preceding TP segment, and STE was measured at the J point. The following ECG parameters were determined in every electrocardiography: (1) sumSTE: calculated as the sum of STE in all leads, (2) numSTE: calculated as the number of leads with STE, and (3) resSTE: calculated as the percent reduction in the sumSTE obtained on admission and at each time point after PCI. Complete resSTE was considered as a resSTE reduction ≥70%.
According to the latter, patients were classified into 3 groups: (1) early complete resSTE (group 1): patients with resSTE 1 hour after PCI, (2) late complete resSTE (group 2): patients without resSTE 1 hour after PCI but with resSTE 120 hours after PCI, and (3) without early or late complete resSTE (group 3): patients without resSTE after PCI and at 120 hours.
Also, the sumSTE 120 hours after PCI was classified into quartiles and patients were assigned to these 4 groups.
Coronary angiography was performed in all patients, and findings were visually interpreted by the consensus of 2 experienced observers. A loading dose of clopidogrel 600 mg and aspirin 300 mg orally was given to all patients. The culprit artery was identified according to the presence of thrombus, total occlusion, or delayed anterograde flow, and PCI was carried out in all patients. All patients received an intravenous bolus of heparin 100 UI/kg and 72 (85%) platelet glycoprotein IIb/IIIa inhibitors at the discretion of the interventional cardiologist. Anterograde flow in the infarct-related artery before and after PCI was evaluated using the TIMI classification. Myocardial blush grade (MBG) was also evaluated. The extent of coronary artery disease was assessed as the number of main epicardial vessels with significant coronary stenosis (≥70%), and left main trunk stenosis was considered significant when ≥50%. Collateral flow was evaluated before PCI according to the Rentrop scale.
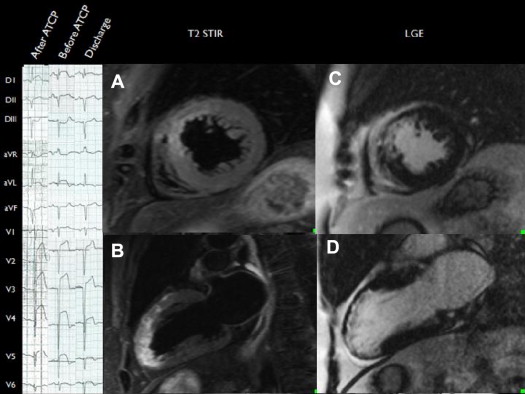
All CMR studies were performed with a 1.5-T equipment (Avanto; Siemens, Erlangen, Germany). Images were obtained in synchronization with the electrocardiogram and in apnea. Short-axis cine views were performed to quantify volumes and ejection fraction (EF) (SSFP sequences, matrix 256 × 256, field of view 300 to 370 mm, temporal resolution <50 ms). A T2-weighted triple inversion recovery breath-hold pulse sequence (STIR) was used to evaluate the edema (matrix 256 × 256, field of view 300 to 370 mm, temporal resolution <50 ms, repetition time 2 RR intervals, echo time 100 ms, inversion time 170 ms, flip angle 160°, bandwidth 781 Hz/pixel). A single-shot saturation recovery gradient echo pulse sequence (90° prepulse, repetition time/echo time 2.1/1.0 ms, saturation time 120 ms, flip angle 12°, matrix 128 × 93, slice thickness 6 mm) was used for first-pass perfusion during administration of 0.1 mmol/kg of dimegluminegadopentetate (Magnevist, Bayer HealthCare, Germany) at a rate of 3 ml/s. Three short-axis slices (basal, mid ventricular, and apical segments) were obtained per heartbeat. An additional 0.1 mmol/kg of contrast was administered immediately after first-pass perfusion. Finally, late enhancement sequences were obtained 15 minutes after contrast injection (matrix 256 × 256, field of view 300 to 370 mm, and optimal inversion time to suppress the myocardium signal). Baseline scan was scheduled 2 to 7 days after reperfusion and follow-up CMR at 6 months.
All studies were conducted on a workstation (QMASS MR 7.2; Medis Medical Imaging Systems, The Netherlands) by a cardiologist specialized in cardiac imaging and blinded to both clinical and angiographic results. Endocardial and epicardial borders were delineated at end-systole and end-diastole with short-axis views to quantify volumes, functions, and left ventricle mass. The myocardial AAR was quantified in T2-STIR sequences delineating the areas of intensity, plus 2 SDs above average, obtained from the remote healthy myocardium, and normalized by the left ventricular mass. First-pass perfusion was evaluated qualitatively if a region of hypoperfusion persisted >1 minute after contrast bolus arrival in the left ventricle and was located at the subendocardium. Quantification of the infarcted myocardium was assessed by delineating the enhanced areas in the late enhancement sequences, with 5 SDs above average, obtained from the remote healthy myocardium, and normalized by the left ventricular mass. The hypoenhanced areas, considered as MVO, were included in the infarct volume. Myocardial salvage index was calculated as the difference in AAR minus the size of the necrosis and divided by the AAR. At follow-up, left ventricular remodeling was considered if the end-diastolic volume increased by 20%.
Continuous demographic variables are expressed as mean ± SD. The Kolmogorov-Smirnov test was used to evaluate the normality distribution of variables. Differences among groups for continuous parameters were assessed by Student t test if they presented a normal distribution or analysis of variance with Bonferroni correction for multiple comparisons and Mann-Whitney U test if they did not present a normal distribution. For categorical variables, general characteristics of the sample are presented as percentages (assessed by chi-square test). Correlations among continuous variables were calculated using the Pearson correlation coefficient (r) if a normal distribution was present and the Spearman correlation coefficient if the distribution was not normal.
Receiver operating characteristic curve analyses for predicting MVO were performed for sumSTE and numSTE at all time points. The areas under the receiver operating characteristic curve were compared.
Multivariate linear regression analyses with a forward selection procedure were used to identify independent predictors of sumSTE and numSTE at admission, and multivariate logistic regression analyses were applied to identify independent predictors of resSTE after percutaneous transluminal coronary angioplasty. Variables were entered into the model if p <0.10 in univariate analyses.
A 2-tailed p value <0.05 was considered statistically significant. SPSS 19.0 software version (IBM SPSS Statistics, Chicago, Illinois) was used for the analysis.
Results
Demographic data of the population are listed in Table 1 . Before PCI, 79 patients (93%) presented with a TIMI flow grade 0, 4 patients (4%) with a TIMI flow grade 1, and 2 patients (3%) with a TIMI flow grade 2. After PCI, of the 6 patients with TIMI flow 2, 1 (17%) had MBG 2, 2 (33%) had MBG 1, and 3 (50%) had MBG 0. Of the 79 patients with TIMI flow 3, 46 (59%) had MBG 3, 25 (32%) had MBG 2, 5 (6%) had MBG 1, and 3 (3%) had MBG 0.
| Variable | All Patients (n = 85) |
|---|---|
| Age (yrs) | 58 ± 14 |
| Men | 75 (88) |
| Body mass index (kg/m 2 ) | 28 ± 3.6 |
| Hypertension ∗ | 43 (51) |
| Diabetes mellitus | 14 (16) |
| Dyslipidemia † | 26 (30) |
| Smoker | 60 (71) |
| Time to reperfusion (minutes) | 229 ± 69 |
| ECG | |
| Before PCI | |
| NumSTE at admission | 5.4 ± 1.9 |
| SumSTE at admission (mV) | 17 ± 11 |
| Before discharge | |
| NumSTE 120 hours after PCI | 2.6 ± 2.5 |
| SumSTE 120 hours after PCI (mV) | 3.7 ± 4.3 |
| Maximum total CK-MB (IU/L) | 290 ± 164 |
| Maximum total troponin T (ng/L) | 7.8 ± 5.8 |
| Coronary angiography | |
| Infarct-related artery | |
| Left anterior descending | 37 (44) |
| Left circumflex | 14 (16) |
| Right | 34 (41) |
| Collateral flow (Rentrop score) | |
| 0 | 42 (49) |
| 1 | 30 (35) |
| 2 | 13 (15) |
| TIMI flow grade after PCI | |
| 2 | 6 (7) |
| 3 | 79 (93) |
| MBG after PCI | |
| 0 | 5 (6) |
| 1 | 8 (9) |
| 2 | 26 (31) |
| 3 | 46 (54) |
| Platelet glycoprotein IIb/IIIa inhibitors | 72 (85) |
| Medical treatment at discharge | |
| Aspirin | 85 (100) |
| Clopidogrel | 85 (100) |
| Statins | 85 (100) |
| β Blockers | 81 (95) |
| ACE inhibitors/ATII antagonists | 59 (69) |
| Eplerenone | 17 (20) |
∗ Systolic blood pressure ≥140 mm Hg or a diastolic blood pressure ≥ 90 mm Hg.
† Total cholesterol ≥200 mg/dl, low-density lipoprotein cholesterol ≥130 mg/dl, or current medication use.
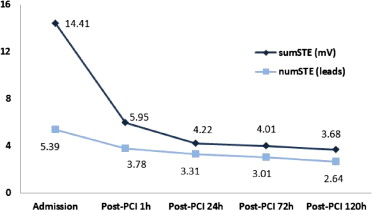
The evolution of sumSTE and numSTE in the different electrocardiograms performed during hospitalization is shown in Figure 1 .
Before PCI, a significant correlation was observed between numSTE (r = 0.6, p <0.001) and sumSTE (r = 0.6, p <0.001) with the myocardial AAR. Mean AAR was 48 ± 25 g (range 17 to 90). Furthermore, patients with shorter time to reperfusion (first quartile ≤2.9 hours) showed higher sumSTE and numSTE; however, no statistically significant differences were observed among the different groups (p = 0.29 for sumSTE and p = 0.08 for numSTE). SumSTE and numSTE tended to be lower in patients with collateral flow (Rentrop ≥1) than in patients with no collateral flow (sumSTE: p = 0.67 and numSTE: p = 0.16). Moreover, patients in whom the left anterior descending artery was the culprit artery presented a larger AAR, numSTE, and sumSTE than other coronary arteries ( Table 2 ). The strongest significant predictors of AAR after multivariate analysis were sumSTE at admission and the culprit artery (β = 0.29, p = 0.01 and β = 0.48, p <0.01, respectively).
| Variable | LAD | LC | Right | p Value |
|---|---|---|---|---|
| AAR (g) | 65 ± 25 (56–75) | 34 ± 16 (24–45) | 35 ± 12 (30–40) | <0.0001 |
| NumSTE (leads) | 6.5 ± 1.6 (6–7) | 5 ± 1.5 (4–6) | 4.3 ± 1.8 (4–5) | <0.0001 |
| SumSTE (mV) | 22 ± 12 (17–26) | 10 ± 5 (7–14) | 16 ± 10 (11–19) | <0.0001 |
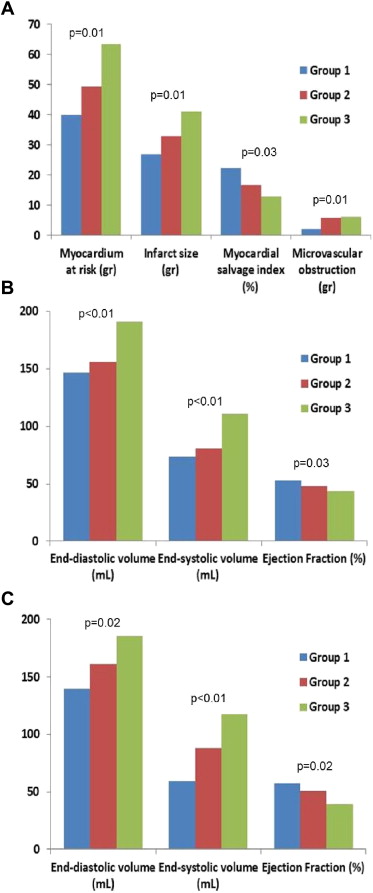
After PCI, 39 patients (46%) achieved early complete resSTE (≥70% resSTE; group 1), 27 (32%) late complete resSTE (group 2), and 19 (22%) did not achieve either early or late complete resSTE (group 3). No differences were observed in time to reperfusion (p = 0.82) or clinical parameters among the 3 groups. However, patients in group 3 showed larger AAR, infarct size, and MVO and lower myocardial salvage index compared with groups 1 and 2. Furthermore, patients in group 3 presented a higher incidence of anterior myocardial infarction compared with the other 2 groups (p <0.01; Figures 2 and 4 ). When late resSTE was dichotomized according to complete (≥70%) versus incomplete (<70%), the main parameters correlating with incomplete resSTE in the multivariate analysis were myocardial necrosis (grams) (Exp[B]: 1.5, p = 0.05) and left anterior descending artery as the infarct-related vessel (Exp[B]: 1.18, p = 0.02).
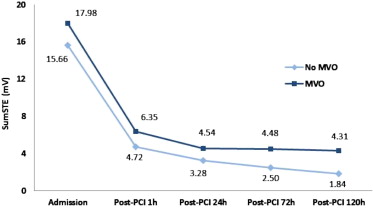
After PCI, the relation between resSTE and sumSTE at different time points (1, 24, 72, and 120 hours) and CMR-derived variables was also analyzed. SumSTE at 120 hours after PCI showed the best correlation with the CMR-derived variables ( Table 3 ). When this parameter was classified in quartiles, no differences were observed in clinical parameters among these 4 groups. However, patients in the fourth quartile showed higher myocardial AAR, infarct size, MVO, myocardial salvage index, and degree of transmurality compared with the remaining quartiles ( Table 4 ). SumSTE at 120 hours was the only significant predictor of myocardial necrosis (grams) in the multivariate analysis (β = 0.32, p <0.01).
| Parameter | ResSTE at 1 h | ResSTE at 24 h | ResSTE at 72 h | ResSTE at 120 h | SumSTE at 1 h | SumSTE at 24 h | SumSTE at 72 h | SumSTE at 120 h |
|---|---|---|---|---|---|---|---|---|
| Hospitalization | ||||||||
| End-diastolic volume (ml) | −0.16 (0.20) | −0.15 (0.22) | −0.22 (0.10) | −0.27 (0.03) | 0.36 (0.02) | 0.44 (<0.01) | 0.45 (<0.01) | 0.45 (<0.01) |
| End-systolic volume (ml) | −0.13 (0.28) | −0.09 (0.46) | −0.19 (0.12) | −0.25 (0.05) | 0.37 (<0.01) | 0.47 (<0.01) | 0.49 (<0.01) | 0.52 (<0.01) |
| EF (%) | 0.10 (0.42) | 0.09 (0.48) | 0.11 (0.41) | 0.13 (0.30) | −0.18 (0.13) | −0.28 (0.02) | −0.31 (0.01) | −0.32 (0.01) |
| Infarct size (g) | −0.12 (0.34) | −0.17 (0.16) | −0.17 (0.18) | −0.16 (0.21) | 0.48 (<0.01) | 0.51 (<0.01) | 0.57 (<0.01) | 0.61 (<0.01) |
| MVO (g) | −0.10 (0.44) | −0.15 (0.21) | −0.14 (0.31) | −0.11 (0.38) | 0.33 (0.01) | 0.40 (<0.01) | 0.40 (<0.01) | 0.41 (<0.01) |
| Follow-up (6 mo) | ||||||||
| End-diastolic volume (ml) | −0.10 (0.65) | −0.15 (0.94) | −0.24 (0.12) | −0.28 (0.20) | 0.35 (0.09) | 0.37 (0.07) | 0.42 (0.02) | 0.50 (0.02) |
| End-systolic volume (ml) | −0.23 (0.29) | −0.20 (0.48) | −0.27 (0.18) | −0.38 (0.08) | 0.47 (0.02) | 0.53 (0.01) | 0.58 (<0.01) | 0.62 (<0.01) |
| EF (%) | 0.25 (0.20) | 0.23 (0.28) | 0.25 (0.23) | 0.27 (0.21) | −0.39 (0.05) | −0.46 (0.03) | −0.46 (0.02) | −0.48 (0.02) |
Stay updated, free articles. Join our Telegram channel

Full access? Get Clinical Tree


