We compare the diagnostic accuracy of multidetector row computed tomography (MDCT) to cardiac magnetic resonance imaging (CMR) for evaluating global left ventricular function. We systematically searched PubMed, CINAHL, Cochrane CENTRAL, Scopus, and the Web of Science databases for studies published between 1966 to January 2013 that compared left ventricle (LV) volumes, ejection fraction (EF) and LV mass measured by MDCT and CMR. We performed meta-analyses and used random-effects model with inverse variance weighting test to determine the overall bias and limits of agreement of LV end-diastolic volume, end-systolic volume, stroke volume, and EF measured by MDCT and CMR. Furthermore, subgroup analyses were performed to compare 16-slice and 64-slice MDCT with CMR. Two study authors independently reviewed the 90 articles originally identified and selected 27 studies (n = 831) for analysis. Excellent correlation and a linear relation were seen between MDCT and CMR for LV end-diastolic volume (r = 0.93; p <0.001), LV end-systolic volume (r = 0.95; p <0.001), LV stroke volume (r = 0.85; p <0.001), LV ejection fraction (r = 0.93; p <0.001), and LV mass (r = 0.86; p <0.001). Subgroup analyses showed strong positive correlations for both 16- and 64-slice MDCT. In conclusion, although not the first-line test for LV function assessment in most patients, when appropriate, retrospectively gated MDCT provides an accurate and valid assessment of LV function compared with CMR.
Multidetector row computed tomography (MDCT) has emerged as a promising tool for noninvasive cardiac imaging and has been shown to be very sensitive and have very high negative predictive value for detecting obstructive coronary artery disease. High-resolution images of the entire heart can be obtained, and assessment of cardiac function is feasible by MDCT with retrospective electrocardiographic gating. MDCT allows rapid image acquisition and can be performed safely in patients with devices. In this article, we investigate the accuracy of MDCT for left ventricle (LV) function assessment by systematically reviewing the published reports and performing meta-analysis of the studies evaluating global LV function by MDCT as compared with current reference standard of cardiac magnetic resonance imaging (CMR).
Methods
Meta-analysis was performed in accordance with the Meta-Analysis of Observational Studies in Epidemiology guidelines. A checklist of each of the Meta-Analysis of Observational Studies in Epidemiology criteria and how they were handled in our study is listed in Supplementary Table 1 .
A systematic search of studies published between 1966 and January 2013 using PubMed, CINAHL, Cochrane CENTRAL, Scopus, and the Web of Science databases for studies that compared LV volumes, ejection fraction (EF), and LV mass measured by MDCT and CMR was carried out. All relevant combinations of following keywords were included for database search: (Multi Detector Row) Computed Tomography, CT, MDCT, Magnetic Resonance Imaging, MRI, CMR (Left Ventricular) Function, (Left Ventricular) end diastolic volume, (Left Ventricular) end systolic volume, (Left Ventricular) Ejection (fraction), (Left Ventricular) stroke volume, and (Left Ventricular) muscle mass. We also hand searched bibliographies of retrieved articles for additional references. We placed no restrictions on language.
Clinical studies in which the left ventricular assessment was performed using both MDCT and magnetic resonance imaging (MRI) were included. Left ventricular assessment included calculation of at least one of the following measures: (i) end-diastolic volume (EDV), (ii) end-systolic volume (ESV), (iii) EF, (iv) stroke volume, or (v) left ventricular muscle mass. Only those studies in which both the data were presented as mean ± SD were included for analysis.
Data abstraction and study appraisal were performed by 2 independent reviewers (AS and AV) independently. Discrepancies between reviewers were discussed until consensus was reached. The manuscript of selected titles/abstracts was reviewed for inclusion. Using predetermined selection criteria, 2 reviewers (AS and AV) independently determined the articles to be included and excluded. Data from the relevant articles were extracted using predefined extraction forms. The data extraction was performed by 2 independent reviewers (AS and AV). Any disagreements in data extraction were discussed until consensus was reached. Whether retrospective gating was performed with full tube current throughout or with tube current modulation (standard tube current modulation or MinDose tube current modulation) was also noted.
Mix 2.0 Pro(Biostat XL) software was used to analyze the data. A random-effects model with inverse variance weighting was used to calculate pooled mean difference in LV measure and corresponding confidence interval. Heterogeneity between studies was assessed using Cochrane’s Q test and I 2 statistic, which denotes the percentage of total variation across studies that is a result of heterogeneity rather than chance. Heterogeneity was considered significant if the p value was less than 0.05. Publication bias was assessed by Begg’s test and Egger’s regression test. The influence of individual studies was examined by removing each study at a time to assess the degree to which meta-analysis estimate depends on a particular study (exclusion sensitivity analysis). A random-effects model with inverse variance weighting was used to calculate the pooled correlation coefficient and the corresponding confidence interval. Assessment of publication bias and exclusion sensitivity analysis was performed for meta-analysis of each LV measure. Subgroup analyses were performed to identify the association of detector rows of MDCT and accuracy of assessment of LV function.
Results
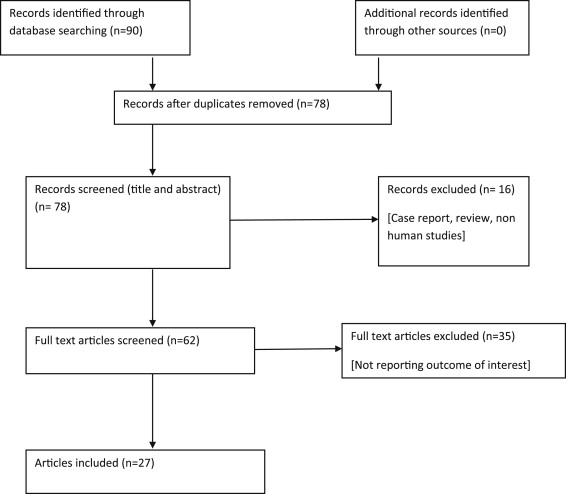
A total of 27 studies were identified (n = 831; Figure 1 ). Sample size ranged from 7 to 88 subjects. The average age of all patients was 59.9 years. The study population predominantly comprised patients with suspected or known coronary artery disease. Measurement of EDV, ESV, EF, stroke volume, and LV mass (in terms of mean ± standard difference) as calculated by MDCT and MRI was presented in 22, 22, 23, 17, and 15 studies, respectively. Baseline characteristics of studies have been summarized in Table 1 . Publication bias was not detected by Begg’s and Egger’s regression test for any of LV measures.
| Author | n | Mean Age (yrs) | Male (%) | Patients Characteristics | CT Scan Used | MRI Used | CT Vendor | MRI Vendor |
|---|---|---|---|---|---|---|---|---|
| Ehrhard et al | 7 | 61.5 | n/a | CAD | 4 Slice | 1.5 T MRI | Siemens Somatom volume zoom | Siemens Magnetom Sonata |
| Grude et al | 30 | 57 | 90 | Suspected CAD | 4 Slice | 1.5 T MRI | Siemens Somatom volume zoom | Siemens Magnetom Vision |
| Halliburton et al | 15 | 56 | 73 | CAD | 4 Slice | 1.5 T MRI | Siemens Somatom volume zoom | Siemens Magnetom Sonata |
| Heuschmid et al | 31 | 63 | n/a | Known or suspected CAD | 16 Slice | 1.5 T MRI | Siemens Somatom sensation | Siemens Magnetom Sonata |
| Juergens et al | 30 | 59 | 83 | Known or suspected CAD | 4 Slice | 1.5 T MRI | Siemens Somatom volume zoom | Philips Gyroscan Intera |
| Mahnken et al | 21 | 66 | 86 | Known or suspected CAD | 16 Slice | 1.5 T MRI | Siemens Somatom sensation | Philips Gyroscan Intera |
| Mahnken et al | 15 | 58 | 87 | Known CAD | 4 Slice | 1.5 T MRI | Siemens Somatom volume zoom | Philips ACS-NT |
| Mahnken et al | 16 | 57 | 88 | Postmyocardial infarction | 4 Slice | 1.5 T MRI | Siemens Somatom volume zoom | Philips ACS-NT |
| Schlosser et al ∗ , | 18 | 57 | 83 | Known or suspected CAD | 16 Slice | 1.5 T MRI | Siemens Somatom sensation | Siemens Magnetom Sonata |
| Yamamuro et al | 50 | 67 | 56 | Mixed population † | 8 Slice | 1.5 T MRI | Toshiba Aquilon | Symphony; Siemen, Erlangen, Germany |
| Dewey et al | 88 | 62 | 73 | Suspected CAD | 16 Slice | 1.5 T MRI | Aquilion, Toshiba | Magnetom Sonata, Siemens |
| Schlosser et al | 21 | 64 | 76 | Suspected CAD | 64 Slice | 1.5 T MRI | Somatom Sensation cardiac 64; Siemens | Magnetom Sonata; Siemens |
| Belge et al | 40 | 60 | 80 | Known CAD | 16 Slice | 1.5 T MRI | IDT, Philips Medical Systems | Intera CV, Philips Medical Systems |
| Wu et al | 63 | 64 | 73 | Known or suspected CAD | 64 Slice | 1.5 T MRI | Aquilion 64; Toshiba, Otawara, Japan | Symphony; Siemens |
| Guo et al | 51 | 37 | 43 | Mitral regurgitation | 64 Slice | 1.5 T MRI | Brilliance 64, Philips Medical System | Magnetom Sonata, Siemens |
| Akram et al | 20 | 57 | 70 | Suspected CAD | 64 Slice | 1.5 T MRI | Somatom 64, Siemens, Erlangen, Germany | Argus; Siemens Medical Solutions |
| Heuschmid et al | 52 | 63 | 79 | Suspected CAD | 16 Slice | 1.5 T MRI | Somatom Sensation 16, Siemens | Magnetom Sonata, Siemens |
| Koch et al | 19 | 69 | 74 | Suspected CAD | 16 Slice | 1.5 T MRI | MX8000IDT, Philips, Hamburg, Germany | Magnetom Sonata, Siemens, Erlangen |
| Raman et al | 24 | 60 | 68 | Known or suspected CAD | 16 Slice | 1.5 T MRI | LightSpeed-16 (GE Healthcare, Milwaukee, WI) | CVi, GE Healthcare |
| Fuchs et al | 53 | 61 | 75 | Previous MI | 64 Slice | 1.5 T MRI | Aquillion; Toshiba, Tokyo, Japan | Avanto; Siemens, Erlangen, Germany |
| Sarwar et al | 21 | 60 | 91 | After reperfused STEMI | 64 Slice | 1.5 T MRI | Sensation 64; Siemens, Forchheim, Germany | Twin-Speed Excite; General Electric, NY |
| Annuar et al | 32 | 56 | 97 | Suspected CAD, previous MI or CABG | 64 Slice | 1.5 T MRI | Somatom Sensation 64 cardiac, Siemens | Intera, Release 9, Philips |
| Salm et al | 25 | 67 | 96 | Suspected CAD | 16 Slice | 1.5 T MRI | Aquilion 16, Toshiba, Japan | Gyroscan ACS-NT MR scanner Philips |
| Mahnken et al | 9 | 55 | 89 | History of MI | 16 Slice | 1.5 T MRI | Sensation 16, Siemens, Forchheim, Germany | Intera, Philips Medical Systems |
| Mahnken et al | 30 | 60 | 87 | Known or suspected CAD | 16 Slice | 1.5 T MRI | Somatom Sensation 16, release VB 10, Siemens | Gyroscan Intera, Philips Medical Systems |
| de la Peña Almaguer et al | 20 | 52 | 60 | Known or suspected CAD | 16 Slice | 1.5 T MRI | GE Lightspeed, (GE Medical Systems, Milwaukee, WI) | GE Medical Systems |
| Fischbach et al | 30 | 64 | 64 | Suspected CAD | 16 Slice | 1.5 T MRI | Somatom Sensation 16, Siemens Medical Solutions | Gyroscan Intera, software release 9.1 Philips Medical Systems |
∗ Data only from automated calculation are included.
† Twenty patients had aortic and/or mitral valve disease, 12 had MI, 12 had angina pectoris, 2 had infectious endocarditis, 2 had sarcoidosis, 1 had pericarditis, and 1 had dilated cardiomyopathy.
LV parameters were estimated using 4-, 8-, 16-, and 64-detector MDCT in 6, 1, 13, and 7 studies. The average radiation dose with MDCT in various studies varies from 6 to 16 mSv depending on the scan range, patient gender, and data acquisition protocols.
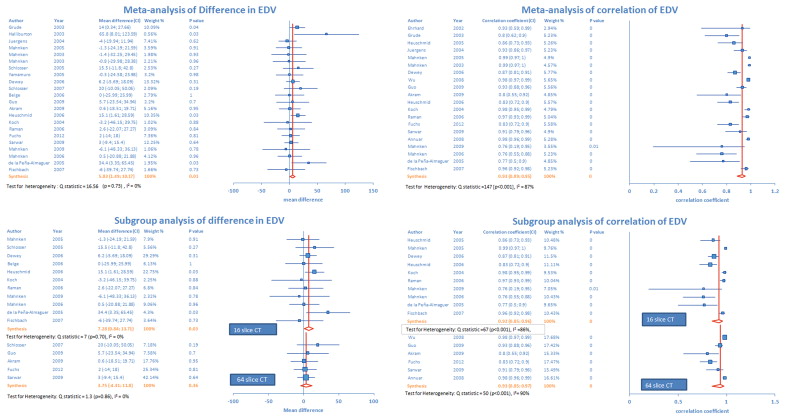
There was a significant mean difference (5.83 ml, p = 0.01) in EDV measurement as assessed by MDCT and MRI in 22 studies ( Figure 2 ). There was low heterogeneity across the studies. Figure 2 displays the degree of correlation between EDV measurements using both scanning procedures in 20 studies. Pooled analysis revealed positive correlation of 0.93 (p <0.001) between MDCT and MRI measurement of EDV. There was significant heterogeneity across the studies. Sensitivity analysis demonstrated that pooled estimate did not change with exclusion of any 1 study for both effect size measures.
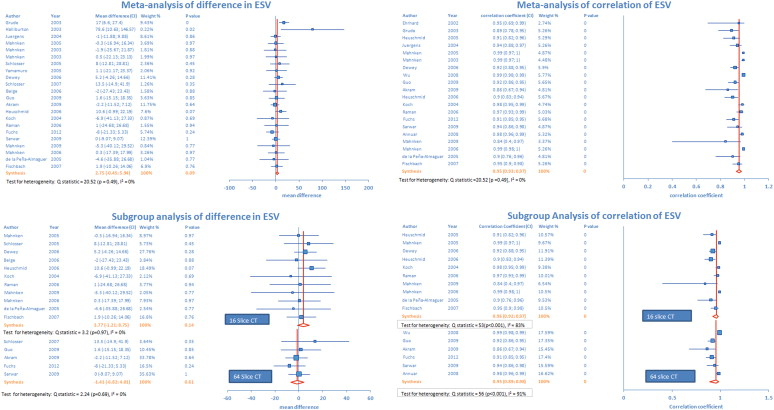
Pooled studies (n = 22) revealed nonsignificant difference of 2.75 ml (p = 0.09) in ESV measurement by MDCT and MRI ( Figure 3 ). There was low heterogeneity across the studies. Sensitivity analysis showed that pooled estimate of mean difference in ESV measurement became significant with the exclusion of 2 studies. Exclusion of the study by Akram et al increased the pooled estimate of mean difference in measurements to 3.4 ml (p = 0.049). Pooled analysis after exclusion of the study by Fuchs et al revealed a mean difference of 3.4 ml (p = 0.043). Pooled analysis from 20 studies revealed significant positive correlation of 0.95 (p <0.001) between ESV measurements using both scanning methods ( Figure 3 ). However, there was significant heterogeneity across the studies. Sensitivity analysis demonstrated that pooled estimate did not change after exclusion of any 1 study.
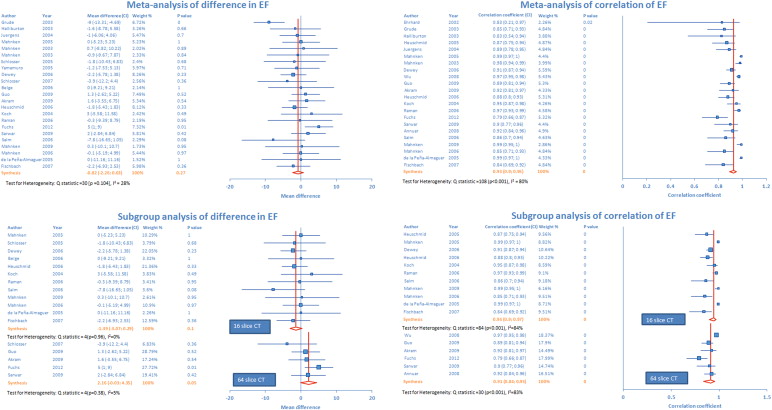
Pooled analysis (n = 22) did not reveal any statistically significant mean difference (0.8%, p = 0.27) in MDCT and MRI measurements of left ventricular EF ( Figure 4 ). There was moderate heterogeneity across the studies. There was significant positive correlation (r = 0.93, p <0.001) between MDCT and MRI measurements of EF ( Figure 4 ). Exclusion sensitivity analysis did not show any significant change in pooled estimate after exclusion of any single study.
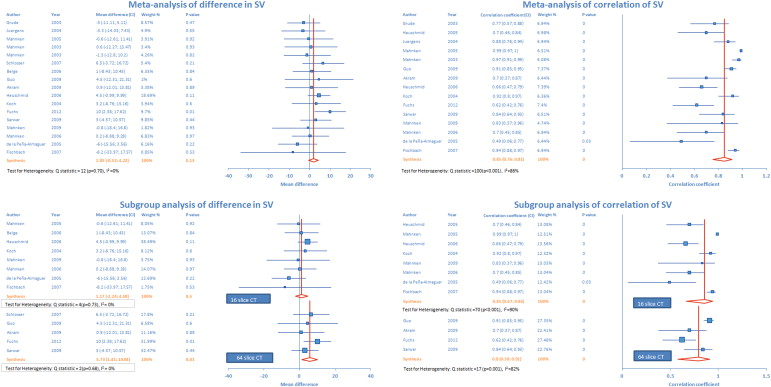
Pooled analysis (n = 17) did not reveal any statistically significant mean difference (1.85 ml, p = 0.13) in measurement of stroke volume by MDCT and MRI ( Figure 5 ). Heterogeneity analysis was not significant. There was a significant positive correlation between stroke volume measurement using MDCT and MRI (r = 0.85, p <0.001; Figure 5 ). Exclusion sensitivity analysis showed that statistical results did not change significantly after exclusion of any single study.
There was no statistical difference in myocardial mass estimation (average difference = 3.13 g, p = 0.35) by MDCT and MRI ( Figure 6 ). Pooled analysis from 11 studies revealed positive correlation (r = 0.86, p <0.001) between MDCT and MRI measurements of myocardial mass ( Figure 6 ). For both correlation and difference in myocardial mass measurement, there was significant heterogeneity across the studies, but sensitivity analysis did not demonstrate statistical significance with exclusion of any particular study.


