Osteocalcin, a bone-derived polypeptide, was recently found to have hormonal function associated with metabolic disorders and atherosclerosis. Few studies have examined the association between circulating osteocalcin and coronary heart disease (CHD) risk. The aim of the present study was to investigate whether serum osteocalcin concentration was associated with CHD risk and metabolic profiles in Chinese adults. A total of 461 subjects (243 with CHD and 218 without CHD) who underwent coronary angiography were included. Serum osteocalcin, glucose, lipid profiles, and other biochemical markers were measured. Severity of coronary atherosclerosis was estimated by number of diseased vessels. Results showed that serum osteocalcin levels were significantly lower in the CHD group (12.2 ng/ml, 9.5 to 15.1) than in the non-CHD group (13.6 ng/ml, 10.7 to 18.0, p = 0.001) and were significantly decreased with the increasing of number of diseased vessels (p = 0.005). Serum osteocalcin concentration was inversely correlated with fasting and post load 2 hour plasma glucose and hemoglobin A 1c (p = 0.044, 0.043, and 0.011, respectively), adjusting for CHD status. Odds ratios (95% confidence intervals) of CHD across increasing quartiles of serum osteocalcin were 0.68 (0.42 to 1.12), 0.59 (0.36 to 0.98), and 0.40 (0.23 to 0.69). The test for trend was significant (p = 0.0007). Adjusting for age, body mass index, and other conventional risk factors for CHD did not appreciably change the results. Spline regression analyses indicated a linear relation between serum osteocalcin level and CHD risk. In conclusion, our data indicate that serum osteocalcin level was associated with decreased risk of CHD and protective metabolic changes in Chinese adults.
Bone and cardiovascular diseases have long been suspected to be linked to each other. Osteocalcin is a bone-derived 49-residue polypeptide. In an animal study, osteocalcin knockout mice display an increased accumulation of visceral fat associated with glucose intolerance and insulin resistance early in life. In humans, serum osteocalcin was inversely associated with fasting glucose and insulin, homeostasis model assessment of insulin resistance (HOMA-IR), body mass index (BMI), and fat mass. A recent study in type 2 diabetic patients found that osteocalcin was negatively correlated with parameters of peripheral atherosclerosis, intima–media thickness, and ankle–brachial pulse-wave velocity. These data suggest that osteocalcin might be involved in the development of metabolic and cardiovascular diseases. However, direct evidence on the relation between serum osteocalcin level and risk of coronary heart disease (CHD) in humans is sparse. In this study we examined the association between serum osteocalcin level and CHD in Chinese adults. We also assessed correlations between serum osteocalcin and metabolic risk factors for CHD.
Methods
The present study included 461 consecutive patients (299 men and 162 women, age ranges 39 to 84 and 41 to 85 years, means 61.7 and 63.3, respectively) who were referred to the department of cardiology in Ruijin Hospital (Shanghai, China) because of symptoms in the chest such as chest pain, chest heaviness, periodic discomfort, and palpitations from January 2005 to December 2007. In all subjects, coronary angiography for diagnosis of CHD was performed. Those with medical illnesses such as acute infection, chronic hepatic and renal dysfunctions (including serum alanine aminotransferase >120 IU/L, aspartate aminotransaminase >80 IU/L, and serum creatinine >2.0 mg/dl) or nutritional derangements, malignancies, and other severe medical illnesses were excluded (n = 63). All patients were free of drugs known to influence bone and calcium metabolism. All patients were Chinese living in the Shanghai region and gave informed consent. This study was approved by the institutional review board of Ruijin Hospital and complied with the Declaration of Helsinki.
Coronary angiography was performed in multiple projections with the Judkins technique. Coronary stenosis with lumen narrowing >50% was considered significant. CHD was diagnosed as the presence of ≥1 vessel with significant stenosis in a given subject. Extent of coronary atherosclerosis was defined as number of diseased vessels with significant stenosis in a given subject.
All patients were examined in the morning after an overnight fast of 10 to 12 hours. Date of birth, smoking history, alcohol consumption, and medical history were recorded. Height and weight (light clothes and without shoes), waist and hip circumferences, and blood pressure while sitting (measured on a patient’s nondominant arm supported at heart level) were determined by an experienced physician.
All serum and plasma samples were collected in the morning after an overnight fasting of 10 to 12 hours and without smoking. Samples were frozen immediately and stored at −80°C until assayed. Biochemical measurements of serum lipids and insulin were performed in a central laboratory (Shanghai Institute of Endocrinology and Metabolism, Shanghai, China). All patients were required to refrain from alcohol, cigarettes, and heavy physical exercise for ≥1 week before obtaining blood samples for biochemical measurement and performing the 75-g oral glucose tolerance test. Glucose was measured immediately using an enzymatic method (CX-7 Biochemical Autoanalyzer, Beckman Coulter, Inc, Brea, California). Serum insulin was measured using a double-antibody radioimmunoassay (DSL, Webster, Texas). Serum total cholesterol and triglycerides were measured by enzymatic methods (Beckman Coulter, Inc., Fullerton, California). High-density lipoprotein cholesterol and low-density lipoprotein cholesterol were determined by immunoinhibition methods (High-Density Lipoprotein Cholesterol and Low-Density Lipoprotein Cholesterol Direct, Wake Pure Chemical Industries, Ltd. GmbH, Neuss, Germany). Serum high-sensitivity C-reactive protein was measured using an enzyme-linked immunosorbent assay kit (BioCheck, Inc., Foster City, California). Serum osteocalcin levels were measured by electrochemiluminescence (Elecsys N-MID Osteocalcin Calset; Roche Diagnostics, Indianapolis, Indiana; interassay coefficient of variation <5%). HOMA-IR was calculated according to the following formula: (Fasting Serum Insulin [international microunits per milliliter] × Fasting Plasma Glucose [millimoles per liter])/22.5.
Statistical analysis was performed using the SPSS 13.0 for Windows (SPSS, Inc., Chicago, Illinois). Logarithmic transformation was performed for serum insulin, HOMA-IR, high-sensitivity C-reactive protein, hemoglobin A 1c (HbA 1c ), and serum osteocalcin to achieve normal distribution. Student’s t test (for data that were normally distributed) or Mann-Whitney test (not normally distributed) and chi-square test (for data that were categorical variables) were used to compare CHD and non-CHD samples. One-way analysis of variance was used to compare serum osteocalcin levels in groups according to number of diseased vessels (n = 0, 1, 2, ≥3). Correlations between serum osteocalcin and risk factors for CHD were determined using Spearman correlation coefficients. Odds ratios of CHD were calculated using a logistic regression models, adjusting for covariates including age, gender, BMI, smoking, alcohol, and family history of CHD and biochemical risk factors low-density lipoprotein cholesterol, high-density lipoprotein cholesterol, triglycerides, and diabetes. Serum osteocalcin level was analyzed in quartiles with the lowest quartile (quartile 1) as the reference. We also used restricted cubic spline regressions to model associations between serum osteocalcin concentration as a continuous variable and risk of CHD. Two-sided p values <0.05 were considered statistically significant.
Results
Clinical characteristics of the CHD and non-CHD groups are listed in Table 1 . Of participants included in this study, 243 (53%) were found to have CHD and 218 (47%) were found not to have CHD. Smoking history, alcohol use, type 2 diabetes percentage, HbA 1c , post load 2h serum insulin, and high-sensitivity C-reactive protein levels were significantly higher in the CHD group than in the non-CHD group (different at p ≤0.05).
| Variable | CHD | p Value | |
|---|---|---|---|
| Yes | No | ||
| (n = 243) | (n = 218) | ||
| Men/women | 189 (78%)/54 (22%) | 110 (50%)/108 (50%) | <0.001 |
| Age (years) | 62.7 ± 8.6 | 61.8 ± 9.2 | 0.300 |
| Current smoker | 120 (49.4%) | 52 (23.9%) | <0.001 |
| Alcohol use | 48 (19.8%) | 26 (11.9%) | 0.013 |
| Type 2 diabetes mellitus | 84 (34.6%) | 57 (26.1%) | 0.050 |
| Hypertension | 172 (70.8%) | 143 (65.6%) | 0.329 |
| Body mass index (kg/m 2 ) | 25.1 ± 3.4 | 25.5 ± 3.1 | 0.181 |
| Waist (cm) | 90.3 ± 9.0 | 90.7 ± 8.1 | 0.652 |
| Systolic blood pressure (mm Hg) | 133 ± 19 | 130 ± 18 | 0.100 |
| Diastolic blood pressure (mm Hg) | 79 ± 10 | 79 ± 11 | 0.468 |
| Fasting plasma glucose (mmol/L) | 5.78 ± 1.82 | 5.55 ± 1.53 | 0.194 |
| Plasma glucose 2 hours after load (mmol/L) | 9.12 ± 3.85 | 8.71 ± 3.59 | 0.256 |
| Hemoglobin A 1c (%) | 6.3 (5.8–6.9) | 6.0 (5.7–6.7) | 0.007 |
| Triglyceride (mmol/L)/(mg/dl) | 1.92 ± 1.06/170 ± 94 | 1.96 ± 1.63/173 ± 144 | 0.721 |
| Total cholesterol (mmol/L)/(mg/dl) | 4.53 ± 1.08/175 ± 42 | 4.60 ± 1.03/178 ± 40 | 0.501 |
| High-density lipoprotein (mmol/L)/(mg/dl) | 1.17 ± 0.34/45 ± 13 | 1.21 ± 0.32/47 ± 12 | 0.259 |
| Low-density lipoprotein (mmol/L)/(mg/dl) | 2.69 ± 0.96/104 ± 37 | 2.69 ± 0.80/104 ± 31 | 0.998 |
| Fasting serum insulin (μIU/ml) | 9.2 (5.0–14.4) | 8.2 (5.4–12.2) | 0.379 |
| Serum insulin 2 hours after load (μIU/ml) | 56 (28–109) | 46 (24–94) | 0.034 |
| Homeostasis model assessment for insulin resistance (μIU × mol/L 2 ) | 2.3 (1.2–3.8) | 1.9 (1.2–2.7) | 0.207 |
| High-sensitivity C-reactive protein (mg/L) | 3.0 (1.2–7.3) | 2.0 (0.8–4.6) | 0.001 |
| Number of diseased vessels | 1.7 ± 0.9 | 0 | <0.001 |
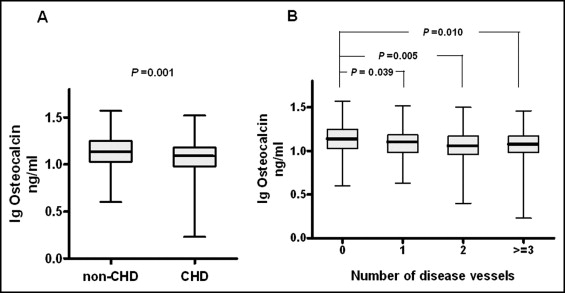
Serum osteocalcin levels in the CHD group were significantly lower (12.2 ng/ml, 9.5 to 15.1) than in the non-CHD group (13.6 ng/ml, 10.7 to 18.0, p = 0.001; Figure 1 ). When all subjects were further divided into 4 groups according to number of diseased vessels (n = 0, 1, 2, ≥3), serum osteocalcin levels were 13.6 ng/ml (10.8 to 17.8), 12.6 ng/ml (9.5 to 15.3), 11.3 ng/ml (9.2 to 14.9), and 12.2 ng/ml (9.5 to 14.8) in groups with 0 and 1 diseased vessel and 2 and ≥3 diseased vessels, respectively (p for trend = 0.005). Level of osteocalcin in the group with 0 diseased vessel was significantly higher than those in groups with 1 diseased vessel and 2 and ≥3 diseased vessels (p = 0.039, 0.005, and 0.010, respectively). Serum osteocalcin levels were not significantly different among groups with ≥1 diseased vessel ( Figure 1 ).
We analyzed correlations between serum osteocalcin levels and risk factors for CHD, including metabolic measurements for glucose, insulin sensitivity, blood pressures, and inflammation ( Table 2 ). Significant negative correlations were observed between serum osteocalcin levels and plasma glucose levels after fasting and after a 2-hour load and HbA 1c (different at p <0.05), adjusting for CHD status. Serum osteocalcin levels were not significantly correlated with insulin levels after fasting and after a 2-hour load, lipid concentrations, and other risk factors.
| Variable | Crude | Control for CHD | ||
|---|---|---|---|---|
| r | p Value | r | p Value | |
| Age (years) | −0.123 | 0.008 | −0.175 | 0.017 |
| Body mass index (kg/m 2 ) | 0.025 | 0.586 | 0.126 | 0.088 |
| Waist (cm) | −0.012 | 0.817 | 0.028 | 0.701 |
| Systolic blood pressure (mm Hg) | 0.003 | 0.948 | 0.054 | 0.464 |
| Diastolic blood pressure (mm Hg) | 0.006 | 0.900 | 0.040 | 0.588 |
| Fasting plasma glucose (mmol/L) | −0.059 | 0.213 | −0.148 | 0.044 |
| Plasma glucose 2 hours after load (mmol/L) | −0.068 | 0.161 | −0.149 | 0.043 |
| Hemoglobin A 1c (%) | −0.090 | 0.078 | −0.186 | 0.011 |
| Triglyceride (mmol/L)/(mg/dl) | −0.026 | 0.587 | −0.028 | 0.707 |
| Total cholesterol (mmol/L)/(mg/dl) | 0.008 | 0.862 | 0.068 | 0.356 |
| High-density lipoprotein (mmol/L)/(mg/dl) | 0.031 | 0.523 | 0.022 | 0.771 |
| Low-density lipoprotein (mmol/L)/(mg/dl) | −0.010 | 0.843 | 0.032 | 0.661 |
| Fasting serum insulin (μIU/ml) | 0.020 | 0.713 | 0.029 | 0.698 |
| Post load 2 hour serum insulin (μIU/ml) | −0.020 | 0.712 | 0.041 | 0.578 |
| Homeostasis model assessment for insulin resistance (μIU × mol/L 2 ) | −0.002 | 0.977 | −0.077 | 0.297 |
| High-sensitivity C-reactive protein (mg/L) | 0.012 | 0.808 | −0.135 | 0.067 |
Stay updated, free articles. Join our Telegram channel

Full access? Get Clinical Tree


